2735
Intrasession reliability of arterial spin labeled MRI measured perfusion in GBM at 3T1Department of Radiology, University of Texas Southwestern Medical Center, Dallas, TX, United States, 2Advanced Imaging Research Center, University of Texas Southwestern Medical Center, Dallas, TX, United States, 3Department of Neurology and Neurotherapeutics, University of Texas Southwestern Medical Center, DALLAS, TX, United States, 4Department of Neurological Surgery, University of Texas Southwestern Medical Center, DALLAS, TX, United States, 5Harold C. Simmons Cancer Center, University of Texas Southwestern Medical Center, DALLAS, TX, United States, 6Department of Population and Data Sciences, University of Texas Southwestern Medical Center, Dallas, TX, United States
Synopsis
A 3D TSE using Cartesian acquisition with spiral profile reordering (CASPR) in combination with pseudo-continuous arterial spin labeling (pCASL) was developed to improve the robustness of ASL measured perfusion to increased B0 inhomogeneities in GBM patients. Previous results showed high intrasession reliability of this method in GBM patients. In this study, we compared the 3D TSE-CASPR measured perfusion with clinically available 3D GraSE at 3T. With 24 GBM imaging sessions, the results showed that 3D pCASL with TSE-CASPR is more robust to B0 inhomogeneities and has higher intrasession reliability than the clinical sequence, 3D pCASL with GraSE at 3T.
Introduction
Arterial spin labeled (ASL) MRI has emerged as a promising method to measure non-contrast perfusion in the brain. However, for application in glioblastoma (GBM) patients, who often have a craniotomy, almost all readout acquisitions including EPI, GraSE or spiral based TSE acquisitions are prone to suffer from B0 inhomogeneities. This influences both the accuracy of ASL measured perfusion and co-registration to structural images. Recently, a 3D TSE using Cartesian acquisition with spiral profile reordering (CASPR) in combination with pseudo-continuous ASL (pCASL) was developed to improve the robustness of ASL measured perfusion (1). Preliminary results showed that 3D pCASL with TSE-CASPR can provide robust cerebral blood flow maps with high intra-session reliability in GBM patients (2). In this study, we compared the intrasession reliability of 3D pCASL with TSE-CASPR and the clinically available 3D pCASL with GraSE measured brain perfusion in a larger cohort of GBM patients at 3T.Methods
Subjects: Under IRB approved protocols, 2 healthy volunteers and 9 newly diagnosed GBM patients with a mean age of 55 ± 14 years were recruited and underwent 24 imaging sessions on a 3T MRI scanner (Ingenia, Philips Healthcare).Image Acquisition and Analysis: MRI scans were acquired with a 32-channel head coil. In each imaging session, routine clinical imaging for GBM patients was performed along with two repetitions of 3D pCASL with TSE-CASPR and 3 dynamics of 3D pCASL with GraSE for each subject. The protocol began with 3D T1W MPRAGE, followed by the first run of 3D TSE-CASPR pCASL, T2 FLAIR, SWI and then the second run of 3D TSE-CASPR pCASL, followed by 3D pCASL with GraSE. ASL scans were acquired in the axial plane with the following parameters (according to the ASL consensus paper (3)): TR/TE = 6000/14 ms, FOV = 220x220x110 mm3, matrix = 64x64 with 36 slices, acquired resolution = 3.5x3.5x6 mm3, reconstructed resolution = 3x3x3 mm3, echo spacing = 2.8 ms, ETL = 80, label duration = 1.8 s, post-label delay = 1.8 s, 1 repetition, 4 background suppression pulses and acquisition time = 3:00 minutes. A M0 image was acquired using the same acquisition parameters in 1:30 minutes. For comparison, ASL images were also acquired using the vendor supplied 3D GraSE acquisition in all subjects matching the same acquisition parameters as the 3D TSE-CASPR except for: TR/TE = 3900/14 ms, signal averages = 3, and total acquisition time = 4:30 mins, including a M0 acquisition, matching the total acquisition time of 3D TSE-CASPR. Both 3D pCASL with TSE-CASPR and 3D pCASL with GraSE images were reconstructed on the scanner including k-space filtering and complex k-space subtraction (4).
Perfusion difference images were converted to NIfTI with MRIcron software followed by brain extraction with FSL. The NIfTI images were processed to quantify CBF maps in MATLAB based on the ASL consensus paper. CBF maps were co-registered to the standard MNI space with FSL. Standard ROI templates were used to extract perfusion values for normal appearing grey matter (NAGM), while tumor ROIs were manually drawn on areas of hyperperfusion with further confirmation on structural images.
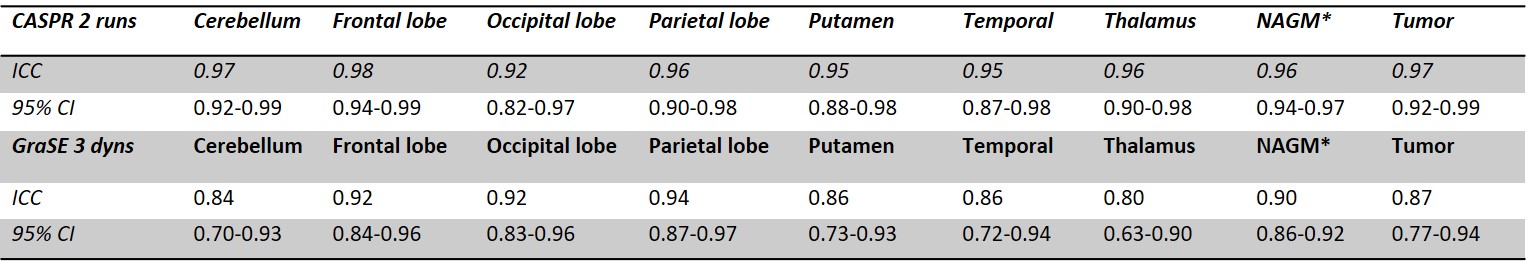
Statistical Analysis: The reliability between the two runs of 3D pCASL with TSE-CASPR or 3 dynamics of 3D pCASL with GraSE measurements were measured using linear regression analysis, intraclass correlation coefficient (ICC) and Bland-Altman plots. ICC estimates and their 95% confident intervals (CI) were calculated using SPSS statistical package version 24.0 (SPSS Inc, Chicago, IL) based on a single-measurement, absolute-agreement, 2-way mixed-effects model.
Results
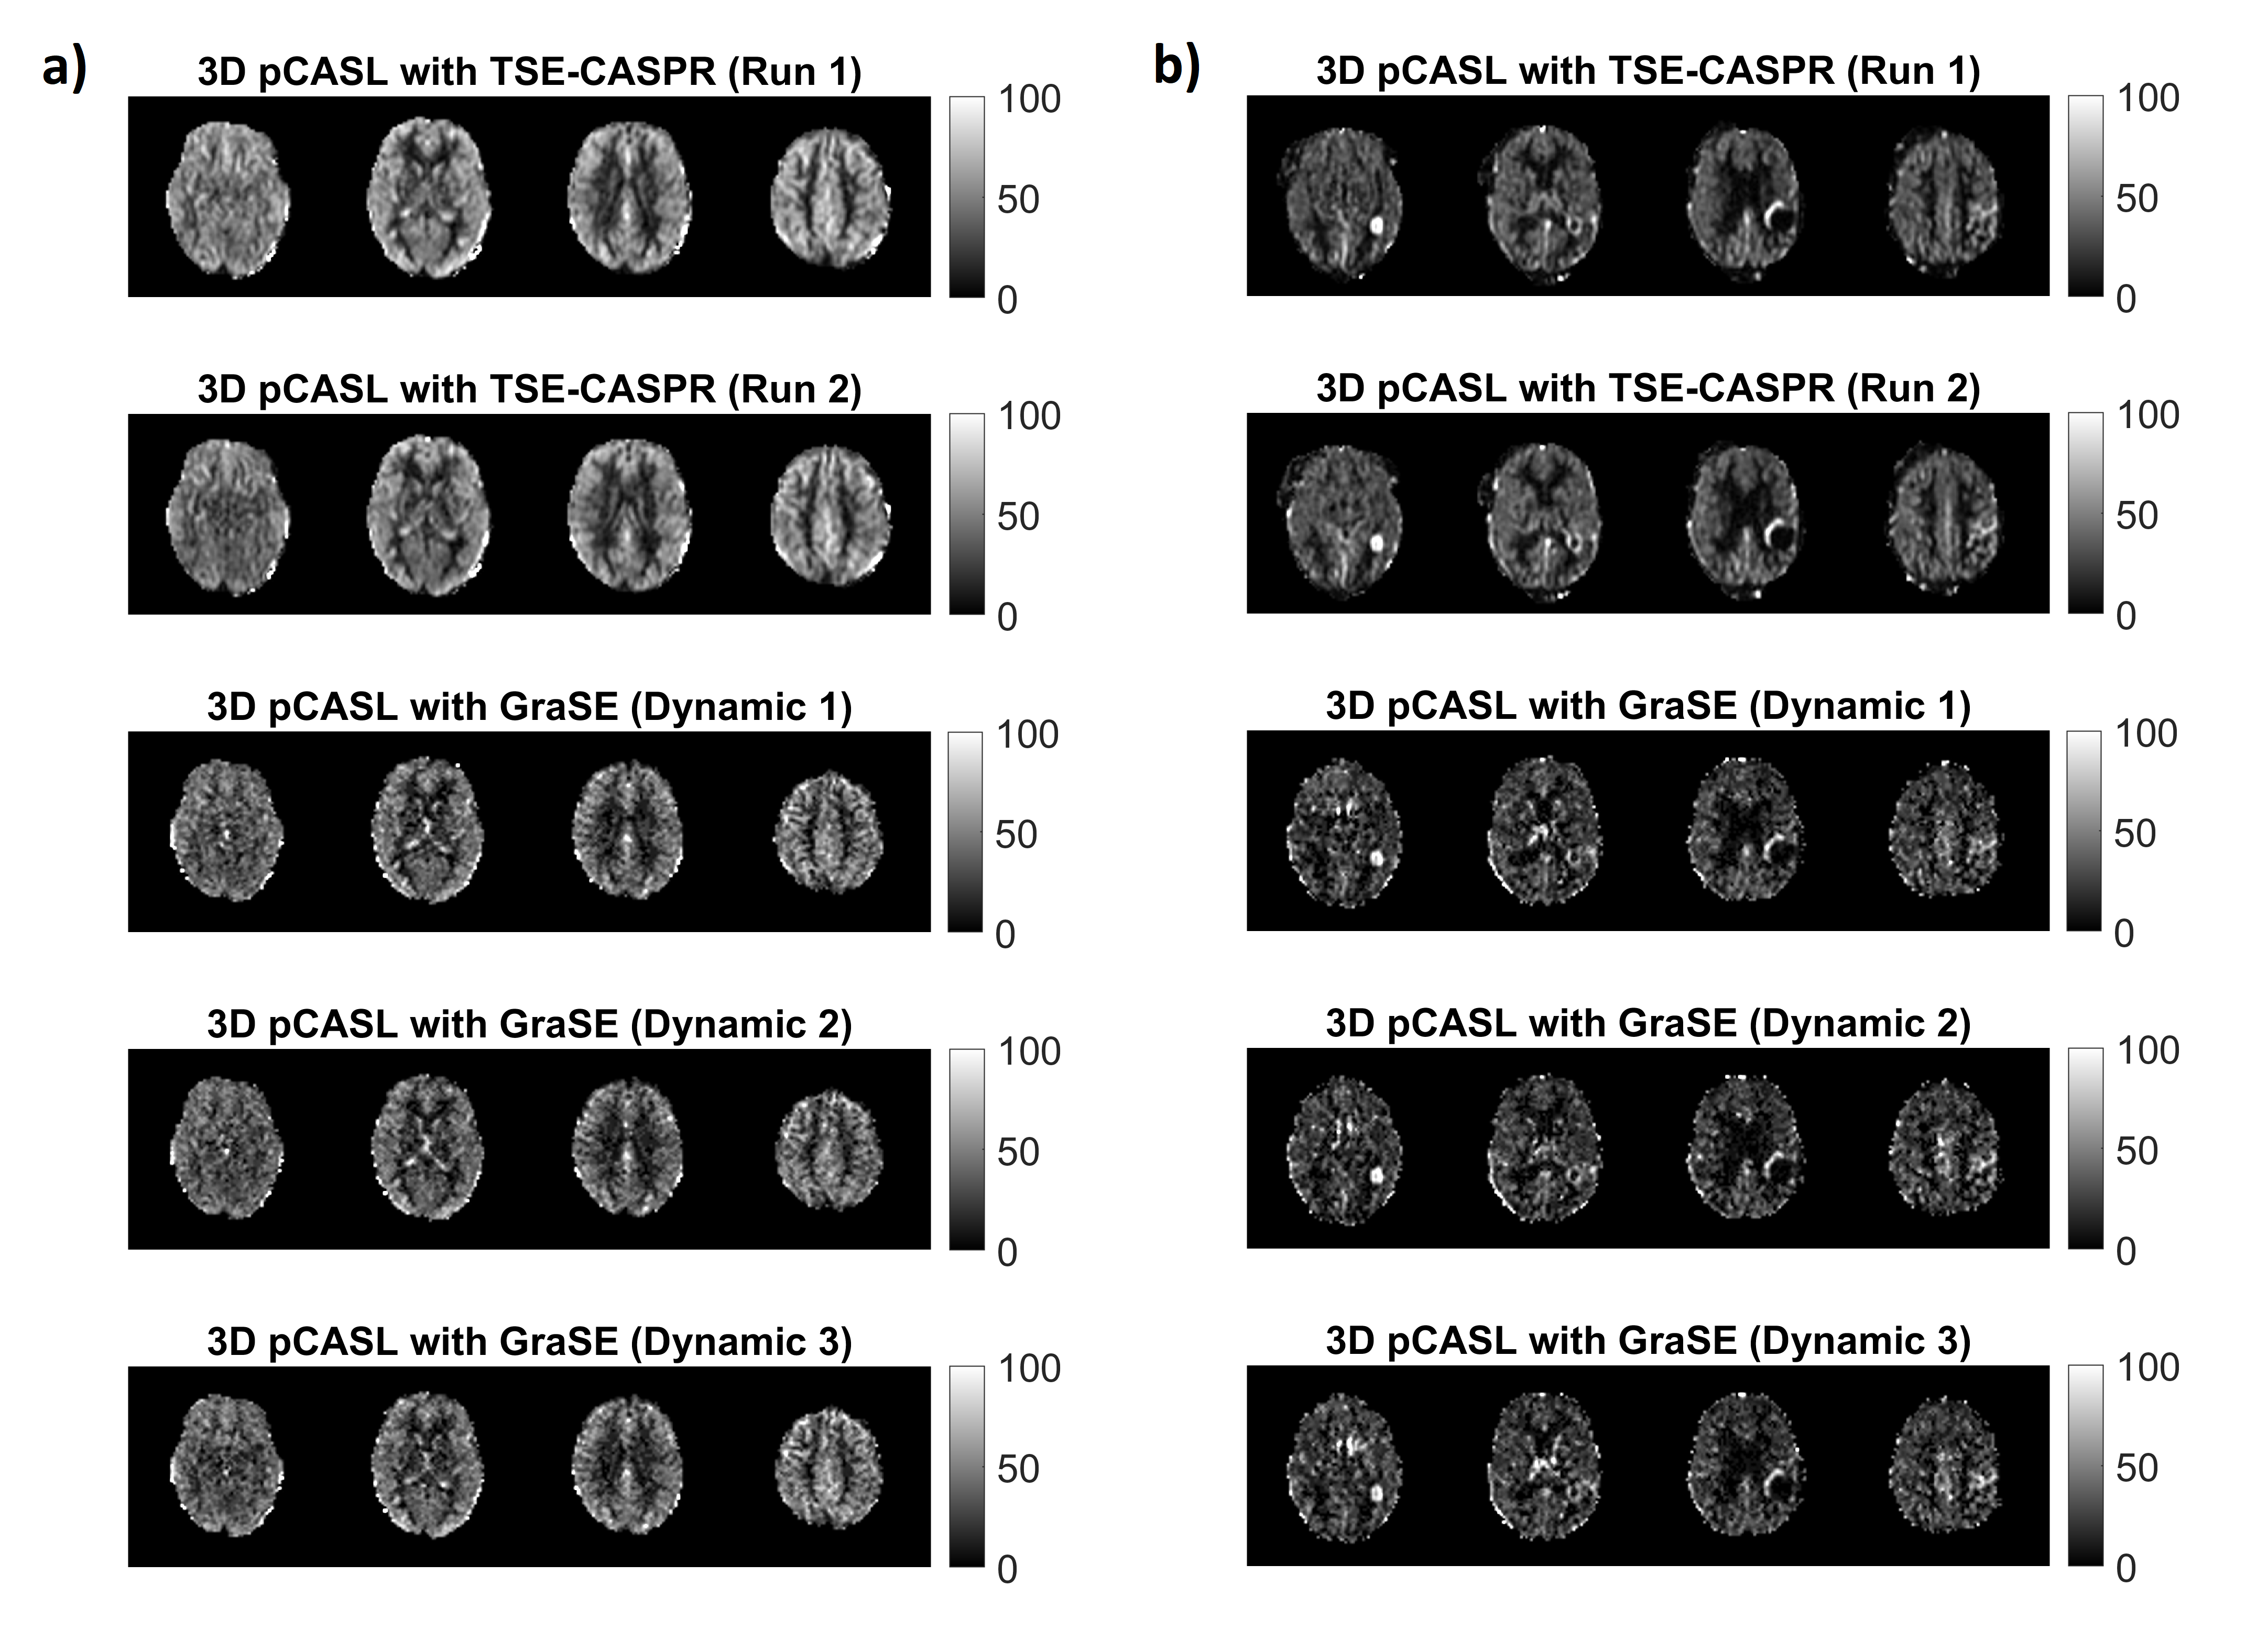
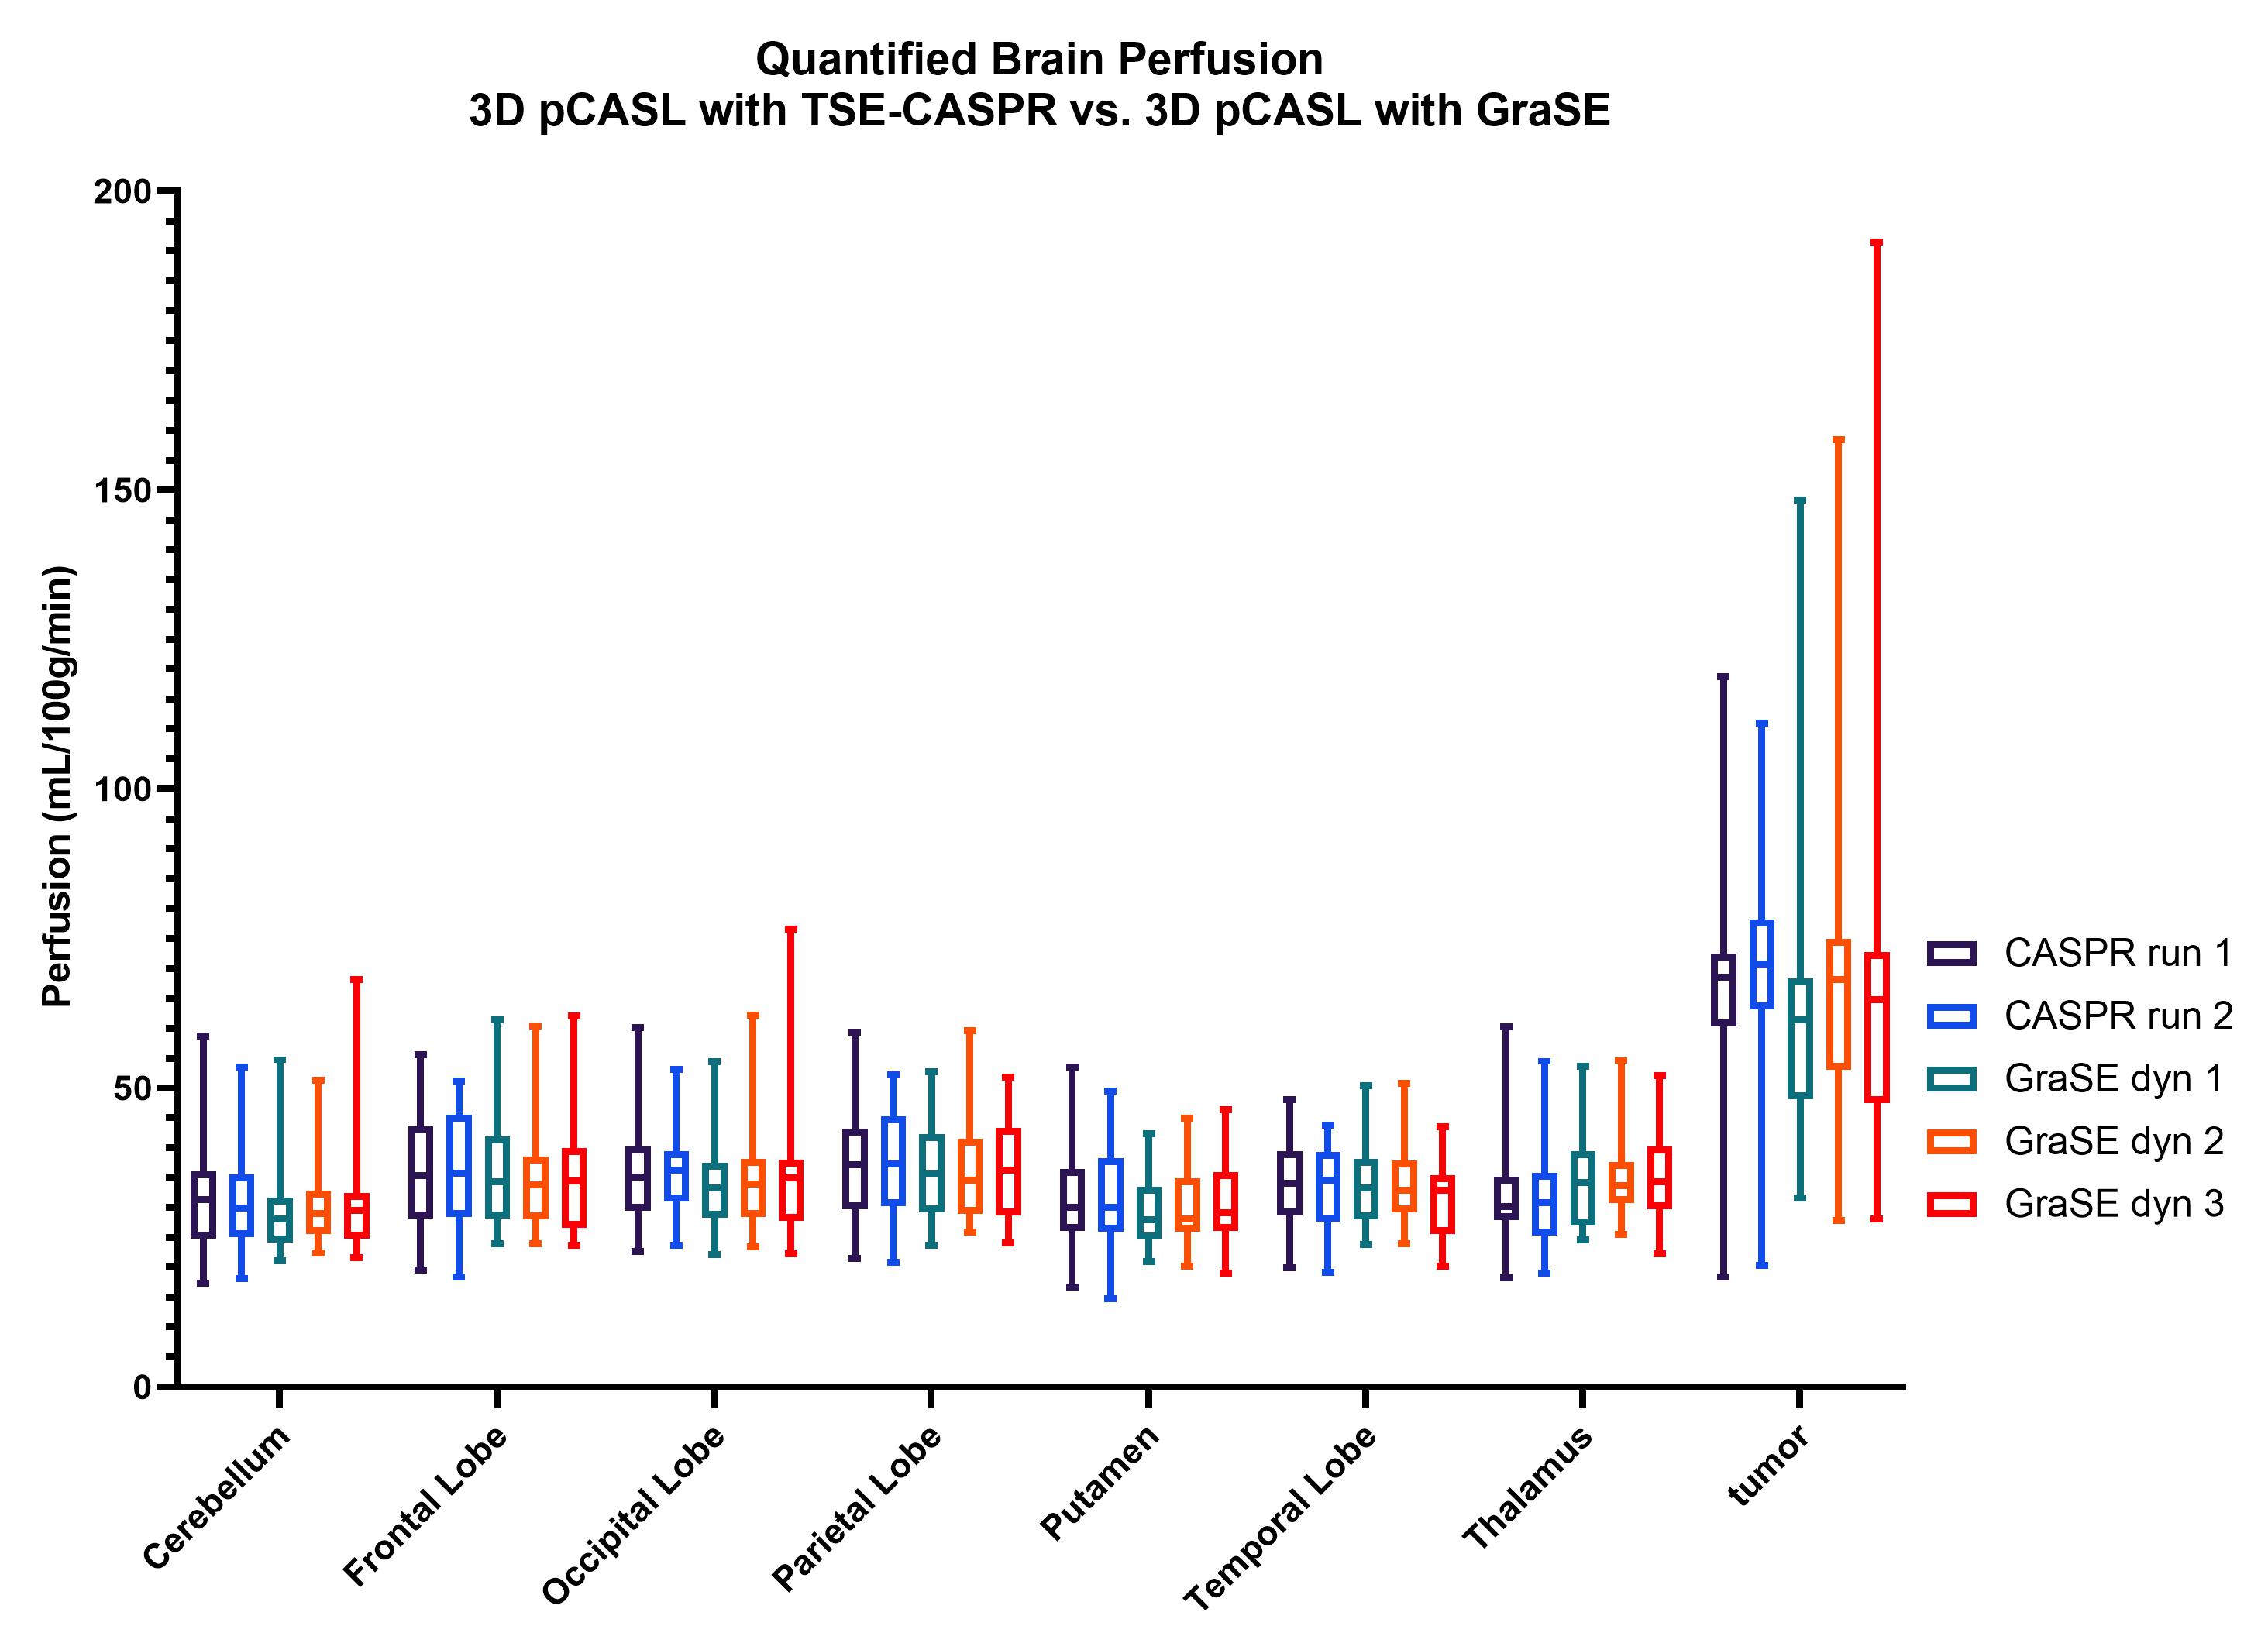
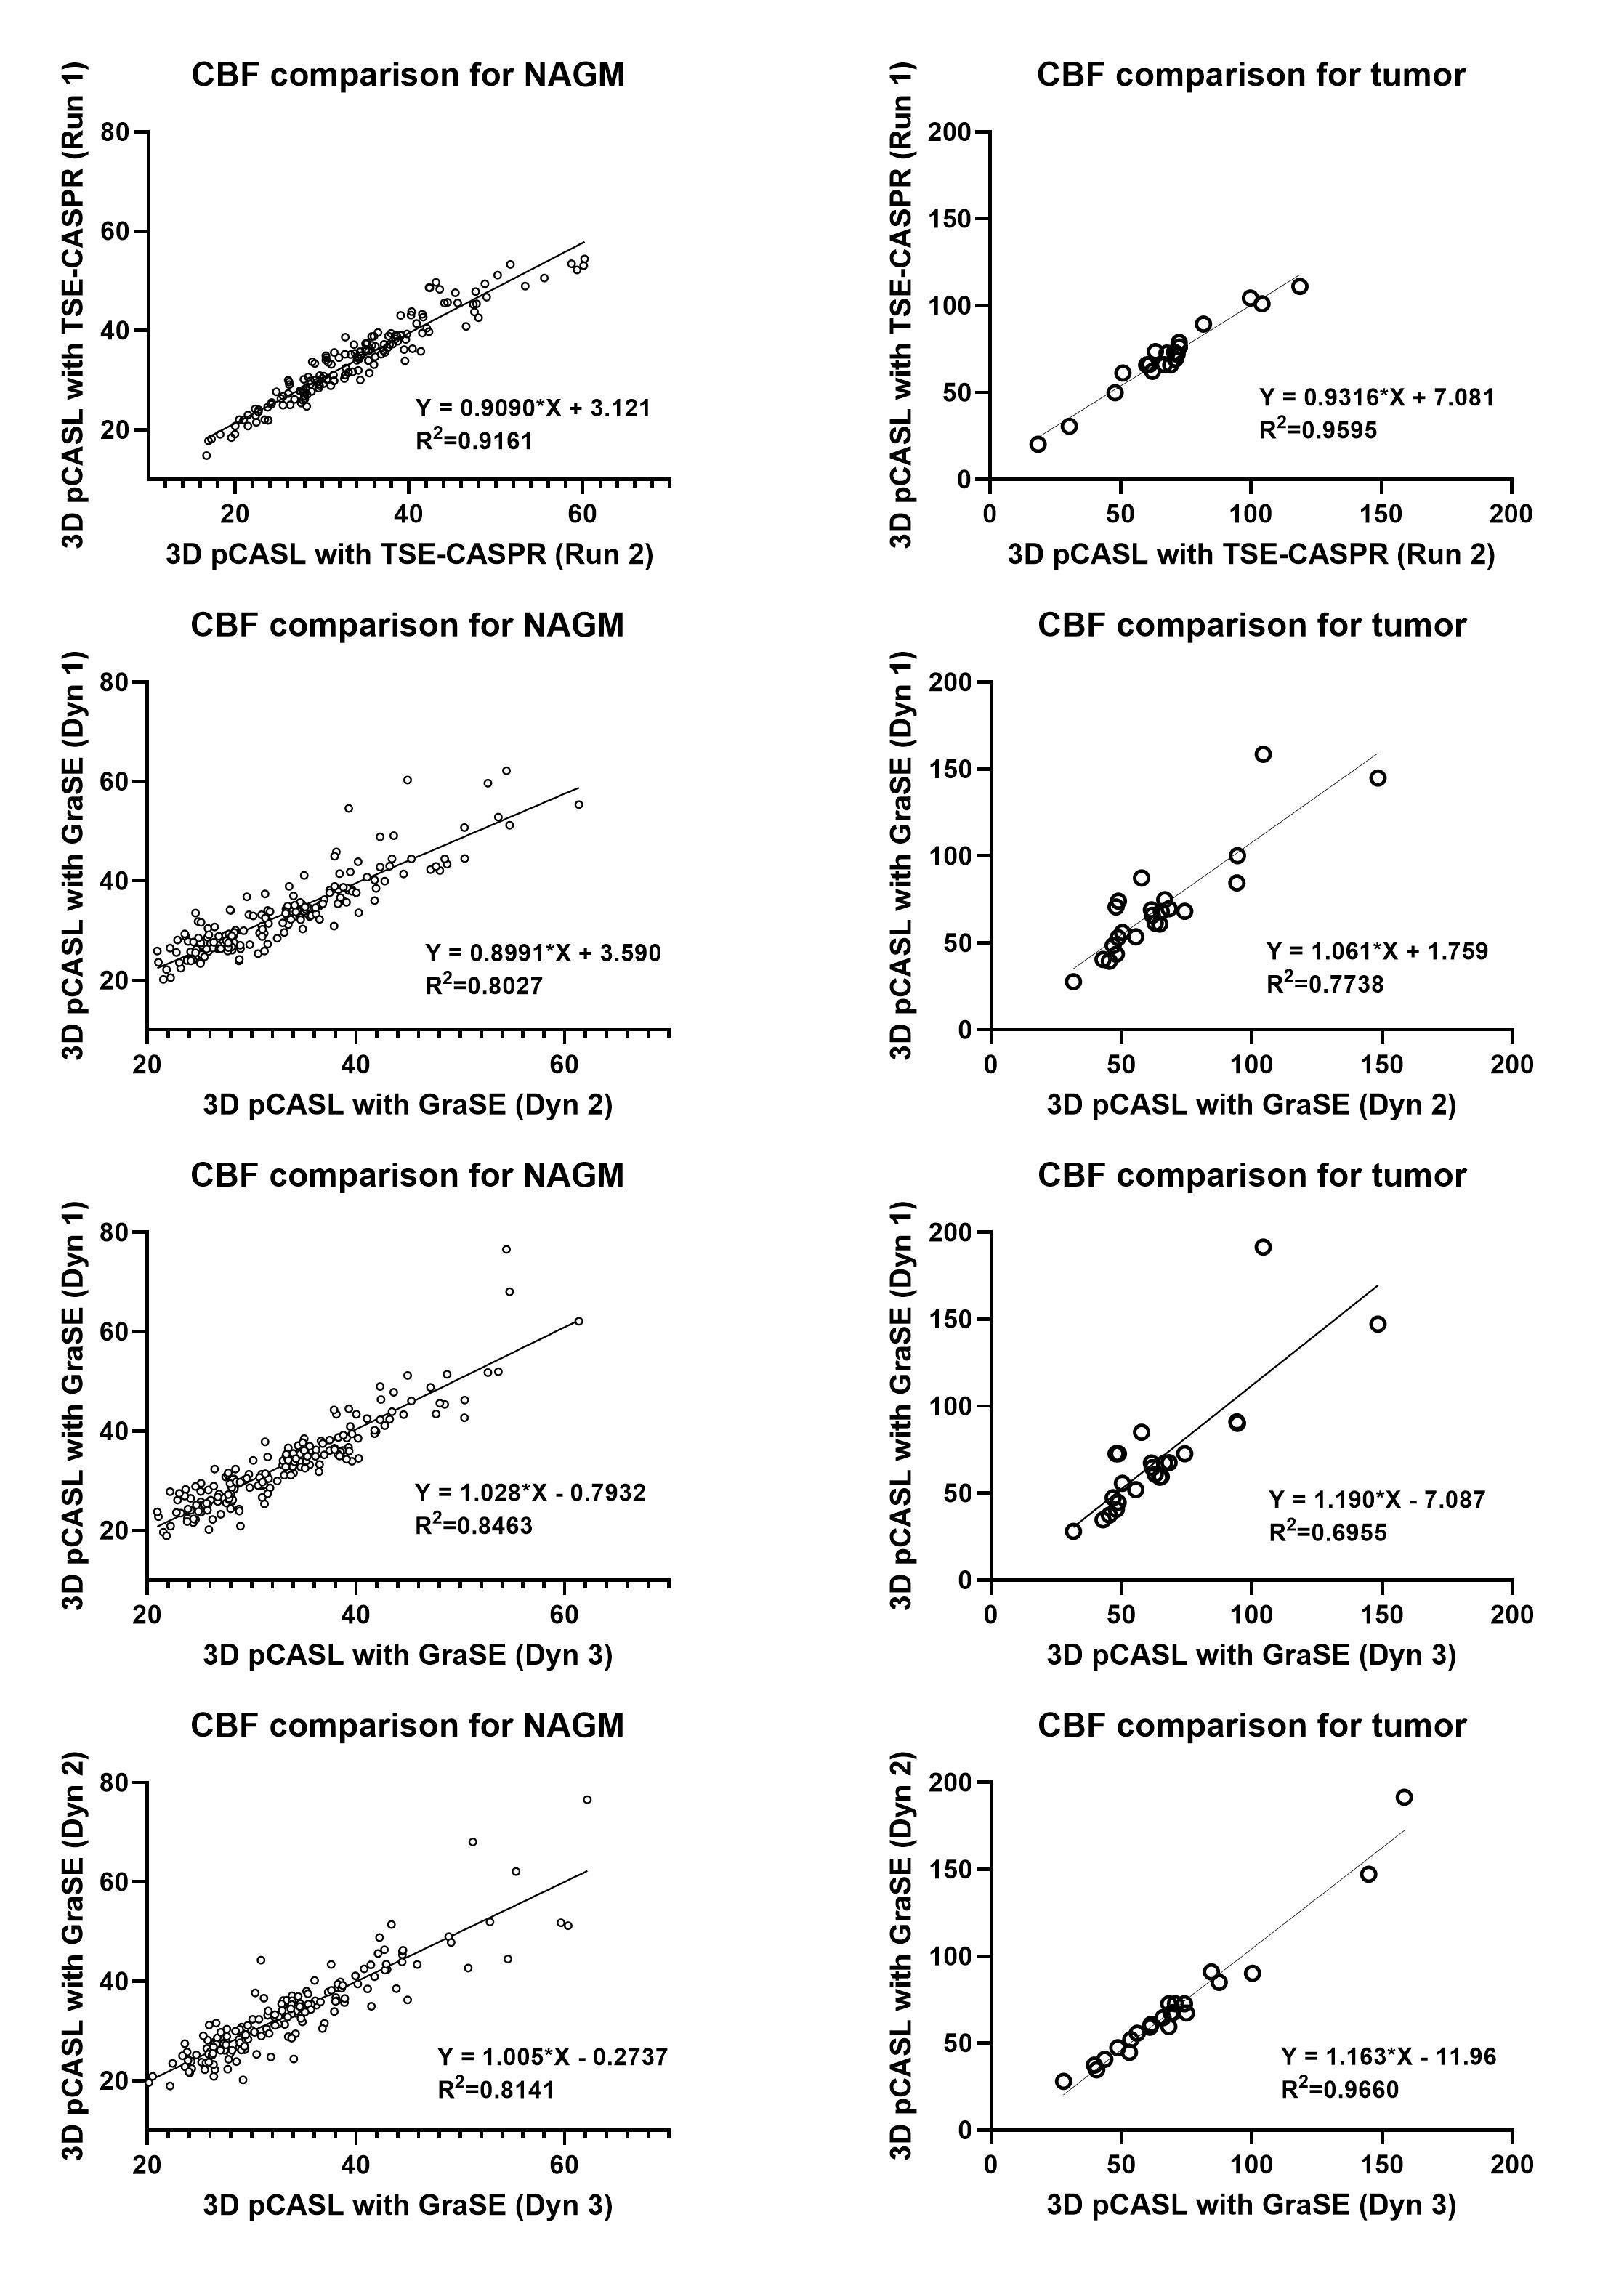
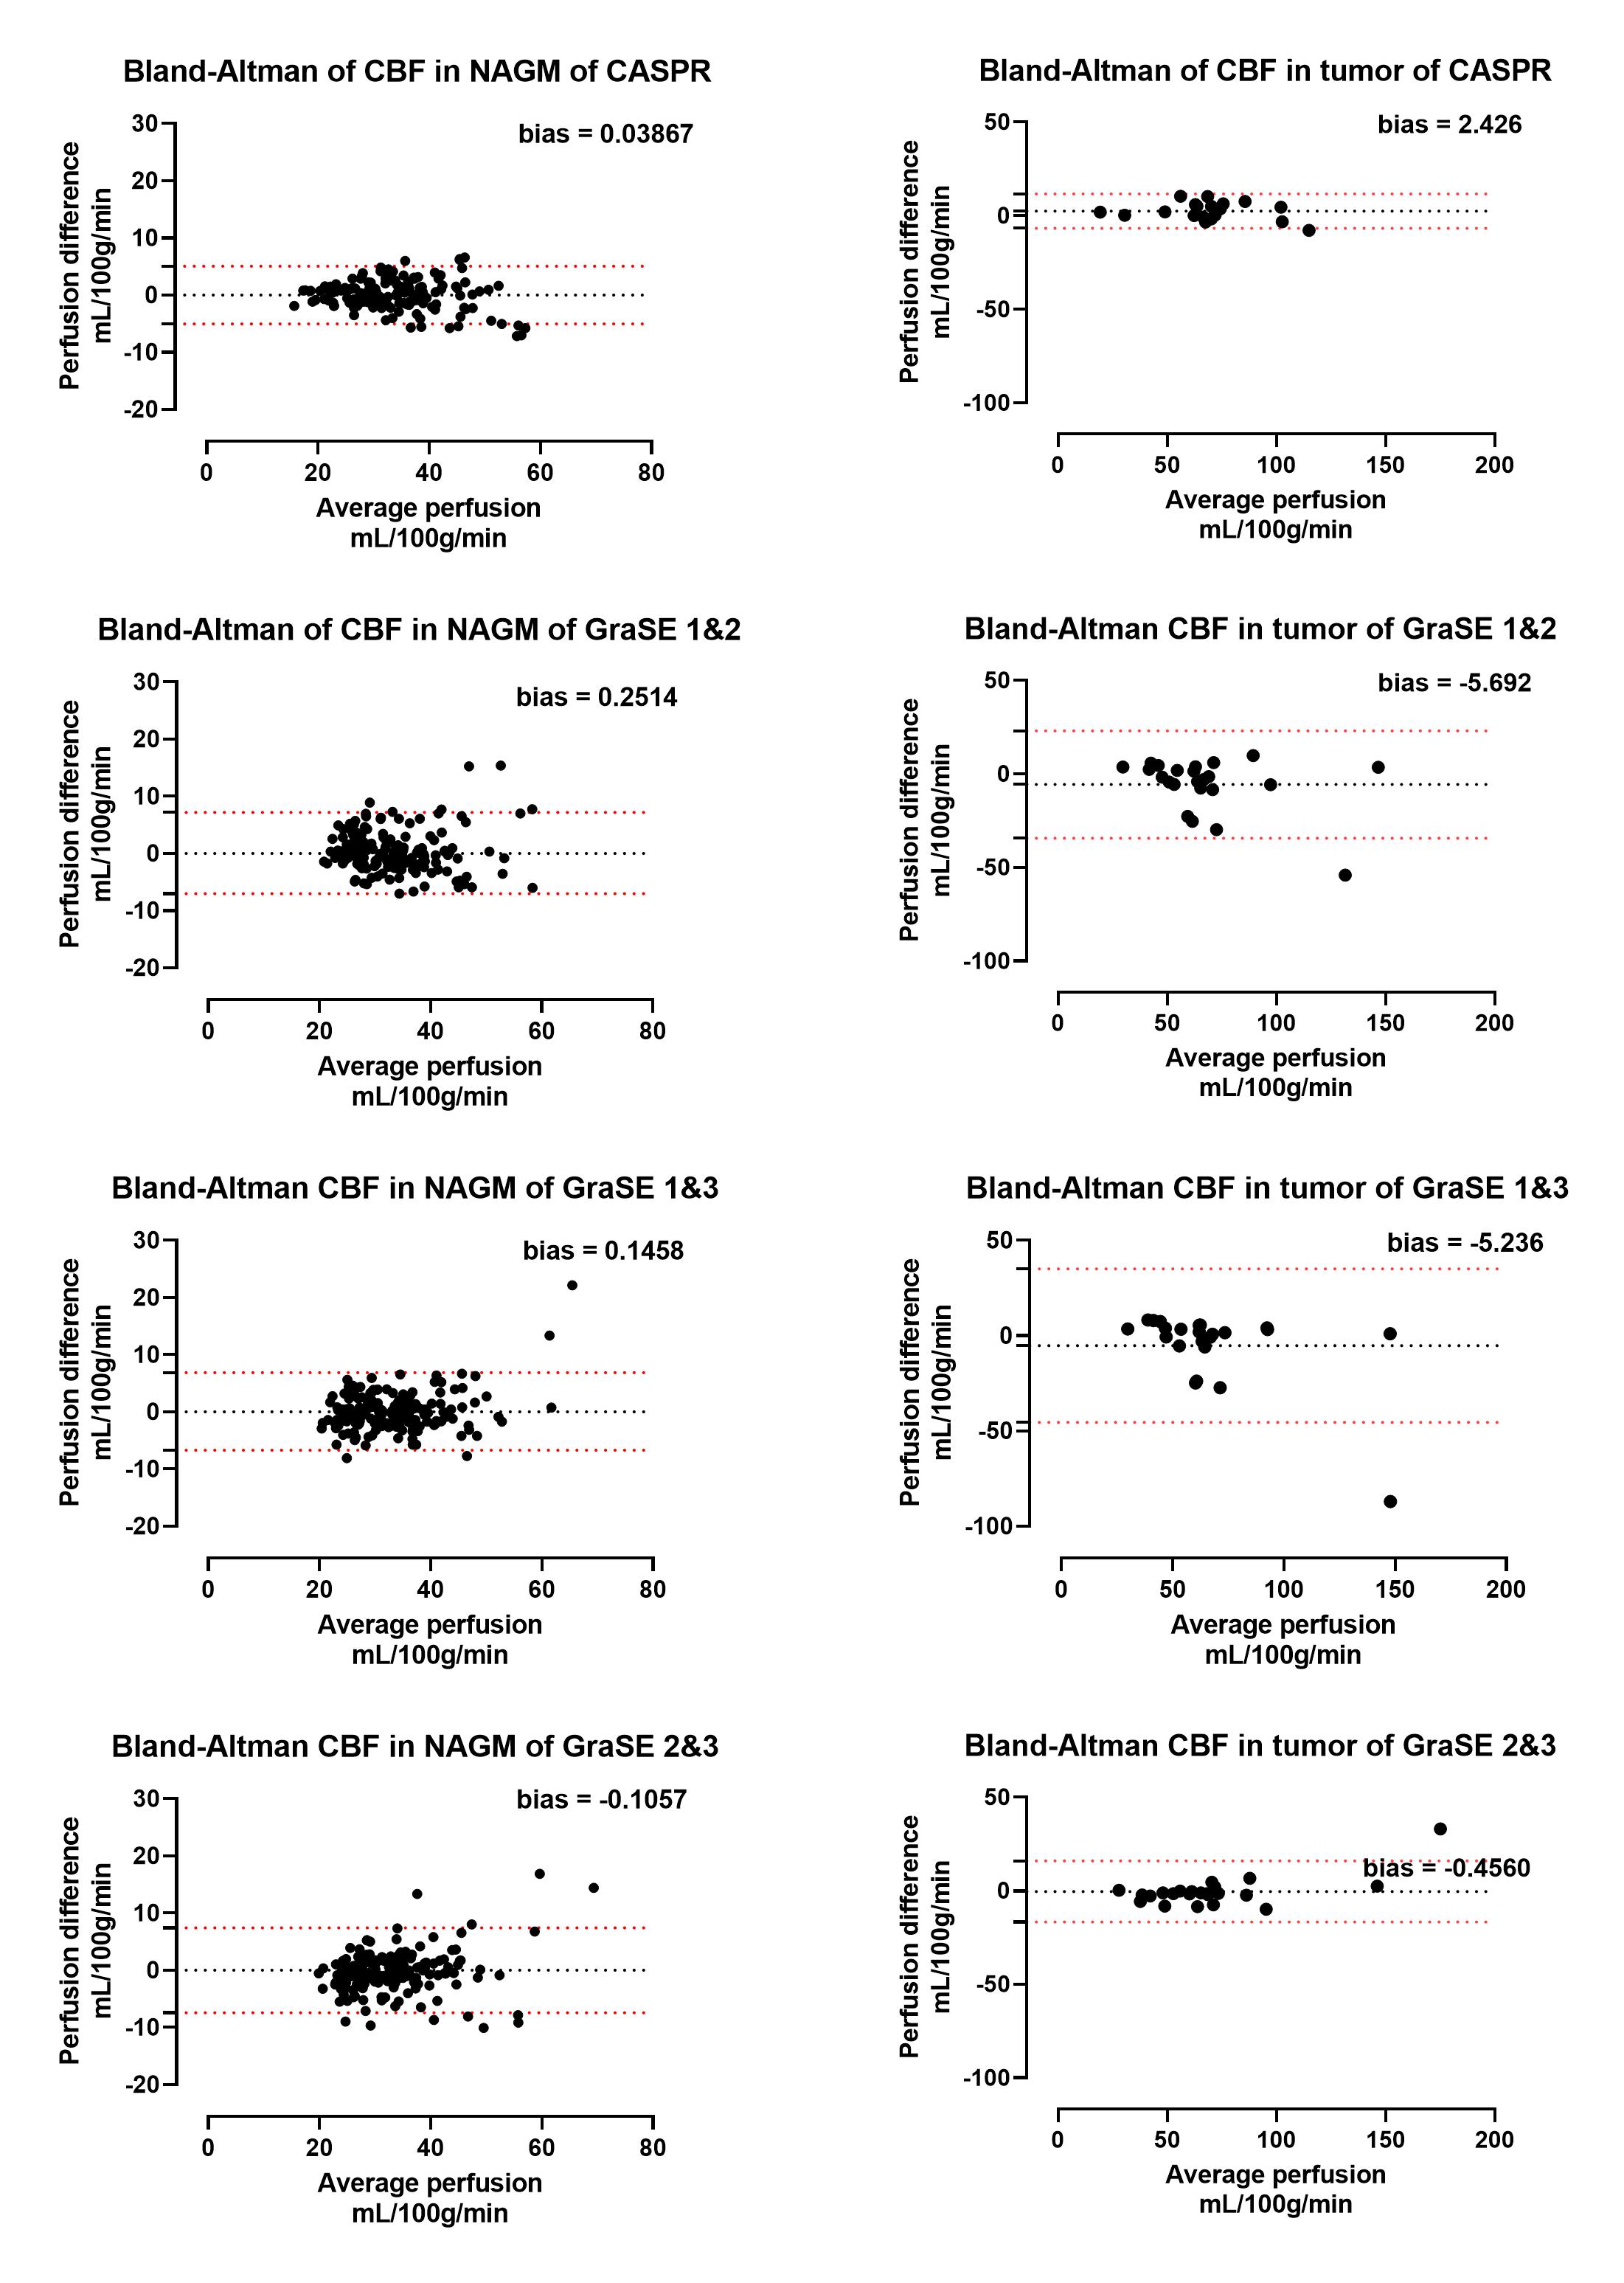
Both 3D pCASL with TSE-CASPR and 3D pCASL with GraSE provided robust CBF maps in all subjects with similar values in healthy volunteers (Fig. 1a), and in GBM patients (Fig. 1b). Compared to 3D GraSE, the CBF maps with 3D TSE-CASPR had less image distortion in GBM patients (Fig. 1b). All measured perfusion for each non-tumor ROI were in the normal range as shown in Fig. 2. The correlation plots (Fig. 3) and Bland-Altman plots (Fig. 4) together with 95% CI of the CBF values for NAGM and tumors showed better reliability of 3D TSE-CASPR than 3D GraSE. The ICC for both NAGM and tumor was higher for 3D TSE-CASPR as shown in Table 1.Discussion and Conclusion
Both 3D pCASL with TSE-CASPR and 3D pCASL with GraSE provided robust CBF maps in healthy volunteers and GBM patients. Both techniques showed good intrasession reliability, although, 3D pCASL with TSE-CASPR was more robust to B0 inhomogeneities and had higher intrasession repeatability than 3D pCASL with GraSE at 3T, indicating it may be an better non-contrast and non-invasive method for longitudinal GBM treatment response management. The multiple dynamics of 3D GraSE were treated as independent acquisitions for this analysis, which contributed to lower SNR, compared to two independent 3D TSE-CASPR acquisitions. Current studies are planned to acquire two independent runs of 3D GraSE, each with 3 averages for better evaluation.Acknowledgements
This work was supported by NIH/NCI grant U01CA207091.References
1. Greer, J. S., et al., MRM, 2019. 82(5): p.1713-1724.
2. Zhou, L., et al., Tomography, 2020. 6(2): p. 139-147
3. Alsop, D.C., et al., MRM, 2015. 73(1): p. 102-116.
4. Wang, Y et al., ISMRM 2019:4962.
Figures