2734
Identification of IDH1 mutation status in glioblastoma using multi-delay 3D arterial spin labeling perfusion MRI: a pilot study1State Key Laboratory of Brain and Cognitive Science, Beijing MRI Center for Brain Research, Institute of Biophysics, Chinese Academy of Sciences, Beijing, China, 2University of Chinese Academy of Sciences, Beijing, China, 3Department of Neurosurgery, Beijing Tiantan Hospital of Capital Medical University, Beijing, China, 4Shenzhen Institutes of Advanced Technology, Chinese Academy of Sciences, Shenzhen, China, 5Siemens Shenzhen Magnetic Resonance Ltd, Shenzhen, China, 6CAS Center for Excellence in Brain Science and Intelligence Technology, Chinese Academy of Sciences, Beijing, China, 7Mark & Mary Stevens Neuroimaging and Informatics Institute, Keck School of Medicine, University of Southern California, Los Angeles, CA, United States, 8Beijing Institute for Brain Disorders, Beijing, China
Synopsis
Arterial spin labeling (ASL) perfusion MRI with single post-labeling delay (PLD) has been used to noninvasively predict the IDH1 mutation status in glioblastoma patients. However, single-delay ASL can make inaccurate estimations of cerebral blood flows (CBF) due to the variability of arterial transit times (ATT) among individuals. In this study, we applied multi-delay 3D ASL technique with multiple hemodynamic parameters including quantitative ATT, ATT-corrected CBF and arterial cerebral blood volume (aCBV) in glioblastoma. Our results show that aCBV-based relative perfusion parameters may provide a better identification of IDH1 mutation status and is worthy of further verification in future studies.
Introduction
Glioblastoma (GBM) is a highly aggressive type of glioma and the most common malignant brain tumor in adults. Previous studies revealed that isocitrate dehydrogenase 1 (IDH1) mutations are mainly present in secondary GBMs with a significantly better prognosis, but very rare in primary GBMs1–3. Thus, the accurate preoperative identification of IDH1 mutation status is important to clinical treatment and prognosis. Arterial spin labeling (ASL) perfusion-weighted imaging has been applied in GBM patients to noninvasively predict the IDH1 mutation status4,5. However, these studies employed the conventional ASL with single post-labeling delay (PLD), whose inappropriate settings may lead to inaccurate estimation of the cerebral blood flow (CBF) due to the variability of arterial transit times (ATT) among individuals6. To solve this problem, multi-delay pseudo-continuous ASL (pCASL) was developed to simultaneously provide multiple hemodynamic parameters including ATT, ATT-corrected CBF and arterial cerebral blood volume (aCBV)7. To the best of our knowledge, there has been no study that applies multi-delay ASL to GBM patients. Therefore, this study aims to show the patterns of cerebral perfusion in GBM patients using multi-delay 3D ASL7,8 and explore the potential values of these multi-parametric perfusion maps in identifying the IDH1 mutation status in GBMs.Methods
Patients: After IRB-approved informed consent was obtained, 60 preoperative patients with suspected glioma were recruited from Beijing Tiantan Hospital, and scanned on a 3T MRI system (MAGNETOM Prisma, Siemens Healthcare, Erlangen, Germany) at Beijing MRI Center for Brain Research. Among them, 6 treatment-naïve patients (45.3±10.5 years, 2 females) with pathologically confirmed GBM were included in this study.Imaging parameters: The imaging protocol included T2-FLAIR, DWI, multi-delay ASL, pre- and post-contrast T1-MPRAGE sequences. ASL scan was performed using a 5-delay pCASL protocol with background suppressed 3D GRASE readout7,8 (resolution = 2.5×2.5×3mm3, 40 slices, PLDs = 0.5/1/1.5/2/2.5s, labeling pulse duration = 1.5s, total scan time 7min11s).
Data processing: Post-processing of multi-delay ASL data was performed offline in CereFlow (Translational MRI, LLC, Los Angeles, CA) using the non-linear iterative curve-fitting approach8. The aCBV map was generated by the product of ATT and CBF maps, and thus indicating the arterial blood volume from the labeling plane to the imaging voxels7. Then quantitative perfusion maps, together with anatomical images were co-registered to pre-contrast T1 images. Tumoral regions (ROI1) and contralateral regions (ROI2) were manually delineated using ITK-SNAP9 on T2-FLAIR images referring to post-contrast T1 and DWI images (Figs. 1 and 2). The absolute maximum CBF values (CBFmax) in both ROIs were obtained. Then the relative CBFmax (rCBFmax) were computed by dividing CBFmax in ROI1 by CBFmax in ROI2. Similarly, the rCBFmean, raCBVmax, and raCBVmean were calculated.
Data analysis: The patients were divided into IDH1-mutant (IDH1m) and IDH1-wild type (IDH1w) groups according to the IDH1 mutation status. Considering the relatively small sample size, results of measured relative perfusion values for both groups were displayed in scatter plots with descriptive statistics. Besides, Pearson correlation analysis was carried out to evaluate the relationship between relative CBF and aCBV perfusion values using GraphPad Prism (GraphPad Software, San Diego, California). Probability (p) values < 0.05 were considered statistically significant.
Results
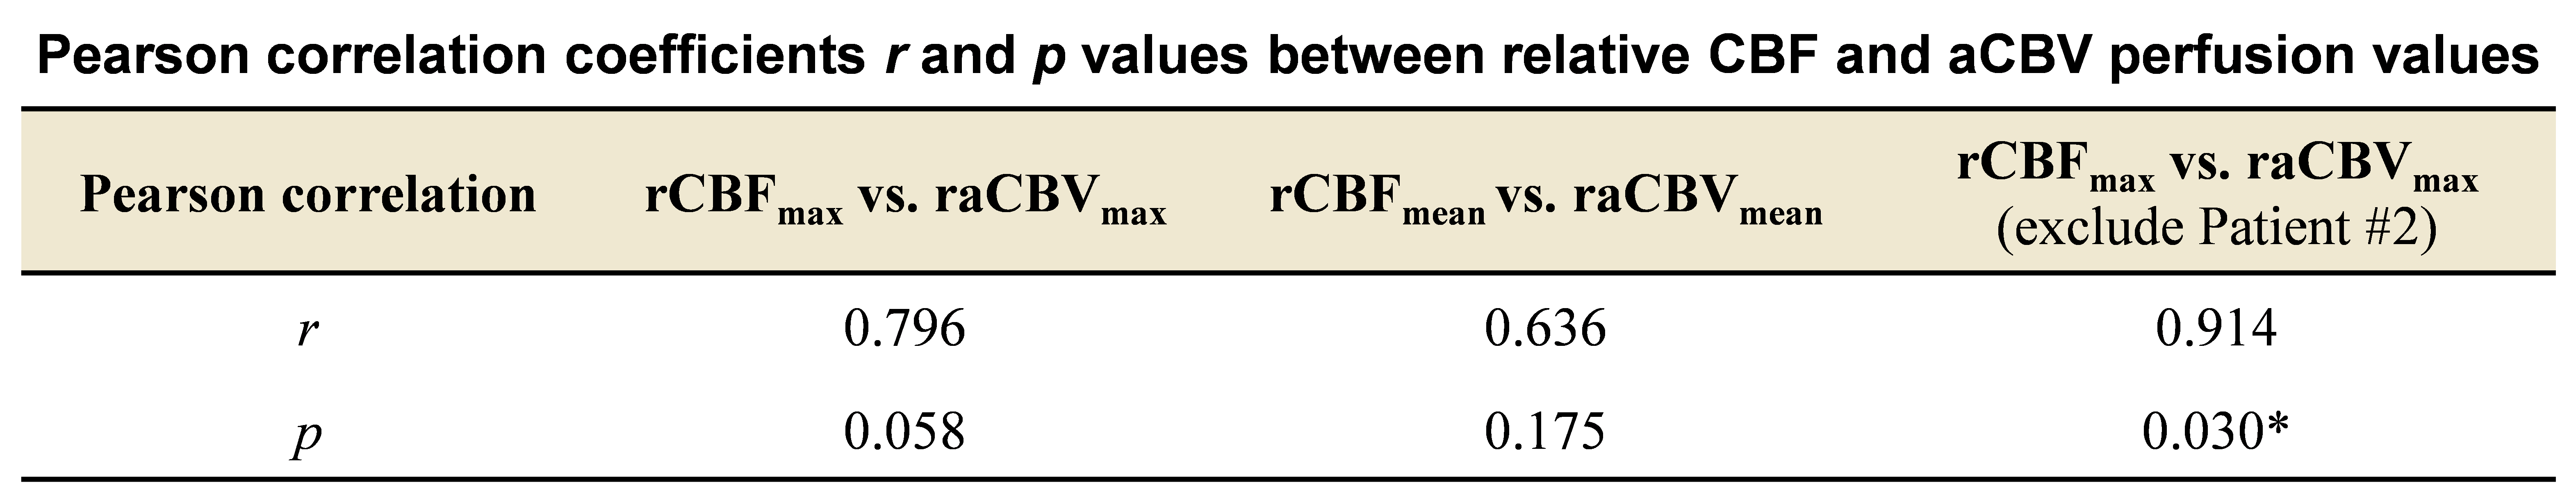
As summarized in Table 1, there are 3 IDH1m patients (38.3±9.3 years, 1 female), and 3 IDH1w patients (52.3±6.4 years, 1 female) involved in this study. As shown in Fig. 3, in IDH1w group, the relative CBF and aCBV perfusion values of all patients are larger than 1. In IDH1m group, all patients except Patient #2 exhibit relative CBF perfusion values less than 1, whereas all patients show relative aCBV perfusion values less than or almost equal to 1. This is because CBF values were overestimated around large vessels in Patient #2 (Fig. 1), which may be caused by arteriovenous shunting10. As displayed in Table 2, after excluding the data of Patient #2, there is a moderately significant correlation between rCBFmax and raCBVmax (r = 0.914, p = 0.030).Discussion
Previous ASL studies4,5 have shown that the relative (or normalized) CBF in contrast-enhancing lesions was significantly higher in IDH1w GBM patients than in IDH1m GBM patients. In this study, IDH1w GBM patients tend to have higher relative perfusion values (especially for raCBVmax and raCBVmean) in enhanced lesions than IDH1m GBM patients. However, the sample size used for this study is relatively small. Therefore, further studies enrolling more GBM patients are needed to test the statistical difference.ATT values can be variable in different regions of the brain or between subjects (Figs. 1 and 2). Thus, multi-delay ASL was applied to provide ATT-corrected CBF. Interestingly, in Patient #2, overestimated CBF values are still observed around large vessels, where ATT values are shortened. However, aCBV values are not overestimated around these large vessels. Therefore, aCBV may be a more robust perfusion imaging parameter than conventionally used CBF, and thus may be used for more accurate identification of the IDH1 mutation status in GBM patients.
Conclusion
Our results show the potential value of relative CBF and aCBV perfusion parameters in predicting the IDH1 mutation status in GBM. The aCBV based relative perfusion parameters may provide a better performance in predicting IDH1 mutation status in GBM patients and is worthy of further verification in future studies with more patients.Acknowledgements
This work was supported in part by the Beijing Natural Science Foundation (L182055), the National Natural Science Foundation of China grants (81871350, 81961128030, and 81627901), GJHZ20180928120207356, the Ministry of Science and Technology of China grants (2019YFC0120901, 2019YFA0707103), and the Strategic Priority Research Program of Chinese Academy of Science (XDB32010300).References
1. Nobusawa S, Watanabe T, Kleihues P, Ohgaki H. IDH1 mutations as molecular signature and predictive factor of secondary glioblastomas. Clinical Cancer Research. 2009;15(19):6002–6007.
2. Ichimura K, Pearson DM, Kocialkowski S, et al. IDH1 mutations are present in the majority of common adult gliomas but rare in primary glioblastomas. Neuro-oncology. 2009;11(4):341–347.
3. Ohgaki H, Kleihues P. The definition of primary and secondary glioblastoma. Clinical cancer research. 2013;19(4):764–772.
4. Yamashita K, Hiwatashi A, Togao O, et al. MR imaging–based analysis of glioblastoma multiforme: estimation of IDH1 mutation status. American Journal of Neuroradiology. 2016;37(1):58–65.
5. Yoo R-E, Yun TJ, Hwang I, et al. Arterial spin labeling perfusion-weighted imaging aids in prediction of molecular biomarkers and survival in glioblastomas. European Radiology. 2020;30(2):1202–1211.
6. Alsop DC, Detre JA, Golay X, et al. Recommended implementation of arterial spin-labeled perfusion MRI for clinical applications: a consensus of the ISMRM perfusion study group and the European consortium for ASL in dementia. Magnetic resonance in medicine. 2015;73(1):102–116.
7. Wang DJ, Alger JR, Qiao JX, et al. Multi-delay multi-parametric arterial spin-labeled perfusion MRI in acute ischemic stroke—comparison with dynamic susceptibility contrast enhanced perfusion imaging. NeuroImage: Clinical. 2013;3:1–7.
8. Hu HH, Rusin JA, Peng R, et al. Multi-phase 3D arterial spin labeling brain MRI in assessing cerebral blood perfusion and arterial transit times in children at 3T. Clinical Imaging. 2019;53:210–220.
9. Yushkevich PA, Piven J, Hazlett HC, et al. User-guided 3D active contour segmentation of anatomical structures: significantly improved efficiency and reliability. Neuroimage. 2006;31(3):1116–1128.
10. Haller S, Zaharchuk G, Thomas DL, Lovblad K-O, Barkhof F, Golay X. Arterial spin labeling perfusion of the brain: emerging clinical applications. Radiology. 2016;281(2):337–356.
Figures