2733
A quantitative multiparametric 18F-FPIA PET/MRI study for the characterization of primary brain gliomas1Surgery and Cancer, Imperial College London, London, United Kingdom, 2Imaging, Imperial College London Healthcare NHS Trust, London, United Kingdom, 3Imperial College London Healthcare NHS Trust, London, United Kingdom, 4Invicro Imperial College London, London, United Kingdom, 5Hull York Medical School, Faculty of Health Sciences, University of Hull, Hull, United Kingdom, 6Computational Oncology Group, Department of Surgery and Cancer, Imperial College London, London, United Kingdom, 7Institute for Global Health Innovation, Imperial College London, London, United Kingdom, 8Centre for Clinical Brain Sciences, University of Edinburgh, Edinburgh, United Kingdom
Synopsis
18F-FPIA PET/MRI integrates two imaging modalities that can provide valuable insight into the characterization and classification of brain tumours.
10 patients with primary brain gliomas were recruited to this study. Static and dynamic 18F-FPIA PET, together with perfusion/diffusion MRI data were post-processed for the extraction of 3D parametric maps for each subject. Correlations among parameters were evaluated with Spearman test. Tumour grade prediction was assessed with a machine learning model.
A strong correlation was found between uptake and influx rate constant of FPIA and MRI perfusion parameters. The PET/MRI methodology provided 100% accuracy in differentiating low from high grade tumours.
INTRODUCTION
Gliomas are the most common primary brain tumours and there is a wide interest in imaging techniques that stratify tumour behaviour. 18F-fluoropivalate (18F-FPIA) PET/MRI is performed to study fatty acids as an essential source of nutrient for cell growth and proliferation in brain gliomas1. The higher uptake of short chain fatty acids including acetate in high-grade compared to lower grade gliomas is thought to be driven by the higher propensity of high-grade tumours to generate adenosine triphosphate (ATP) and nicotinamide-adenine dinucleotide phosphate (NADPH) via fatty acid oxidation under bioenergetic stress2. The MRI acquisition included dynamic contrast enhanced (DCE), dynamic susceptibility contrast (DSC), arterial spin labelling (ASL) and diffusion weighted imaging (DWI) sequences for the evaluation of gadolinium-based contrast agent permeability and perfusion and water molecules diffusion in low and high-grade gliomas.In this study, we compared the results of the quantification of MRI and static and dynamic 18F-FPIA PET data of 10 patients with primary untreated glioma scanned with a hybrid PET/MRI scanner.
METHODS
10 patients(4 low (WHO grade II) 6 high-grade (WHO grade III, IV) gliomas; age 31 to 79, mean(+/- SD) 59 ± 15.9)were recruited to this study. 18F-FPIA PET/MR images were acquired on a Signa PET/MR scanner(GE Healthcare).DCE-MRI analysis combined five different pharmacokinetic models as described by Inglese et al.3 and resulted in the extraction of Ktrans (contrast agent plasma/interstitium transfer rate constant), kep (intravasation rate constant), ve (extravascular and extracellular volume fraction), vp (plasma volume fraction) and τi (mean capillary water lifetime). From DSC-MRI data, rCBF (cerebral blood flow), rCBVlc (cerebral blood volume corrected for leakage), rCBV (cerebral blood volume), rMTT (mean transit time) and rTTP (time to peak) were extracted4, 5. Finally, CBF and apparent diffusion coefficient (ADC) maps were evaluated from ASL and DWI-MRI, respectively6-8.
Static PET data were quantified with the standardised uptake value (SUV)9 evaluated between 60-70 min, the SUV corrected by tracer uptake in whole blood (SUVc) and the tumour-to-background ratio (TBR)10. Dynamic PET data were quantified with a double input spectral analysis, a standard and modified Patlak11-13and a modified 2-tissue 5k compartmental model based on the formulation by Shmidt et al.14. The presence of a radiolabelled metabolite (carnitine) was considered.
Correlations among parameters were evaluated with Spearman test. Tumour grade prediction was assessed for every single MRI parameter extracted and with a 5-fold cross validated least-absolute and shrinkage linear operator (LASSO) on 25 parameters extracted from the multiparametric analysis of PET and MRI data15.
RESULTS
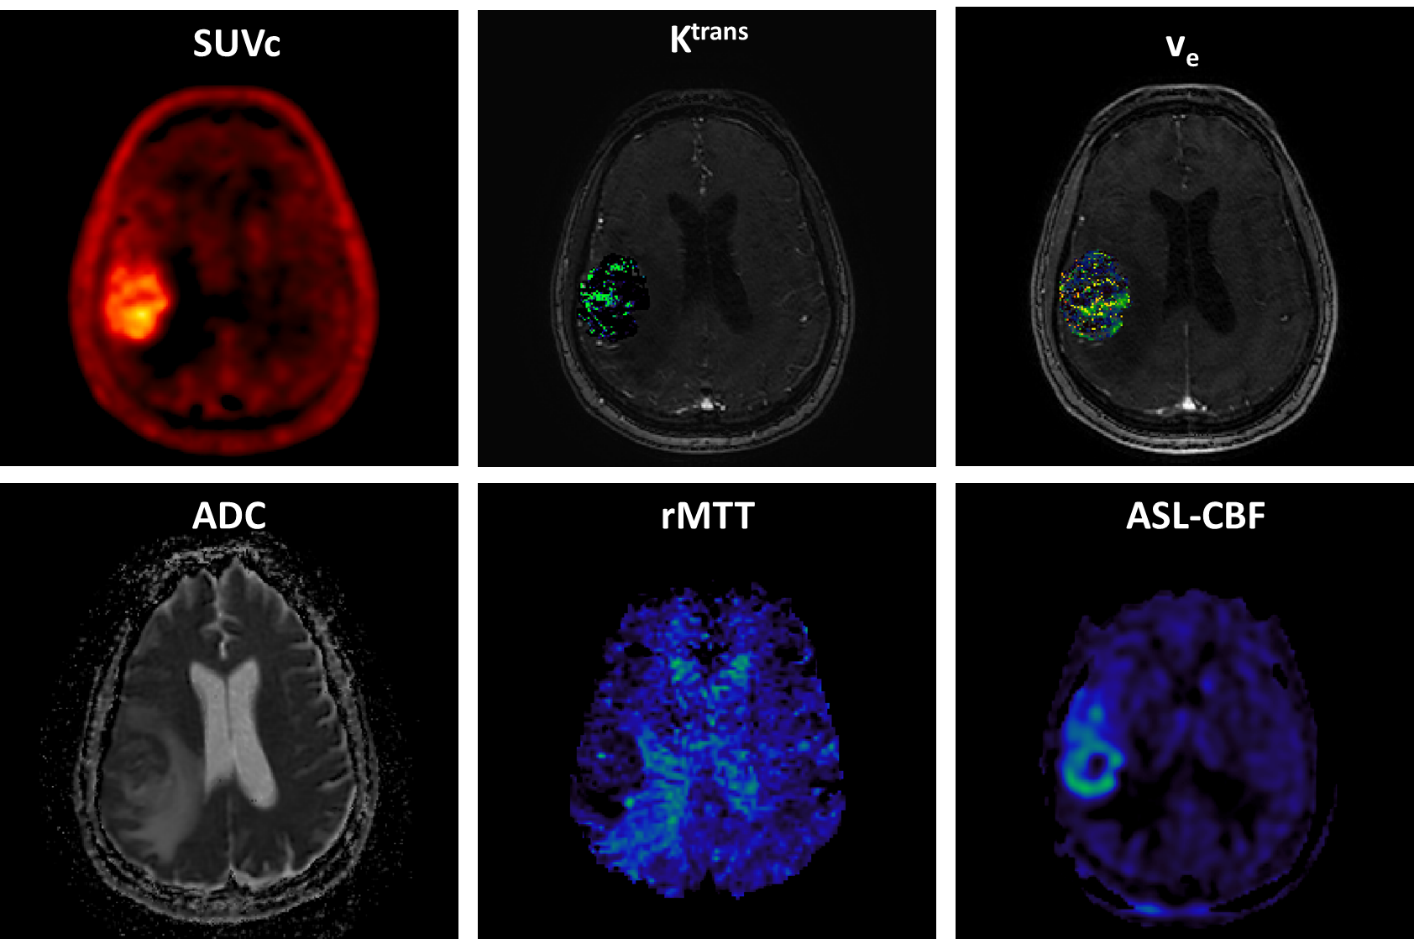
Figure 1 shows an example of the parametric maps used in this study derived from the analysis of 18F-FPIA PET and MRI data.The non-parametric Spearman correlation test inferred strong correlations between the SUV and K1 (ρ=0.92) and between the Ki and the rCBF and rCBV (ρ=0.88). Table 1 shows the corrected non-redundant statistically significant comparisons.
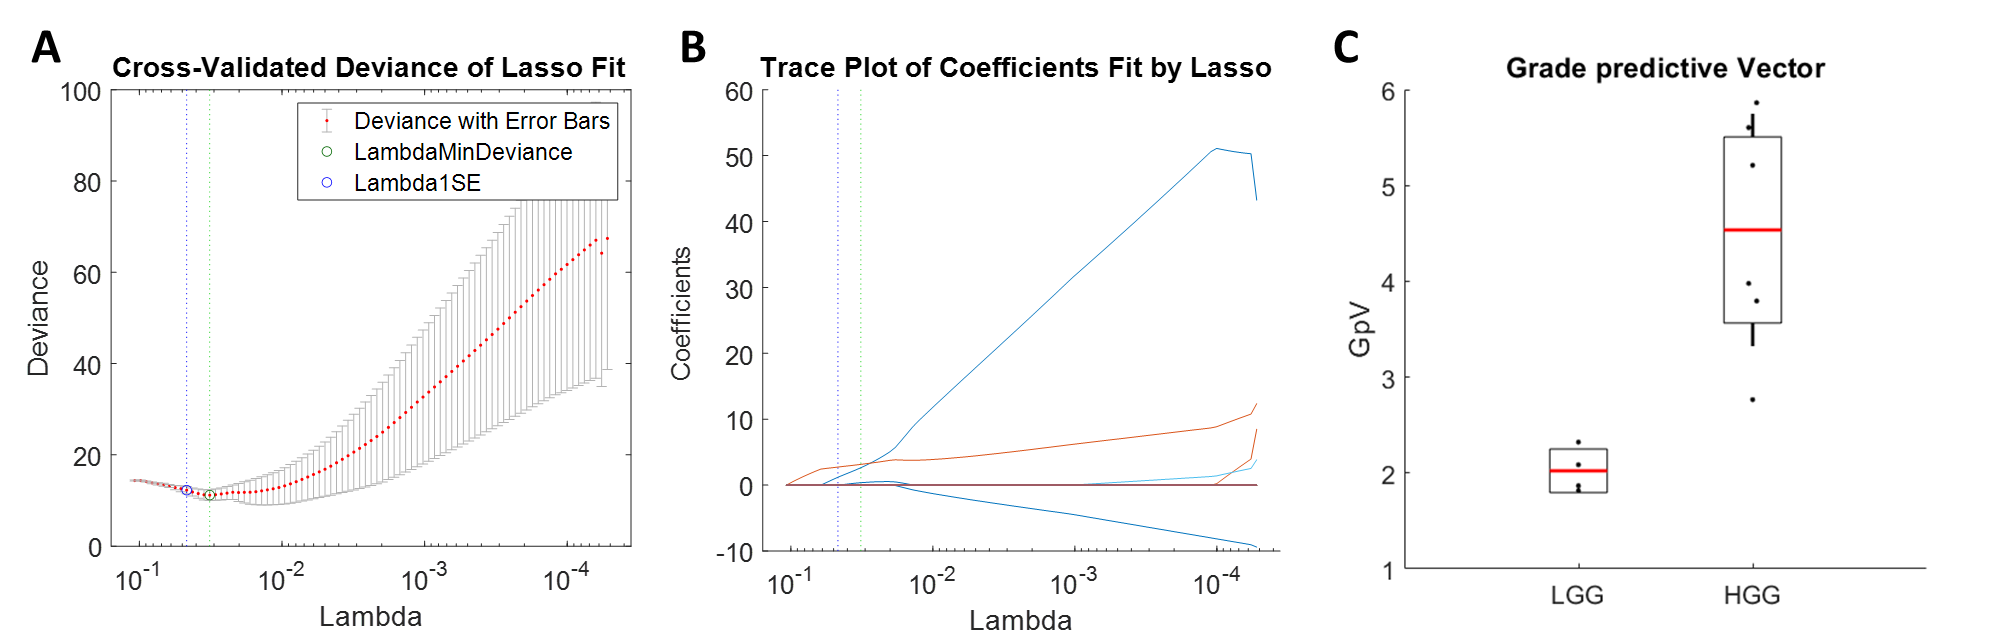
The diagnostic accuracy for tumour grade prediction of single MRI and combined MRI+PET features was evaluated (Table 2). The best performance was obtained by the grade predictive vector GpV which combines PET and MRI parameters. The GpV is the result of the weighted sum of 3 optimal features extracted by the LASSO (Figure 2): SUV, DCE ve and DSC rMTT with a weight of 2.65, 5.15 and 0.37, respectively.
DISCUSSION
The primary purpose of this study was to evaluate the association between perfusion/diffusion MRI and metabolic 18F-FPIA PET parameters and to assess a machine learning-based algorithm for tumour grade prediction.The irreversible uptake rate constant of 18F-FPIA in the tissue was strongly correlated with MRI perfusion parameters (rCBF and rCBV). By definition, Ki is partially dependent on perfusion16 and this dependence was confirmed here by a different imaging modality.
Normal cellular homeostasis is dominated by the energy sources resulting from the metabolism of both glucose and fatty acids2. Different tissues in the body exhibit different degrees of metabolic plasticity involving reciprocal regulation of glucose and fatty acid metabolism17. In this study, the uptake of 18F-FPIA, represented by SUV, showed a strong correlation with K1 (delivery rate constant) suggesting that FPIA uptake is a reflection of FPIA delivery in the tumour (i.e. higher in high compared to low grade gliomas).
The performance of MRI and MRI+PET derived parameters in differentiating low from high grade gliomas is summarised in Table 2. DCE and DSC parameters showed 76% and 80% accuracy (average), when considered alone. The combination of these two MRI techniques increased classification performance (90% accuracy) as already published by Aydin et al.18. With the additional contribution of 18F-FPIA PET SUV, together with DSC rMTT and DCE ve the model reached 100% accuracy in tumour grade prediction.
This study is limited by the small dataset and, in particular, by the absence of WHO grade III lesions, which are clinically the most challenging. A larger cohort would also overcome over-fitting problems related to the high dimensionality of features extracted in a small patient dataset.
CONCLUSIONS
18F-FPIA PET/MRI integrates two imaging modalities that can provide valuable insight into the characterization of brain tumours. The co-modelling of PET/MRI data resulted with strong correlations between functional and permeability parameters. Future studies are needed to asses the impact of these parameters on the prediction of treatment response and survival.Acknowledgements
The study was funded by MRC MR/N020782/1 grant. We also acknowledge support from Imperial NIHR Biomedical Research Centre and Imperial Experimental Cancer Medicine’s Centre awards.References
1. Dubash, S.R., et al., Clinical translation of 18F-fluoropivalate – a PET tracer for imaging short-chain fatty acid metabolism: safety, biodistribution, and dosimetry in fed and fasted healthy volunteers. European Journal of Nuclear Medicine and Molecular Imaging, 2020.
2. Mashimo, T., et al., Acetate is a bioenergetic substrate for human glioblastoma and brain metastases. Cell, 2014. 159(7): p. 1603-1614.
3. Inglese, M., et al., Reliability of dynamic contrast-enhanced magnetic resonance imaging data in primary brain tumours: a comparison of Tofts and shutter speed models. Neuroradiology, 2019. 61(12): p. 1375-1386.
4. Essig, M., et al., Perfusion MRI: the five most frequently asked technical questions. American Journal of Roentgenology, 2013. 200(1): p. 24-34.
5. Østergaard, L., Principles of cerebral perfusion imaging by bolus tracking. Journal of Magnetic Resonance Imaging, 2005. 22(6): p. 710-717.
6. Maas, L.C. and P. Mukherjee, Diffusion MRI: Overview and clinical applications in neuroradiology. Applied radiology, 2005. 34(11): p. 44.
7. Buxton, R.B., et al., A general kinetic model for quantitative perfusion imaging with arterial spin labeling. Magnetic resonance in medicine, 1998. 40(3): p. 383-396.
8. Chalela, J.A., et al., Magnetic resonance perfusion imaging in acute ischemic stroke using continuous arterial spin labeling. Stroke, 2000. 31(3): p. 680-687.
9. Kinahan, P.E. and J.W. Fletcher, Positron emission tomography-computed tomography standardized uptake values in clinical practice and assessing response to therapy. Semin Ultrasound CT MR, 2010. 31(6): p. 496-505.
10. Grech-Sollars, M., et al., Imaging and Tissue Biomarkers of Choline Metabolism in Diffuse Adult Glioma: 18F-Fluoromethylcholine PET/CT, Magnetic Resonance Spectroscopy, and Choline Kinase α. Cancers, 2019. 11(12): p. 1969.
11. Patlak, C.S., R.G. Blasberg, and J.D. Fenstermacher, Graphical evaluation of blood-to-brain transfer constants from multiple-time uptake data. Journal of Cerebral Blood Flow & Metabolism, 1983. 3(1): p. 1-7.
12. Patlak, C.S. and R.G. Blasberg, Graphical evaluation of blood-to-brain transfer constants from multiple-time uptake data. Generalizations. Journal of Cerebral Blood Flow & Metabolism, 1985. 5(4): p. 584-590.
13. Mankoff, D.A., et al., A Graphical Analysis Method to Estimate Blood-to-Tissue Transfer Constants for. J Nucl Med, 1996. 37: p. 2049-2057.
14. Schmidt, K.C. and F.E. Turkheimer, Kinetic modeling in positron emission tomography. Q J Nucl Med, 2002. 46(1): p. 70-85.
15. Lu, H., et al., A mathematical-descriptor of tumor-mesoscopic-structure from computed-tomography images annotates prognostic-and molecular-phenotypes of epithelial ovarian cancer. Nature communications, 2019. 10(1): p. 1-11.
16. Bertoldo, A., G. Rizzo, and M. Veronese, Deriving physiological information from PET images: from SUV to compartmental modelling. Clinical and Translational Imaging, 2014. 2(3): p. 239-251.
17. Smith, R.L., et al., Metabolic Flexibility as an Adaptation to Energy Resources and Requirements in Health and Disease. Endocrine Reviews, 2018. 39(4): p. 489-517.
18. Aydin, S., et al., Perfusion and permeability MRI in glioma grading. Egyptian Journal of Radiology and Nuclear Medicine, 2020. 51(1): p. 2.
Figures