2729
Saturated Look-Locker FAIR (SALL-FAIR) Sequence with FPOCK Model for Simultaneous Acquisition of CBF, aBAT, tBAT, and T1 Map1Center for Biomedical Imaging Research, Department of Biomedical Engineering, School of Medicine Tsinghua University, Beijing, China
Synopsis
A SAturated Look-Locker Flow-sensitive Alternating Inversion Recovery (SALL-FAIR) sequence combined with the Four-Phase One-Compartment Kety (FPOCK) kinetic model was proposed for simultaneous acquisition of CBF, aBAT, tBAT and T1 map with a single scan. The T1 maps of SALL-FAIR were verified by standard IR-SE on phantom, and higher accuracy of perfusion quantification from SALL-FAIR with FPOCK model was proved by comparing with the Buxton’s and the single-TI model in vivo.
Introduction
Accurate quantification of tissue blood flow with arterial spin labeling (ASL) is influenced by many factors, such as arterial bolus arrival time (aBAT), tissue BAT (tBAT) and tissue T1 [1-3]. Better characterization of these factors would not only help detect potential artifacts of tissue blood flow image, but also provide additional hemodynamic and structural information for more comprehensive diagnosis. However, acquiring above information usually needs repeated scans for multi-TI/multi-PLD ASL or T1 mapping, which prolongs scan time and reduces clinical practicality. In this study, we proposed a SAturated Look-Locker Flow-sensitive Alternating Inversion Recovery (SALL-FAIR) sequence combined with the Four-Phase One-Compartment Kety (FPOCK) kinetic model [3] to achieve simultaneous acquisition of CBF, aBAT, tBAT and T1 map with a single scan. The quantitative results of SALL-FAIR with FPOCK model were compared with single-TI FAIR and SALL-FAIR with Buxton’s model [1] in vivo, and the T1 map of SALL-FAIR was compared with standard inversion-recovery spin-echo (IR-SE) on phantom.Methods
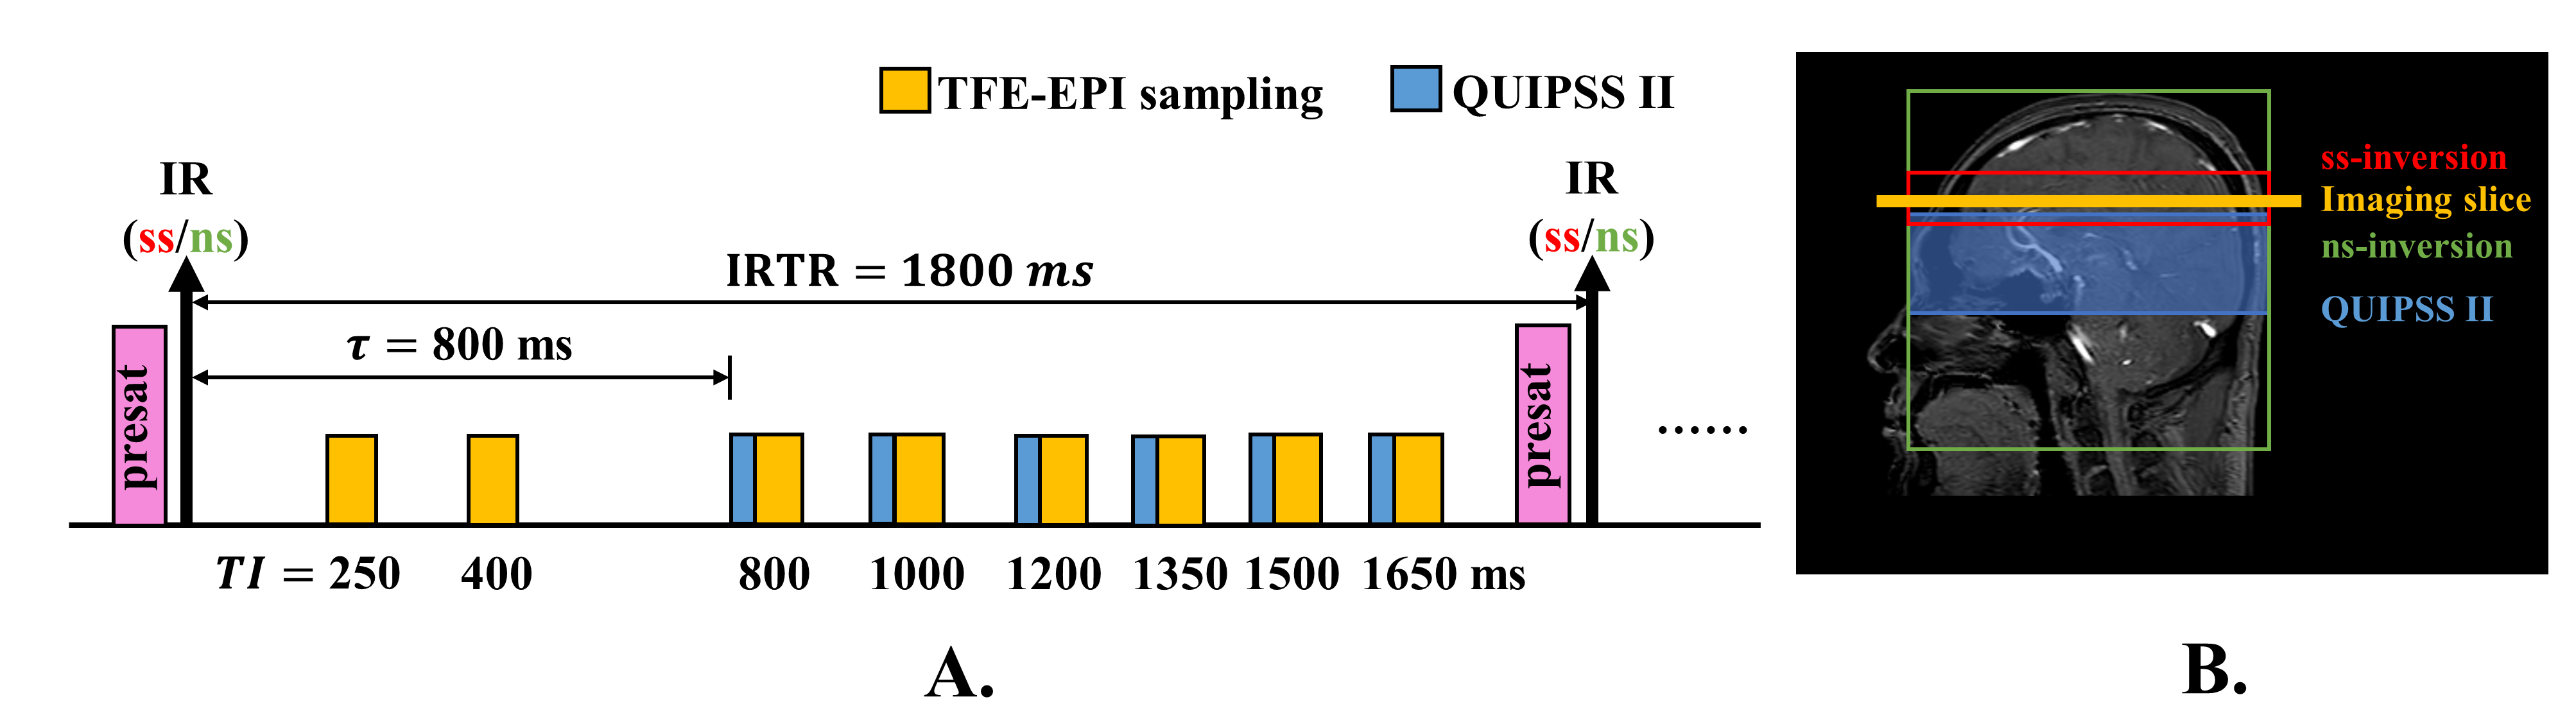
SALL-FAIR Pulse Sequence: The SALL-FAIR pulse sequence consists of a pre-saturation pulse followed by a nonselective (ns) or slice-selective (ss) inversion pulse and asymmetrical Look-Locker TFE-EPI readout (Figure 1A). Pre-saturation was implemented on the imaging slice to guarantee the tissue signal recovering from zero at the beginning of each IRTR (IRTR=1800 ms), thus removing the dependence of the signal on IRTR. TIs of the Look-Locker TFE-EPI sampling series were set asymmetrically as 250, 400, 800, 1000, 1200, 1350, 1500, 1650 ms. QUIPSS II pulses were performed immediately before the third and following sampling series, which lead to a bolus duration $$$\tau=800 ms$$$. Illustration of the spatial positions of RF pulses is shown in Figure 1B.MR Experiments: All experiments were performed on a 3T MR scanner (Ingenia, Philips Healthcare, Best, The Netherlands) equipped with a 32-channel head coil. For the in-vivo study, five healthy subjects were scanned (26.4±1.2yr, 2 males). The imaging parameters of SALL-FAIR were as follows: single-shot TFE-EPI readout, TFE factor, 13; EPI factor, 9; flip angle, 10°; TE/TR, 4.2/9.2 ms; FOV, 256×256mm2; resolution, 3×3 mm2; slice thickness, 6 mm (scan time 3’40’’ for 60 averages). In addition, an M0 image was acquired. For the phantom study, the FOV of SALL-FAIR was 135×71 mm2, spatial resolution was 1.6×1.6 mm2 and slice thickness was 5 mm, and the other imaging parameters kept the same as the in-vivo study. IR-SE were performed with fourteen TIs (100/200/300/400/500/600/700/800/900/1000/1500/2000/2500/3000 ms) and the other imaging parameters were as follows: TE/TR, 9.3/10000 ms; FOV, 135×71 mm2; resolution, 1.6×1.6 mm2; slice thickness, 5 mm.
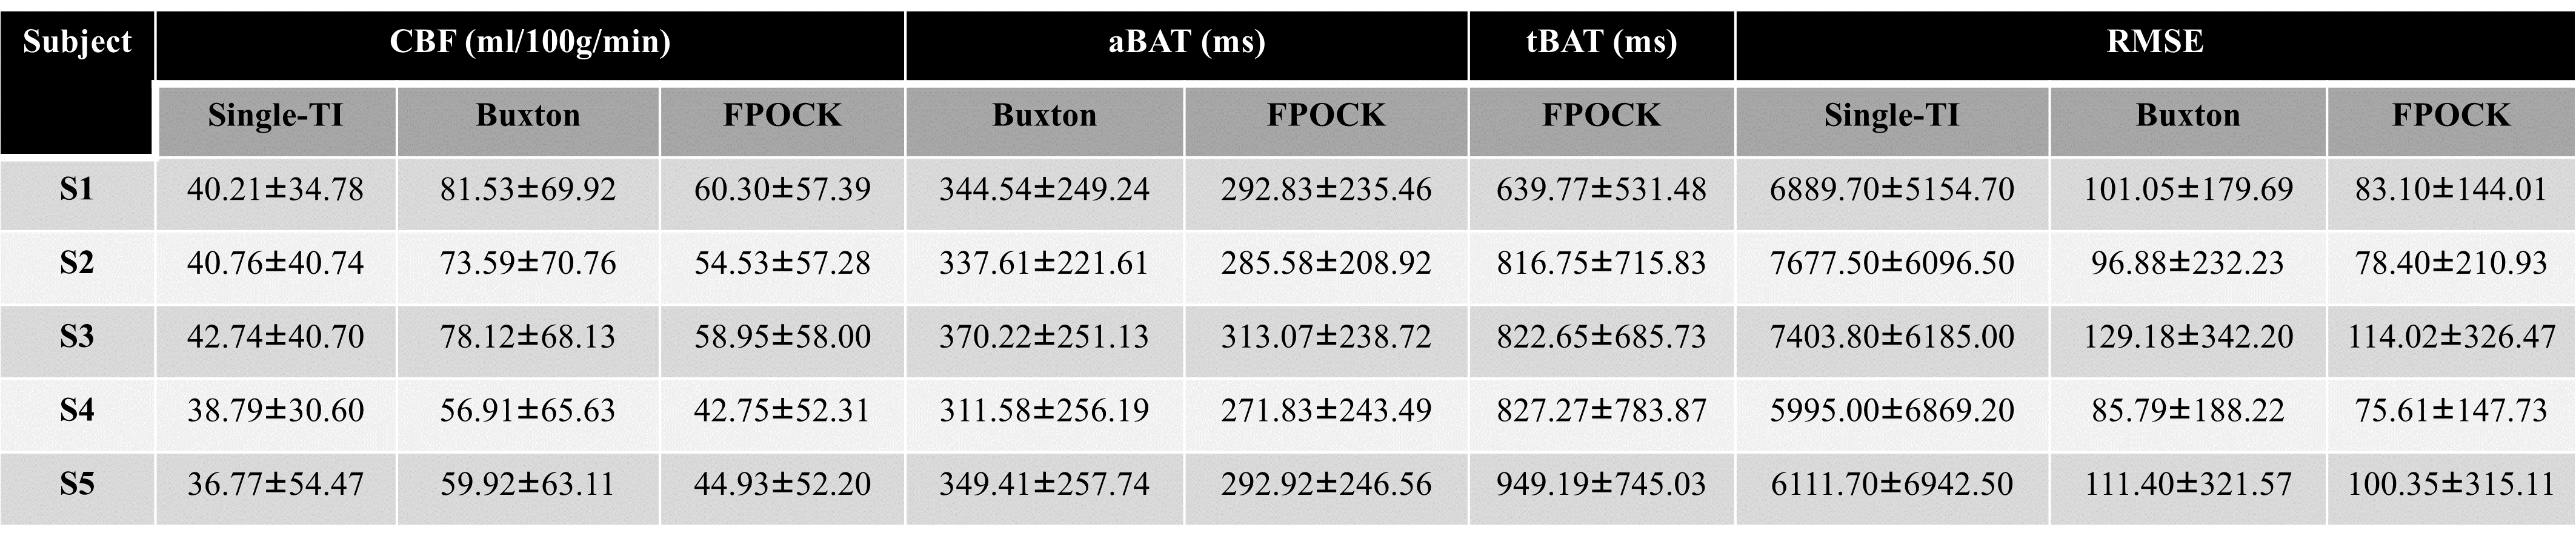
Image Analysis: All analyses were performed by MATLAB (MathWorks, Natick, MA). T1 maps of SALL-FAIR were estimated using improved saturation recovery equation [Eq.1] [4] voxel-by-voxel, while T1 maps of IR-SE were estimated using inversion recovery equation [Eq.2]. The quantification of ASL measurements was conducted in three methods: 1) CBF, aBAT, tBAT maps were estimated using FPOCK kinetic model [3] with 8-TI label/controls from SALL-FAIR; 2) CBF, aBAT map were estimated using single-compartment model from Buxton [1] with 8-TI label/controls from SALL-FAIR; 3) CBF map was estimated using the recommended single-TI model in the ASL consensus paper [5] with the 5th-TI (TI=1200ms) label/controls from SALL-FAIR. The Root Mean Squared Error (RMSE) of the three methods was calculated to evaluate the accuracy of the three models.
$$M(t)=A(1-\eta_{apparent}e^{-t/T_1}) [Eq.1]$$
$$M(t)=M_0(1-2e^{-t/T_1}) [Eq.2]$$
Results
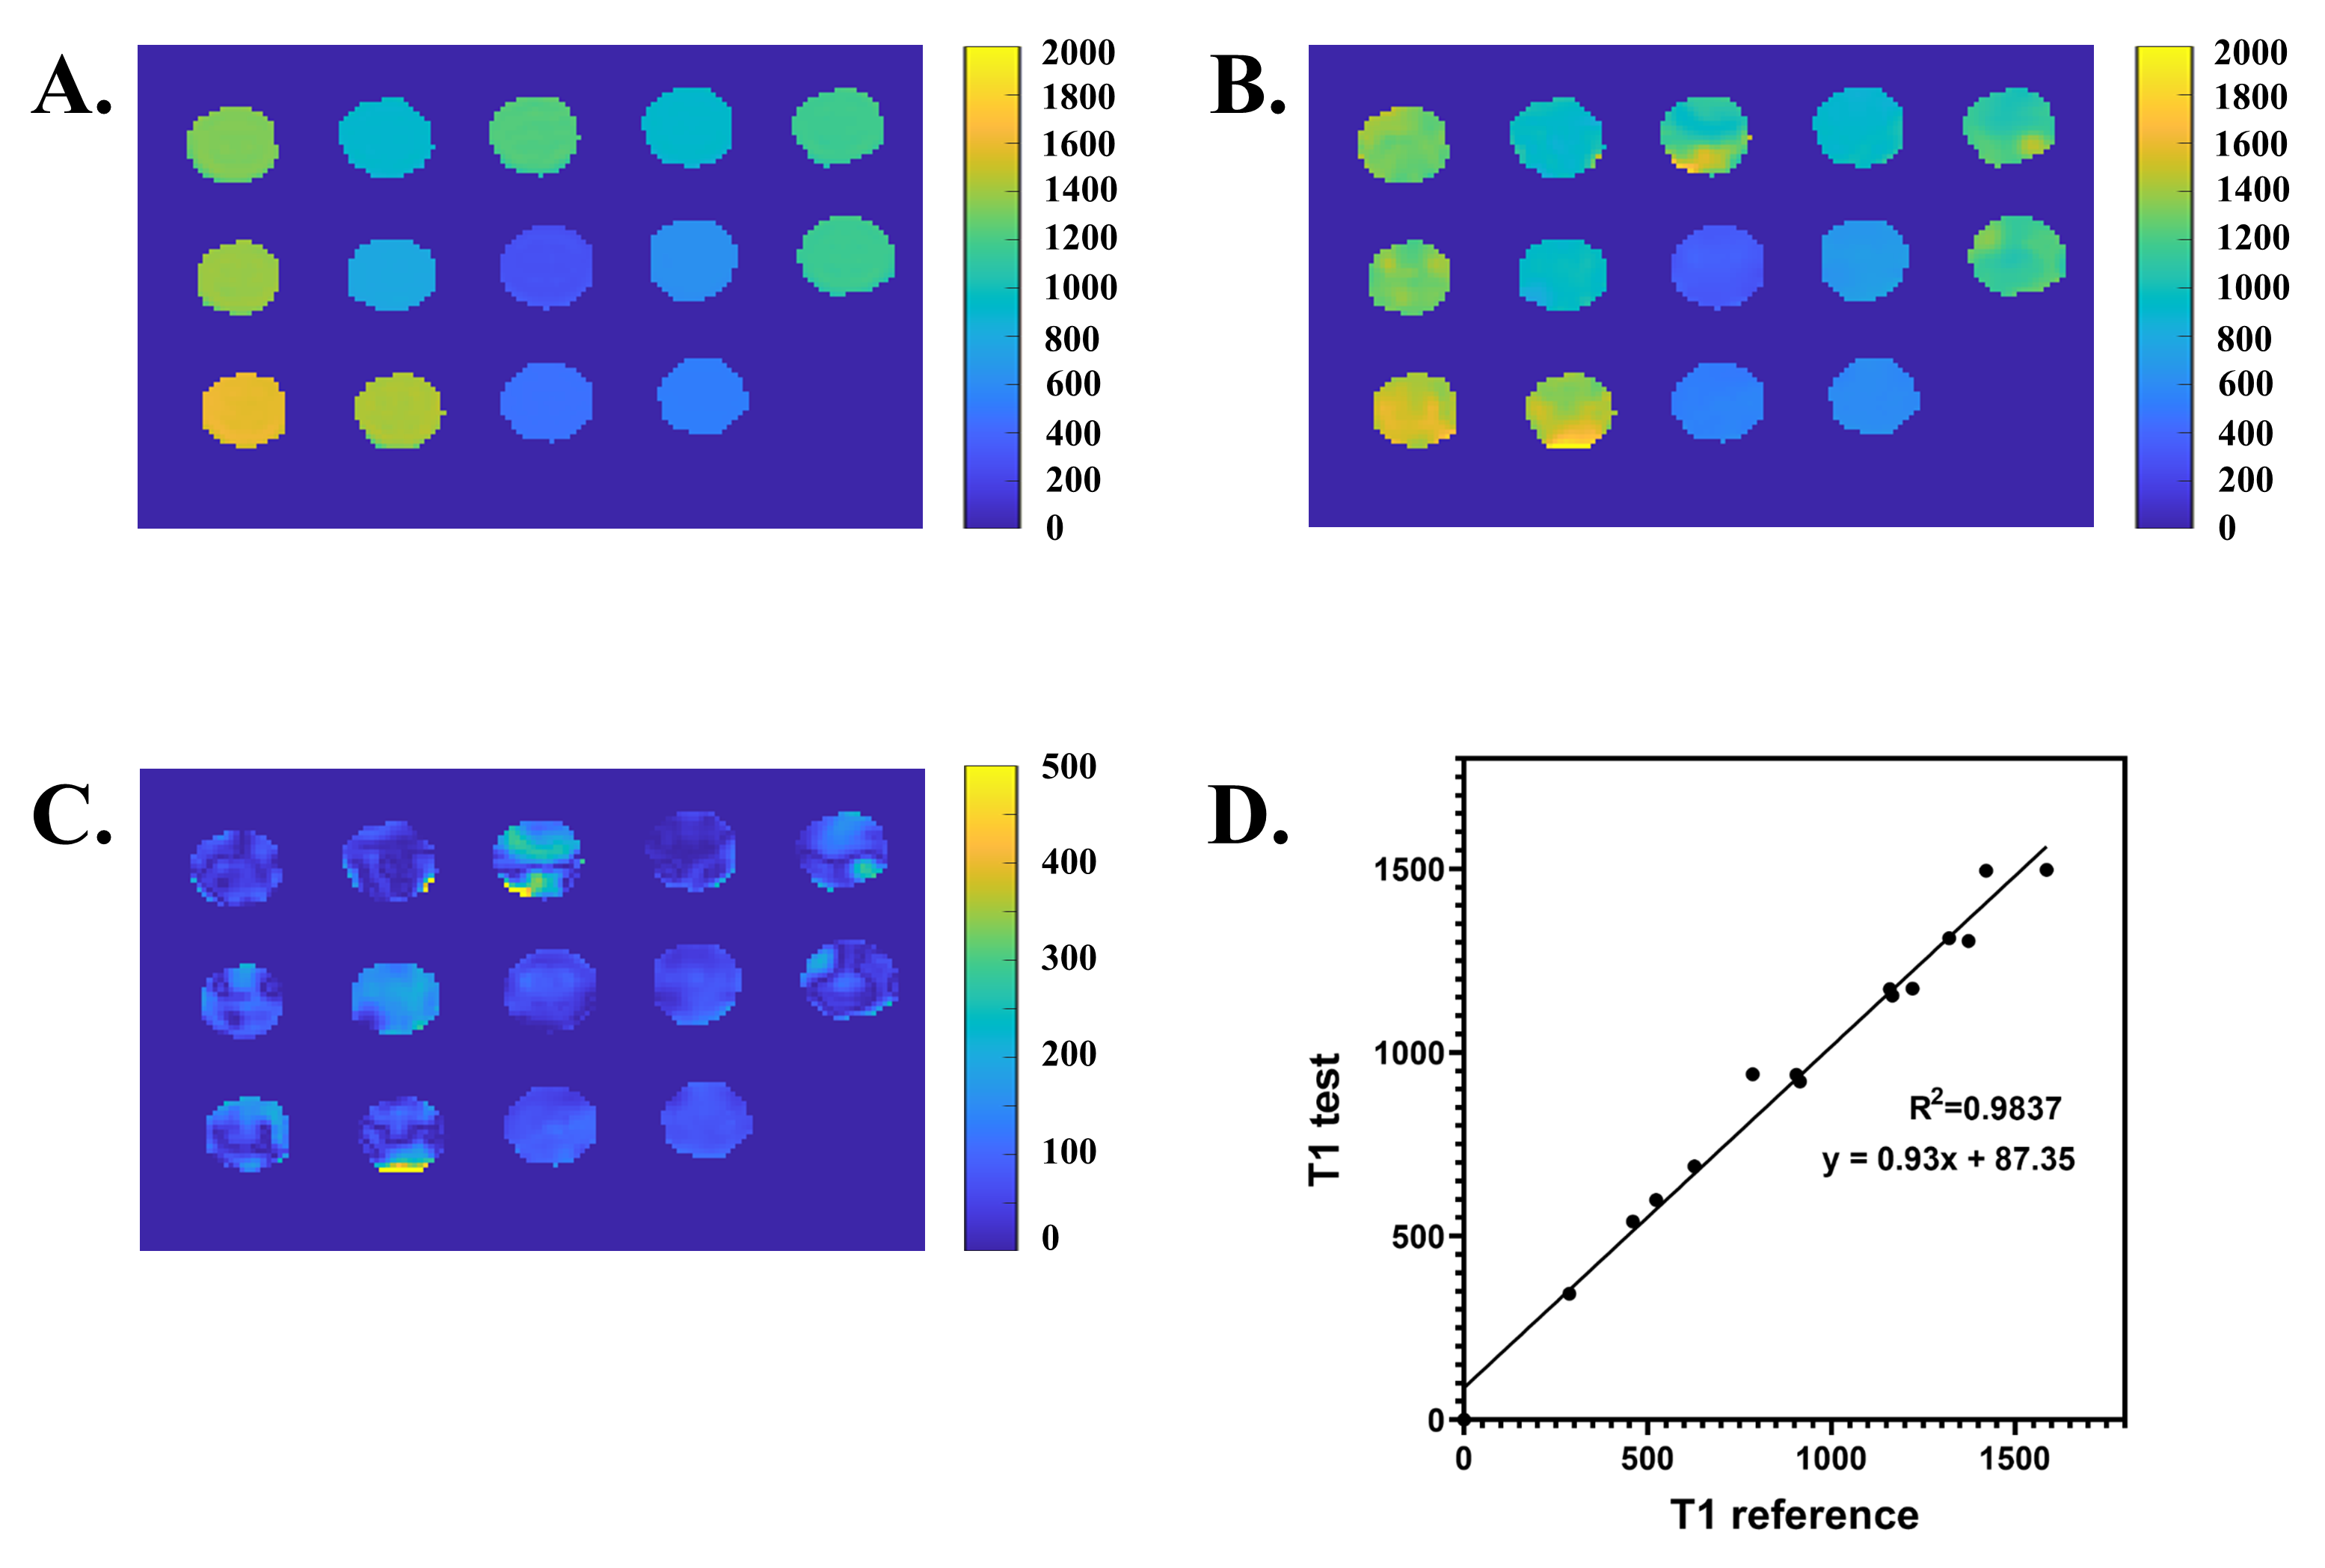
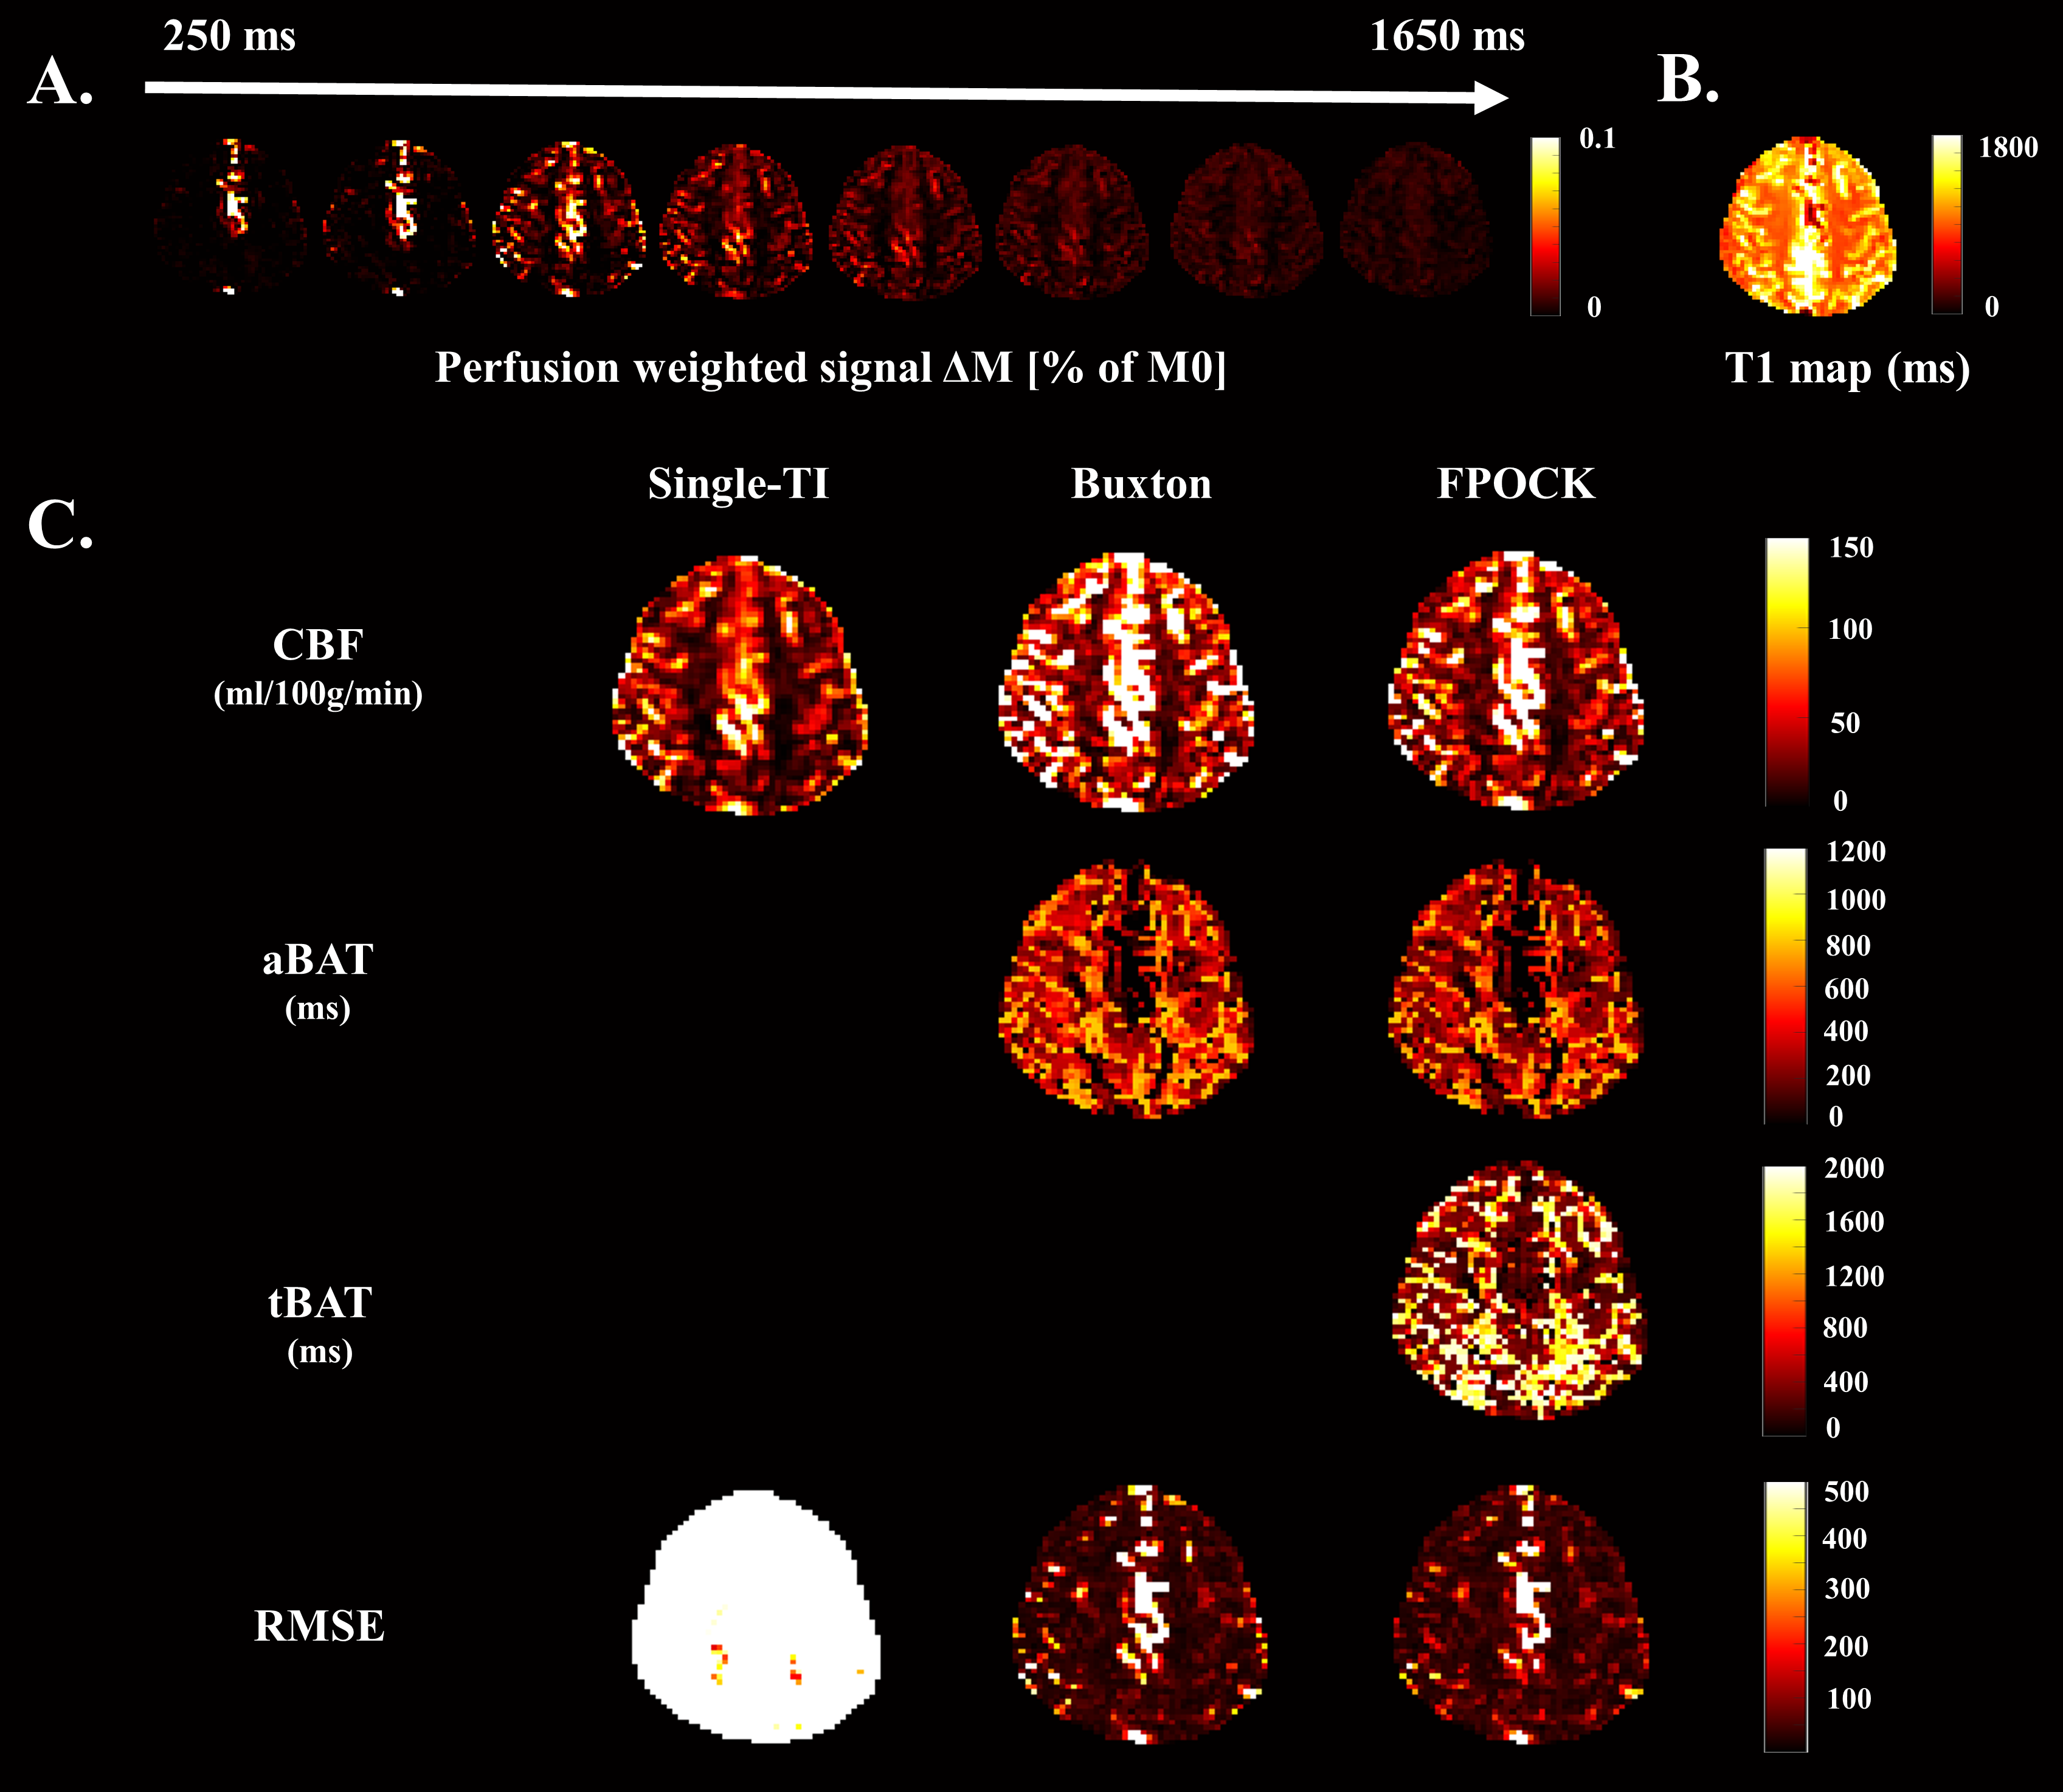
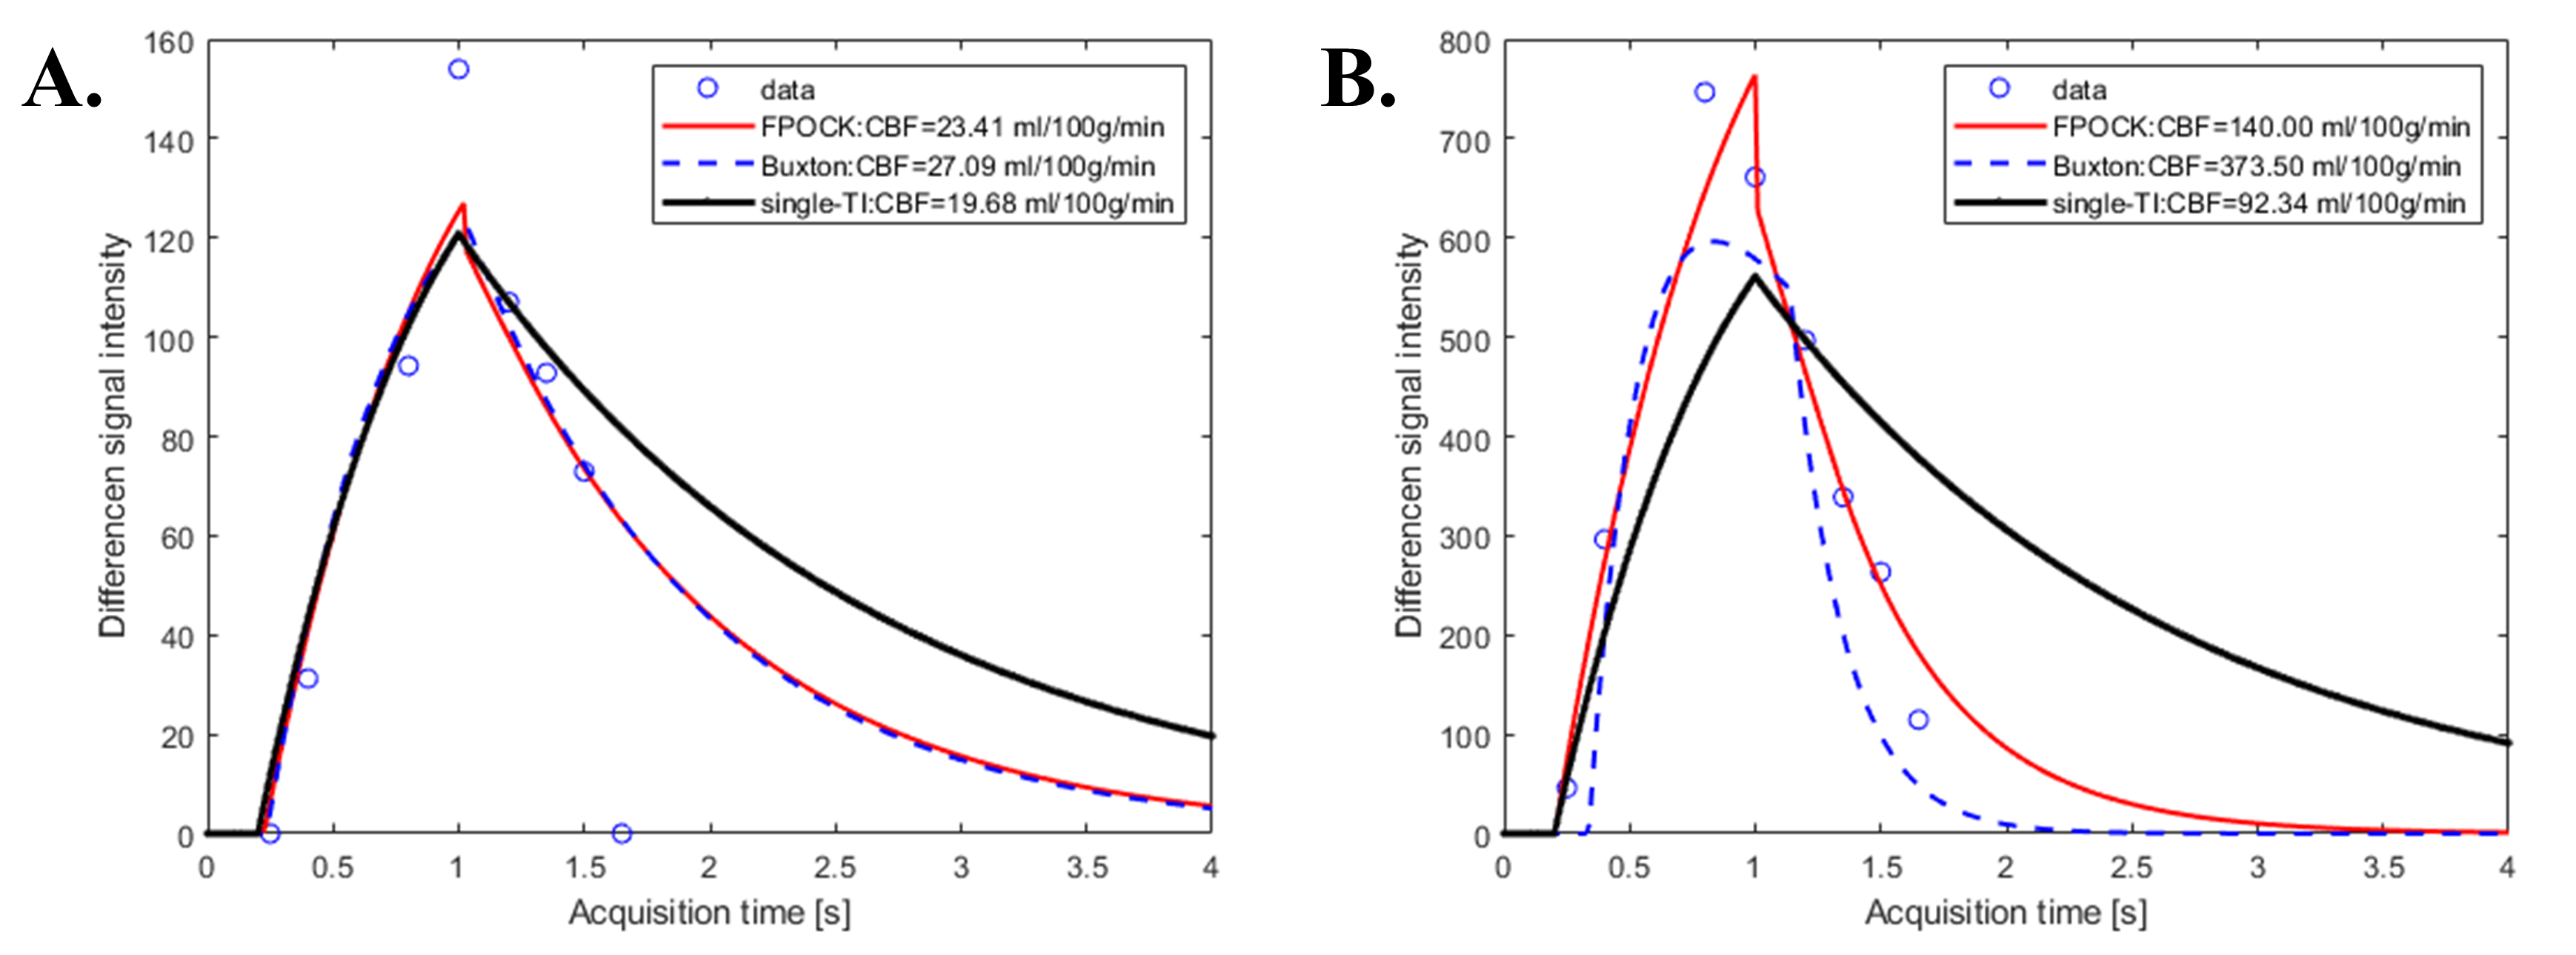
The proposed SALL-FAIR with FPOCK kinetic model was able to provide accurate CBF, aBAT, tBAT and T1 map with a single scan. SALL-FAIR provided T1 map (Figure 2B) with small difference (Figure 2C) and excellent correlation (R2=0.9837, Figure 2D) compared with the T1 map of IR-SE (Figure 2A) in the phantom study. Compared with the Buxton’s model [1] and the single-TI model [5], FPOCK kinetic model could evaluate aBAT, tBAT as well as CBF with lower RMSE (Figure 3,4), which indicated higher accuracy.Discussion and Conclusion
This study proposed a new ASL technique SALL-FAIR with FPOCK kinetic model to access CBF, aBAT, tBAT and T1 map simultaneously. The T1 mapping results of SALL-FAIR were verified by standard IR-SE on phantom, and more accurate quantitative perfusion results of SALL-FAIR with FPOCK model were proved by comparing with the Buxton’s [1] and the single-TI [5] model in vivo. Reasonable quantitative perfusion results were able to be obtained in low perfusion region by all three models (Figure 5A). However, for high perfusion region such as arterial space within the imaging slice, the Buxton’s model tended to overestimate CBF due to regarding the imaging area as one component and not considering rapid blood flow-in and -out in arteries, whereas the single-TI model could underestimate CBF due to missing the time phase when blood was still in the arteries (Figure 5B). Ongoing work will focus on enrolling more subjects to further verify the results and applying this technique on other organs such as kidney.Acknowledgements
None.References
[1] Buxton RB, Frank LR, Wong EC, Siewert B, Warach S, Edelman RR. A general kinetic model for quantitative perfusion imaging with arterial spin labeling. Magn Reson Med. 1998;40(3):383-96.
[2] Alsop DC, Detre JA. Reduced transit-time sensitivity in noninvasive magnetic resonance imaging of human cerebral blood flow. J Cereb Blood Flow Metab. 1996;16(6):1236-49.
[3] Li KL, Zhu X, Hylton N, et al. Four-phase single-capillary stepwise model for kinetics in arterial spin labeling MRI. Magn Reson Med. 2005;53(3):511-8.
[4] Chow K, Flewitt JA, Green JD, Pagano JJ, Friedrich MG, Thompson RB. Saturation recovery single-shot acquisition (SASHA) for myocardial T(1) mapping. Magn Reson Med. 2014;71(6):2082-9
[5] Alsop DC, Detre JA, Golay X, et al. Recommended implementation of arterial spin-labeled perfusion MRI for clinical applications: A consensus of the ISMRM perfusion study group and the European consortium for ASL in dementia. Magn Reson Med. 2015;73(1):102-16.
Figures