2728
Optimization and Evaluation of Super-Resolution SMS ASL with Slice-Dithered Enhanced Resolution (SLIDER) technique1Laboratory of Functional MRI Technology (LOFT), Stevens Neuroimaging and Informatics Institute, University of Southern California, Los Angeles, CA, United States
Synopsis
The goal of this study is to optimize and evaluate super-resolution simultaneous multislice (SMS) Arterial Spin Labeling (ASL) using the Slice Dithered Enhanced Resolution (SLIDER). Different numbers (2/3/4) of shifted slices for SLIDER SMS ASL were evaluated for spatial and temporal SNR. The results showed that the SNR efficiency of SLIDER SMS ASL increased with a greater number of shifted slices which may be attributed to reduced g-factor for SMS imaging of thicker slices as well as the presence of physiological noise.
Introduction
Super-resolution reconstruction with Slice Dithered Enhanced Resolution (SLIDER) technique and simultaneous multislice (SMS) acquisition has been successfully applied to diffusion MRI and BOLD fMRI1,2. A proof-of-concept for super-resolution (isotropic-2mm) ASL using SLIDER SMS has been demonstrated using two sets of shifted low-resolution thick (4mm) slices, yielding improved SNR compared to the traditional high-resolution acquisition5. The purpose of this study was to optimize and evaluate the performance of SLIDER SMS ASL with different numbers (2/3/4) of shifted slices in terms of spatial and temporal SNR as well as slice blurring.Methods
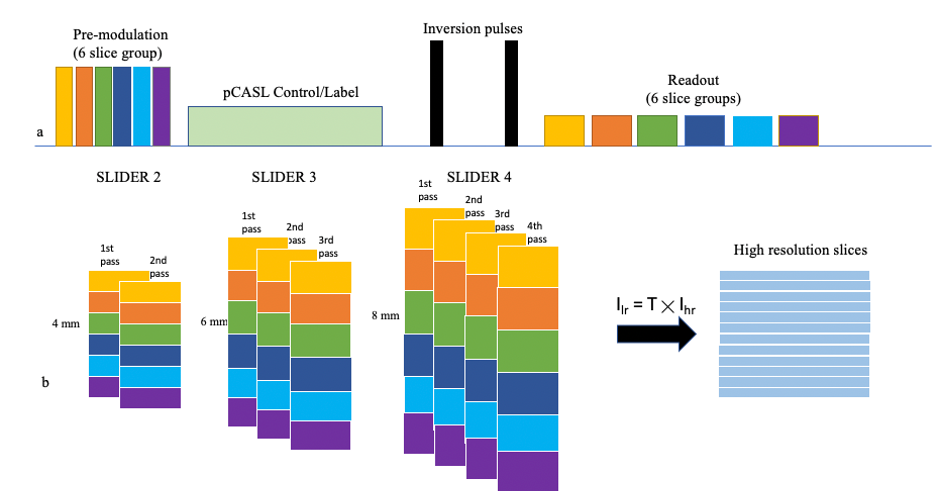
1. Diagram of SLIDER-SMS pCASLFigure 1 shows the diagram for the proposed SLIDER-SMS pCASL with the constrained slice dependent background suppression scheme3. In this study, six SMS slice groups with a multiband factor of four were employed to achieve whole-brain coverage. SLIDER technique acquires N sets of 2D thick slices with sub-voxel spatial shifts in the slice direction and recovers the high-resolution images with thin slices by applying a deblurring algorithm. Three options for SLIDER reconstruction are shown in Figure 1b, as named by SLIDER2, SLIDER3 and SLIDER4 for 2, 3 and 4 sets of shifted slices respectively. The standard high-resolution SMS pCASL images were acquired in two scans or slice groups to match the image acquisition time of super-resolution scans and also to minimize cross-talk between thin slices.
2. In-vivo experiments
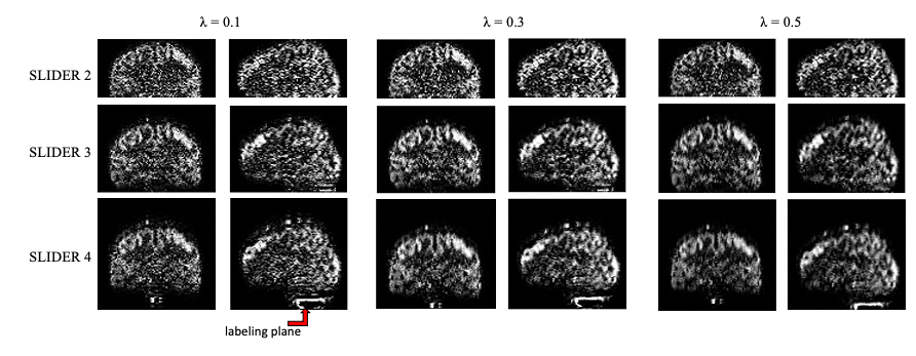
Five healthy subjects (age = 24.6±1.7, 4 males) were scanned on a Siemens 3 Tesla Prisma scanner using a 32-channel head coil. The imaging parameters for the SLIDER-SMS pCASL sequence were: in-plane resolution of 2×2 mm2, FOV = 192 mm, matrix size = 96×96, TR = 5000 ms, TE = 20 ms, 24 total slices acquired for each TR. The labeling duration for pCASL was 1500 ms and the PLD was 1800 ms. The slice thickness for SLIDER2, SLIDER3 and SLIDER4 was 4mm, 6mm and 8mm with an inter-slice gap of 20mm, 30mm and 40mm between simultaneously excited slices respectively. For fair comparison of SNR efficiency, we reduced the measurements for SLIDER3 and SLIDER4 acquisition so that the total scan time for the three scans were the same (~14 minutes). For super-resolution reconstruction, Toeplitz matrix was used as the forward model and Tikhonov regularization with a tuning parameter λ (0.1/0.3/0.5) was applied to solve the inverse problem and obtain the thin slice (2mm) high-resolution images2.
3. SNR and spatial blurring evaluation
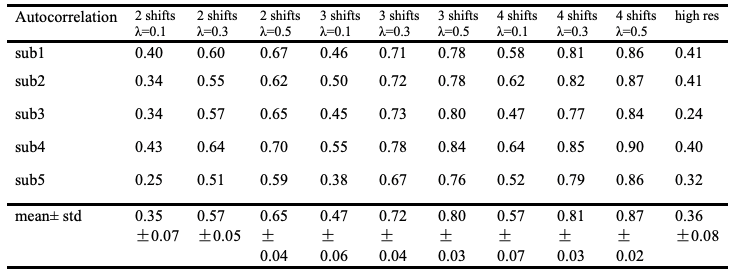
The reconstructed images were evaluated by calculating the spatial and temporal SNR in the gray matter (segmented from MPRAGE). Spatial blurring effect of the reconstructed images was evaluated by calculating the autocorrelation of the image volume and the volume shifted one slice down.
4. Noise characterization
The theoretical SNR for the super-resolution images is √Nset of traditional high-resolution images, where Nset is the number of shifted slices. However, for SMS ASL, the g-factor, as well as physiological and thermal noise, should be considered for SNR which can be expressed as:
$$
SNR_{sms,supres} = \frac{SNR_{supres}}{g_{sms,lowres}} = \sqrt{N_{set}}\times \frac{g_{sms,highres}\times SNR_{sms,highres}}{g_{sms,lowres}} \times \sqrt{\frac{\frac{var_{physio}}{N^{‘}_{full}}+\frac{var_{thermal}}{N_{full}}}{\frac{var_{physio}}{N^{‘}_{meas}}+\frac{var_{thermal}}{N_{meas}}}}
$$
where Nfull and Nmeas are the number of measurements of the standard high-resolution and SMS scan, N’full and N’meas are between 1 and Nfull and Nmeas depending on the temporal correlation of physiological noise, gsms,lowres and gsms,highres are the g-factor for the SMS acquisition of the low-resolution and high-resolution ASL images respectively. Because the coil g-factor generally decreases with larger inter-slice gap for SMS and physiological noise cannot be suppressed as effectively as thermal noise by averaging, we predict that the SNR efficiency of super-resolution ASL will increase with Nset.
Results and Discussion
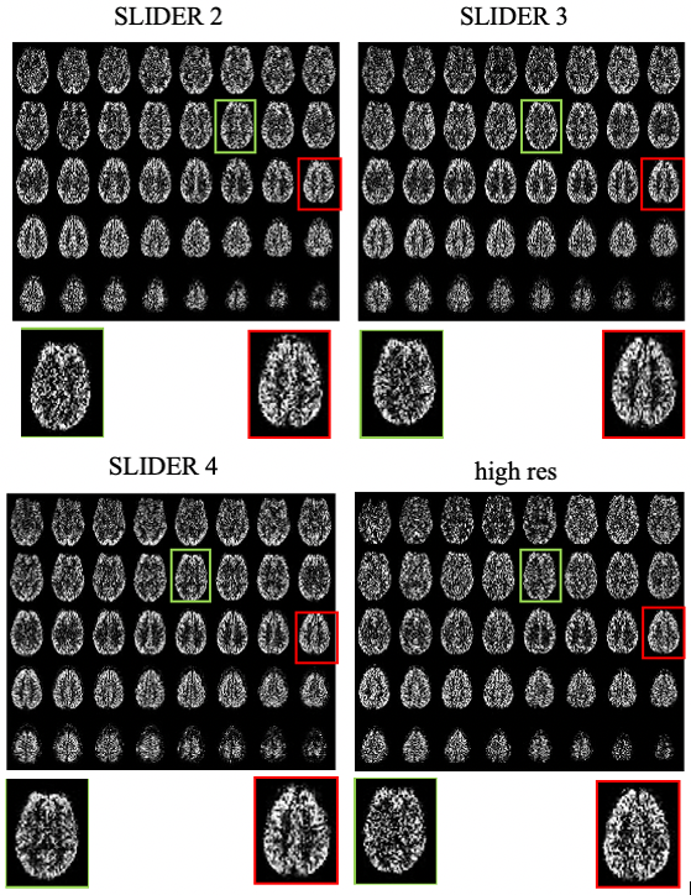
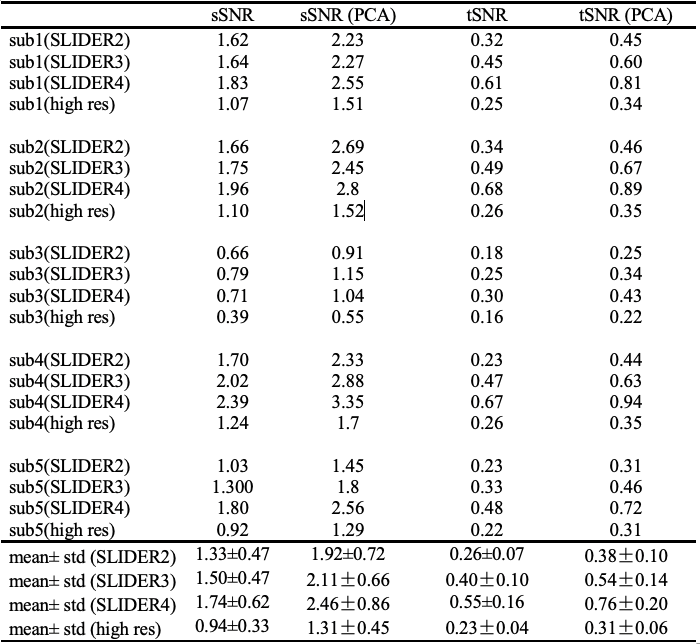
Figure 2 and 3 show the reconstructed super-resolution ASL images for the three SLIDER options and different regularization levels respectively, which show higher SNR compared to the standard high-resolution ASL images. Table 1 shows the SNR improvement for SLIDER SMS ASL compared to the standard high-resolution acquisition, and the SNR improvement increases with more shifted slices. Table 2 summarizes the autocorrelation which evaluates the slice blurring of the reconstructed images. There is increased blurring in the slice direction with more sets of low-resolution images and larger regularization parameter. The trend is stable across the subjects. The g-factor values were quantified using the slice-GRAPPA kernel acquired in the slice-GRAPPA4. The mean g-factor value in the gray matter for SLIDER2/3/4 was 1.69, 1.63 and 1.59, respectively, as a result of increasing inter-slice gap in SMS acquisitions. The g-factor and presence of physiological noise contribute to increasing SNR efficiency of super-resolution ASL with greater Nset.Conclusion
We optimized and evaluated super-resolution perfusion imaging using SLIDER SMS ASL. A greater number of shifted slices is beneficial for SNR efficiency, at the cost of increased slice blurring. Whole-brain super-resolution ASL with isotropic-2mm resolution or higher is feasible for fine-grained analysis of brain perfusion.Acknowledgements
This work was supported by National Institute of Health (NIH) grant UH3-NS100614, R01-NS114382 and R01-EB028297.References
1. Setsompop K, Bilgic B, Nummenmaa A, Fan Q, Cauley S, Huang S, Chatnuntawech I, Yogesh R, Witzel T, Wald LL. SLIce Dithered Enhanced Resolution Simultaneous MultiSlice (SLIDER-SMS) for high resolution (700 um) diffusion imaging of the human brain. Proc ISMRM 2015;24:339.
2. Vu AT, Beckett A, Setsompop K, Feinberg DA. Evaluation of SLIce Dithered Enhanced Resolution Simultaneous MultiSlice (SLIDER-SMS) for human fMRI. Neuroimage 2017.
3. Shao X, Wang Y, Moeller S, et al. A constrained slice‐dependent background suppression scheme for simultaneous multislice pseudo‐continuous arterial spin labeling[J]. Magnetic resonance in medicine, 2018, 79(1): 394-400.
4. Breuer, Felix A., et al. "General formulation for quantitative G‐factor calculation in GRAPPA reconstructions." Magnetic Resonance in Medicine: An Official Journal of the International Society for Magnetic Resonance in Medicine 62.3 (2009): 739-746.
5. Shou Q, Shao X and Wang D. Super-Resolution Multi-band ASL using Slice Dithered Enhanced Resolution (SLIDER) Technique. Proc. Intl. Soc. Mag. Reson. Med. 28 (2020): 0021
Figures