2726
PCASL labeling efficiency measurement with B0 off-resonance compensation at 7T1NINDS/LFMI, National Institutes of Health, Bethesda, MD, United States, 2NINDS/NMRF, National Institutes of Health, Bethesda, MD, United States
Synopsis
At 7T, it is known that B1+ and B0 inhomogeneities reduce the PCASL labeling efficiency. Further, the short T2 of blood also reduces the maximum blood labeling efficiency that can be achieved in practice. In this work, we employed a PCASL-prepared FLASH sequence to measure vessel-specific labeling efficiency of PCASL with B0 off-resonance correction. At 7T, experimental data indicates a maximal labeling efficiency of ~0.6. This study also shows that optimization of PCASL labeling efficiency is possible by tailoring the average gradient according to the blood velocity range and B1 at the feeding arteries.
Introduction
Pseudo-continuous ASL (PCASL) is an established pulse sequence for perfusion MRI of the human brain 1,2. Potential benefits of ultra-high fields (UHF$$$\geq$$$7T) for PCASL include higher SNR and longer blood T1 longitudinal relaxation time. However, this theoretical gain is difficult to achieve because of other factors affecting the labeling process. At UHF, it is well-known that B1+ and B0 inhomogeneities considerably reduce the labeling efficiency in the feeding arteries, especially at the labeling location commonly used for whole brain imaging 3. In addition, blood T2 transverse relaxation time is also significantly shortened, and thus reduces the maximum blood labeling efficiency that can be achieved in practice. Recently, it has been shown that PCASL at 7T can be improved significantly by compensating B0 off-resonance effects in the feeding arteries with an additional RF phase increment and transverse gradient blips into the PCASL RF pulse train 4. Nevertheless, the impact of the B1+ inhomogeneities that accompany 7T head volume transmit coils and the low blood T2 on the labeling efficiency has not been studied. At 7T, increased RF power deposition also hampers compensating the B1+ fall-off at the labeling location by simply increasing the RF power. Blood T2 at 7T is ~68ms, 3 times less compared to 3T 5. Therefore, in this work, we report vessel-specific PCASL labeling efficiency measurements integrating off-resonance corrections. This data provide insight into the labeling performance based on the actual B1+ distribution in feeding arteries and help quantify the cerebral blood flow (CBF) more accurately with PCASL acquisitions at 7T.Methods
Three subjects (1 male and 2 female, age 25$$$\pm$$$4 years) were scanned under an IRB approved protocol on a 7T Magnetom Terra system (Siemens Healthineers, Germany) using a 1Tx/32Rx head array (Nova Medical, USA). Vendor supplied 3rd order shimming covering the brain and the tagging location (bottom of the cerebellum) was employed. Whole-brain (including the labeling plane) B1+ mapping was performed with a pre-saturation-based turbo-FLASH B1-mapping sequence (resolution=5x5x5mm3, TR=10s, TE=1.7ms, FA=10°). A B0 field map of the tagging plane was acquired using a FLASH sequence (resolution=2.5x2.5x2.5mm3, TR=25ms, TE=1.8ms). A 1mm3 resolution TOF scan was also acquired for vessel localization.Labeling efficiency measurements were performed using a PCASL-prepared FLASH sequence with the imaging slice positioned 1cm downstream from the labeling plane. The PCASL module was executed before each phase encoding step of the FLASH read out (resolution=1x1mm2, slice thickness=3mm, TR=600ms, TE=2.7ms, FA=80°). A PCASL labeling duration of 250ms and post-labeling delay (PLD) of 5ms were used. Label and control images were aquired alternatively with the following PCASL parameters: Gmax=3.5mT/m, Gmean=0.25-0.75mT/m, Hanning pulse duration/separation=800/1800us and B1mean=0-~1.0uT. PCASL train included additional RF phase increments and transverse gradients to compensate for B0 off-resonance measured using field map 4.The labeling efficiency ($$$\alpha$$$) was calculated using complex subtraction of the control and label signal normalized by two times the modulus of the control signal acquired with PCASL power off. Finally, whole-brain PCASL images were acquired with off-resonance correction as described previously 4 and the CBF was quantified using the measured labeling efficiency according to the model in 1.
Results
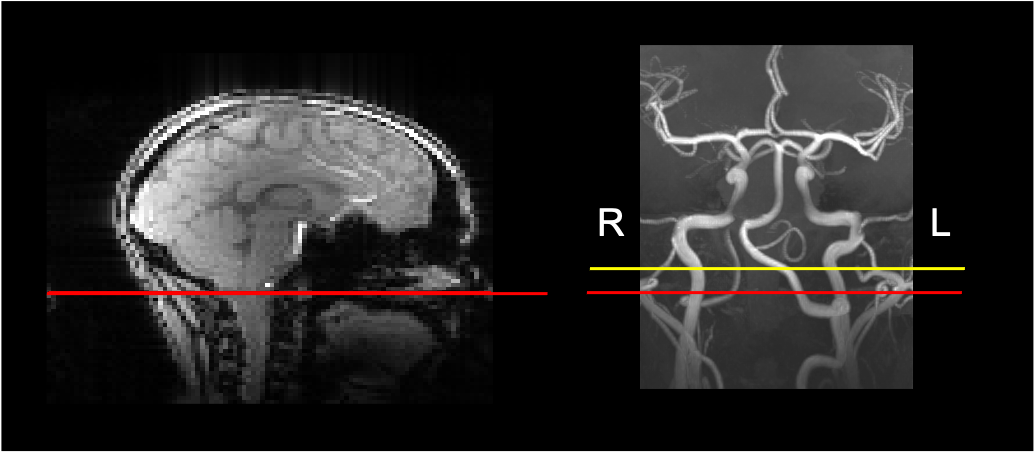
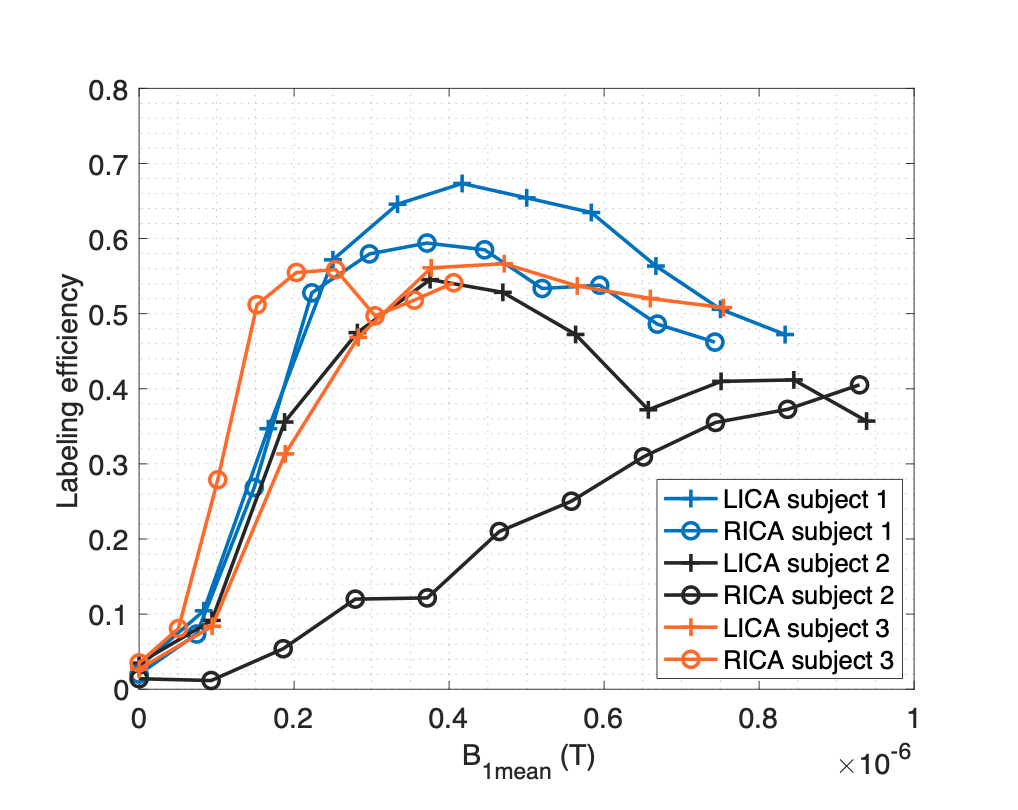
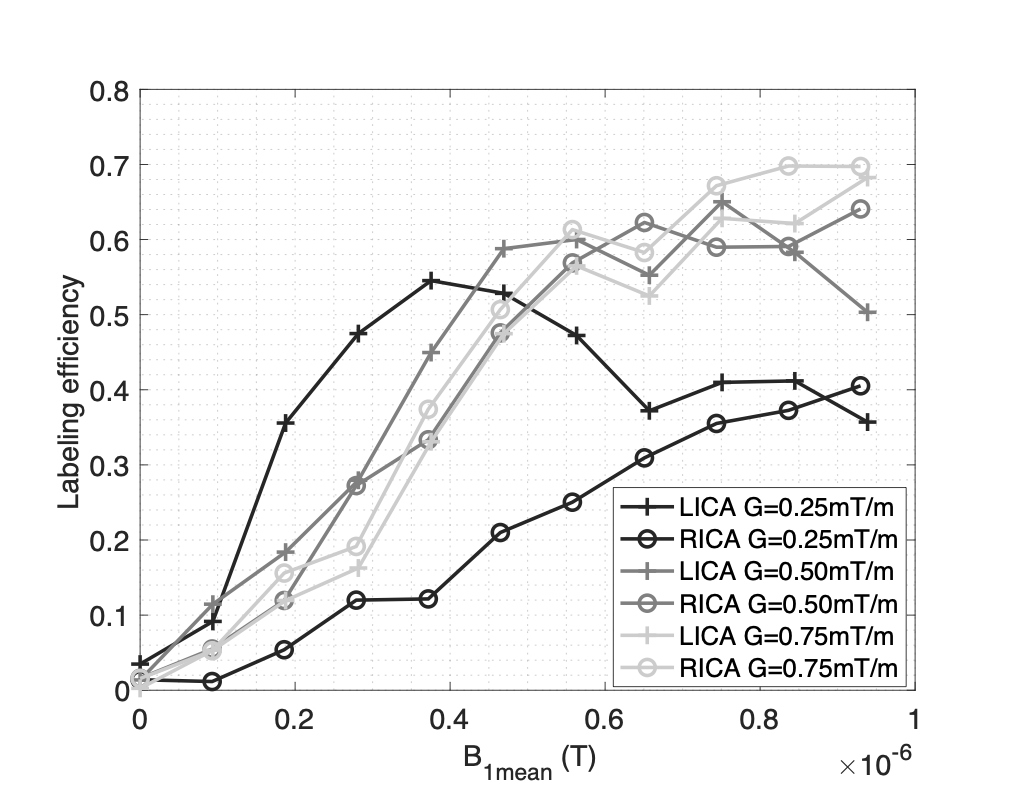
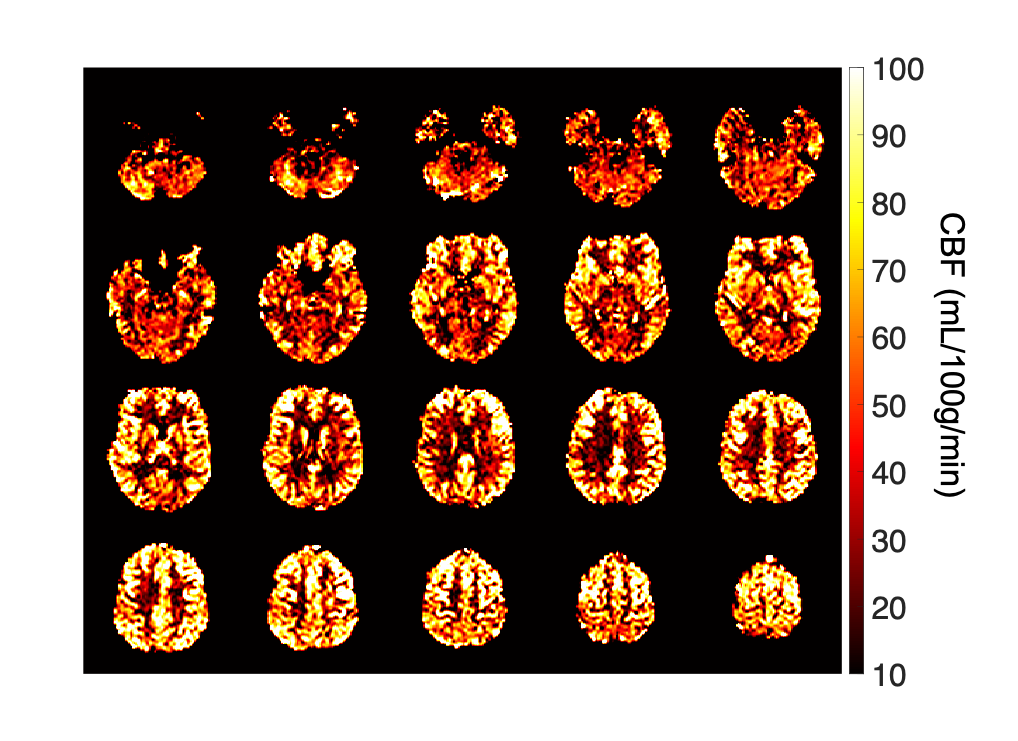
Figure 1 presents typical PCASL labeling location and imaging slice used for labeling efficiency measurements. The average B1+ reduction at the internal carotid arteries (ICA) in the labeling plane was ~45%. Figure 2 shows the measured $$$\alpha$$$ with off-resonance correction as a function of B1mean at each ICA for 6 arteries acquired with a Gmean of 0.25mT/m. For 4 of the arteries, the maximun measured $$$\alpha$$$ was ~0.6 at a B1mean of ~0.4uT. One of the arteries (subject 2, RICA) showed a steady increase of $$$\alpha$$$ with B1mean. Figure 3 shows labeling efficiency data for 2 arteries at different Gmean values for subject 2. Data show that increased Gmean and B1mean could be used to improve $$$\alpha$$$. The labeling efficiency of RICA improved significantly at higher Gmean. Figure 4 show an example of (Fig. 2, subject 1) whole-brain CBF maps acquired with B0 off-resonance correction. The average CBF of large ROI in the cortex was found to be 66mL/100g/min using an $$$\alpha$$$ of 0.6.Discussion
In this work, we measured the PCASL labeling efficiency at 7T with off-resonance correction at different B1mean and Gmean. Preliminary results show that the measured labeling efficiency at 7T was lower (~0.6) than that typically reported at 3T 6. We believe this can be attributed to short T2 of blood at 7T 5. With short T2, it is more difficult to satisfy the adiabatic condition for all blood velocities and the labeling gradient associated with B1 determines the velocity range that can be inverted most efficiently. Data indicate that higher efficiencies could be obtained with a combination of higher Gmean and B1mean. For longer labeling periods used in whole-brain PCASL, achievable B1mean is limited to ~0.6uT due to SAR considerations. Current data indicate that the labeling would be maximized with a Gmean of 0.5mT/m. This study shows that further optimization of PCASL labeling efficiency is possible by tailoring the average gradient according to the blood velocity range and B1 at the feeding arteries.Acknowledgements
No acknowledgement found.References
1. Alsop DC, Detre JA, Golay X, Günther M, Hendrikse J, Hernandez-Garcia L, et al. Recommended implementation of arterial spin-labeled perfusion MRI for clinical applications: A consensus of the ISMRM perfusion study group and the European consortium for ASL in dementia: Recommended Implementation of ASL for Clinical Applications. Magn Reson Med. 2015;73:102–16.
2. Dai W, Garcia D, de Bazelaire C, Alsop DC. Continuous flow-driven inversion for arterial spin labeling using pulsed radio frequency and gradient fields: Pulsed Continuous Arterial Spin Labeling. Magn Reson Med. 2008;60:1488–97.
3. Ghariq E, Teeuwisse WM, Webb AG, van Osch MJP. Feasibility of pseudocontinuous arterial spin labeling at 7 T with whole-brain coverage. Magn Reson Mater Phys Biol Med. 2012;25:83–93.
4. Saib G, Koretsky A, Talagala SL. Optimization of Pseudo-Continuous Arterial Spin Labeling using Off-resonance Compensation Strategies at 7T. Proc ISMRM. 2020;
5. Krishnamurthy LC, Liu P, Xu F, Uh J, Dimitrov I, Lu H. Dependence of blood T 2 on oxygenation at 7 T: In vitro calibration and in vivo application: Blood T 2 at 7 T. Magn Reson Med. 2014;71:2035–42.
6. Chen Z, Zhang X, Yuan C, Zhao X, van Osch MJP. Measuring the labeling efficiency of pseudocontinuous arterial spin labeling. Magn Reson Med. 2017;77:1841–52.
Figures