2721
Reduction of motion effects in myocardial arterial spin labeling1Radiology, Clínica Universidad de Navarra, Pamplona, Spain, 2IdiSNA, Instituto de Investigación Sanitaria de Navarra, Pamplona, Spain, 3Universidad Carlos III de Madrid, Madrid, Spain, 4Instituto de Investigación Sanitaria Gregorio Marañón, Madrid, Spain, 5Siemens Healthineers, Madrid, Spain
Synopsis
This work investigated the impact of three different breathing strategies, named breathhold (BH), synchronized-breathing (SB) and free-breathing (FB), together with motion detection and correction algorithms in myocardial arterial spin labeling (ASL) images. Results indicate the superiority of FB combined with pairwise registration, which showed higher accuracy (in synthetic images) and higher intrasession reproducibility together with lower variability across subjects (in in vivo images). BH and SB after motion detection provided similar results, but their practical application is more complicated as it demands the subject's collaboration to follow the respiratory pattern in SB or perform the apneas in BH.
INTRODUCTION
Arterial spin labeling (ASL) is a promising non-contrast alternative to first-pass imaging for the quantification of myocardial blood flow (MBF). Nevertheless, the presence of cardiac and respiratory motion hinders its application. Motion effects can be minimized with ECG-gating and breathing strategies, such as breathhold (BH)1, synchronized-breathing (SB)2,3 or free-breathing (FB) combined with image registration4,5.For the non-rigid registration of ASL images, pairwise5,6 or groupwise7 approaches are available. The pairwise method registers first a reference label-control pair and subsequently all other label and control images independently to their corresponding reference, to minimize the effects of label-control intensity differences. In contrast, the groupwise approach registers simultaneously the entire dataset (baseline, label and control images).
This work aimed to investigate the impact of different breathing strategies together with motion detection and correction algorithms in myocardial ASL images and to assess reproducibility of the perfusion measurements.
METHODS
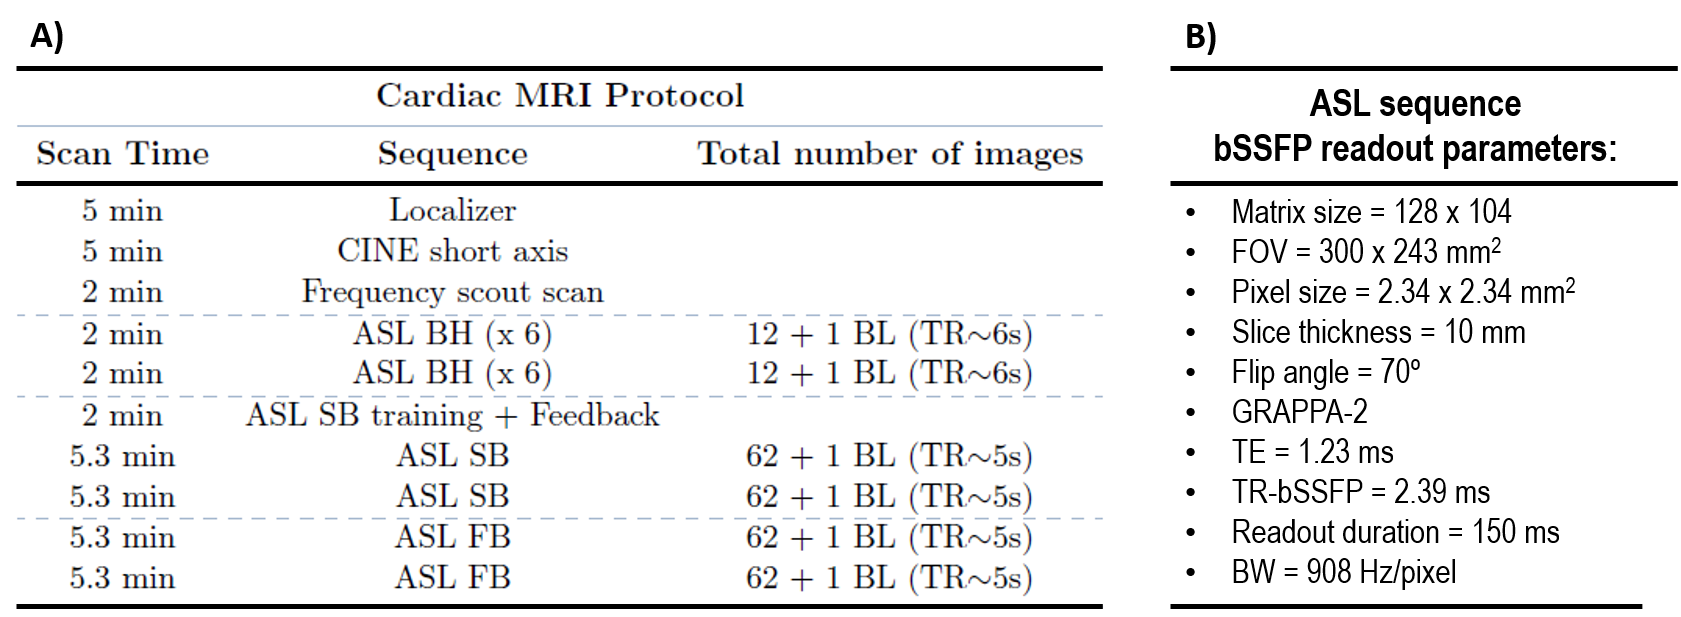
Protocol:12 healthy subjects were subjected to a cardiac MRI exam on a 3T Skyra with an 18-channel array coil. The scanning protocol is presented in Table1. The ECG-gated FAIR-ASL sequence included four presaturation pulses, a hyperbolic-secant adiabatic inversion pulse, inversion time (TI) of 1s and bSSFP readout. A baseline image (M0) was also acquired. The ASL sequence was run under different breathing strategies (BH, SB and FB), twice in each condition, to assess intrasession reproducibility. Respiratory motion was expected to be minimized in the BH and SB strategies, in which, unlike FB, there is an effort to freeze motion due to respiration.
Motion detection:
A voxel within the anterior myocardial segment was manually selected in an image acquired at expiration. The coefficient of variation (CVvoxel), computed as the ratio of the standard deviation (SD) to the mean intensity across images, was calculated at this location. Sequences were classified as having low (CVvoxel<=10%) or moderate (CVvoxel>10%) motion. In the group of low motion, no outliers were discarded. In the group of moderate motion, outliers were identified as those whose intensity at this voxel was deviated by more than 2SD below the mean.
Motion correction:
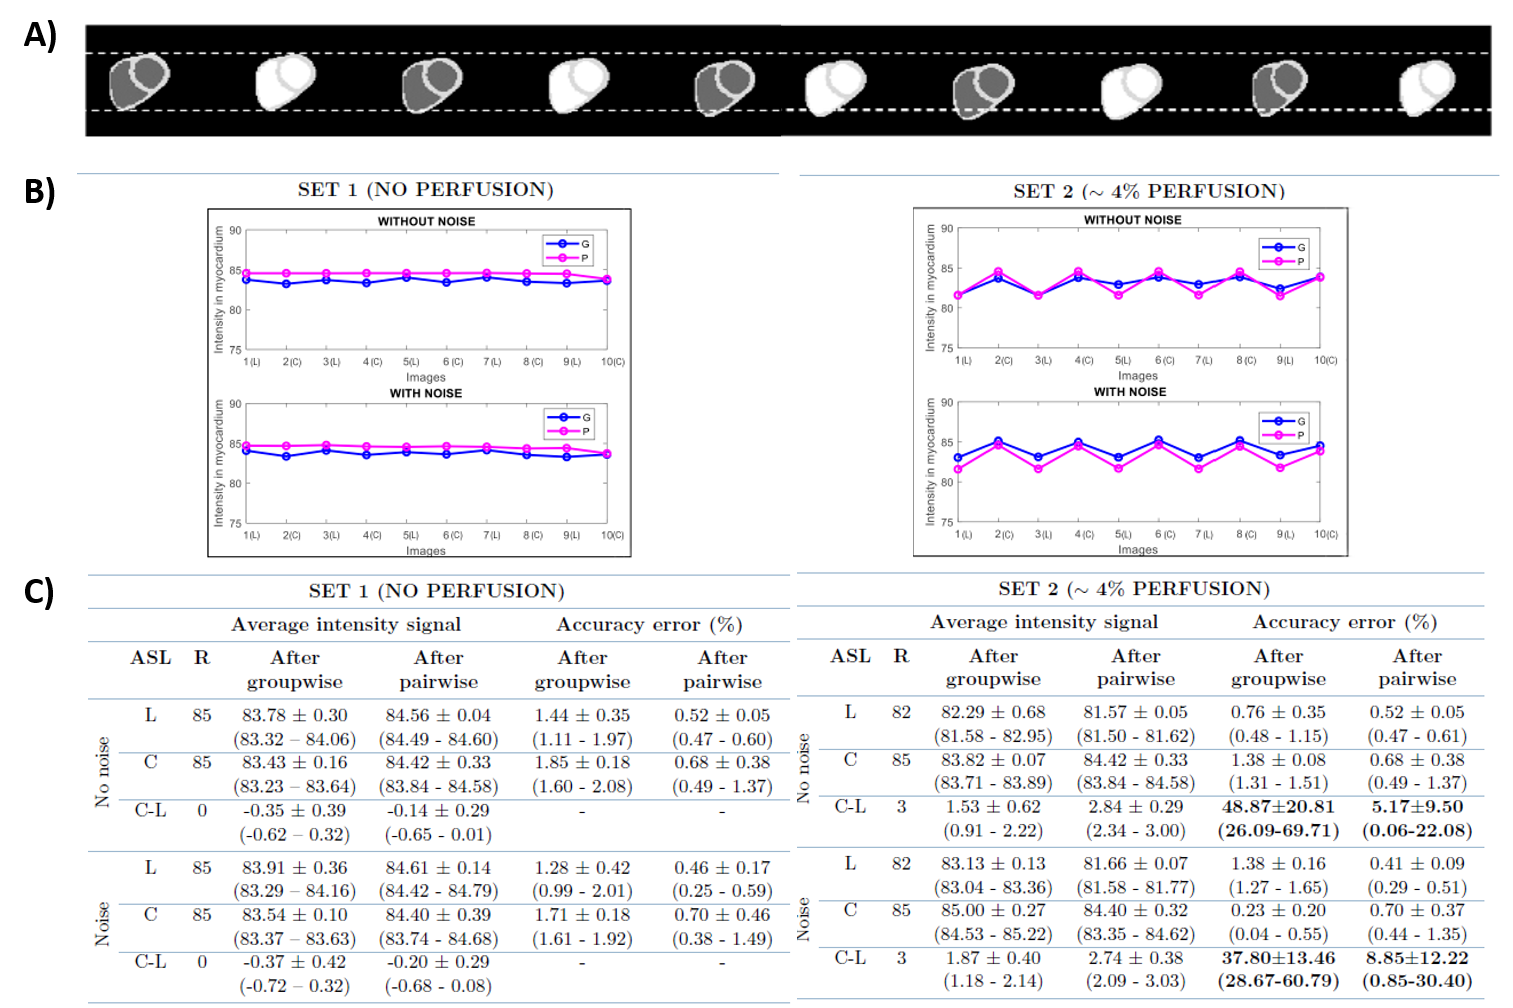
The performance of aforementioned registration approaches was tested in synthetic and in vivo ASL images. Two synthetic datasets were created based on the appearance of in vivo images, simulating signal with and without perfusion. Motion between label-control image pairs was introduced in all directions (Figure 2A). Both sets were corrupted with Gaussian noise. In synthetic data, the algorithms’ performance was assessed by comparison of mean intensity values at the myocardium (before and after registration), which were used to compute the accuracy error, as the absolute difference between measured and reference intensity divided by the reference intensity. Registrations were run with Elastix8.
In vivo data analysis:
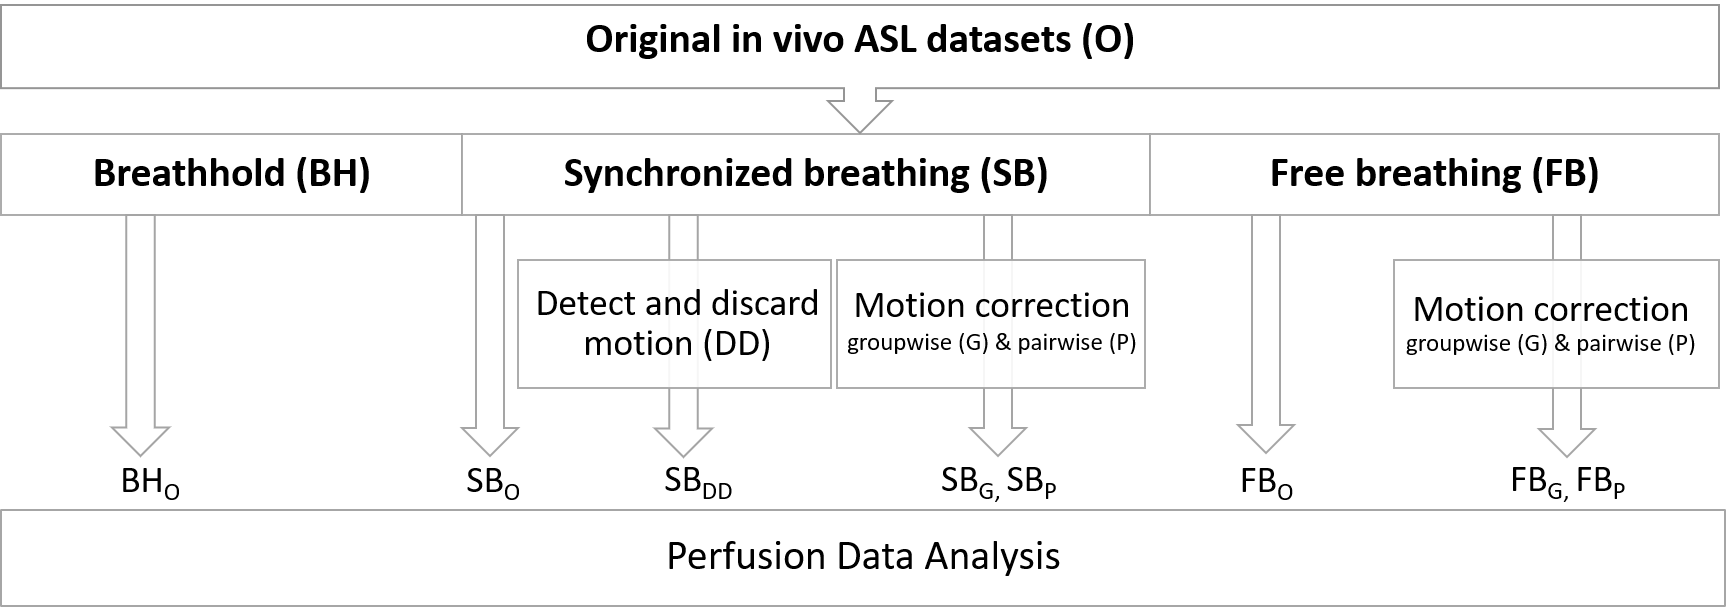
After motion detection and correction, eight in vivo perfusion datasets were analyzed (Figure 1). Control (C) and label (L) images were pairwise subtracted and averaged. Myocardial regions of interest were manually drawn from the average perfusion-weighted image (in SB and FB datasets) and from each perfusion-weighted image (in BH dataset). Outliers in the perfusion-weighted image series were identified as ±2SD from the mean. MBF (ml/g/min) was estimated as: $$$\frac{60 \cdot \lambda \cdot (C - L)}{2 \cdot M_{0} \cdot TI \cdot exp^{\frac{TI}{T1_{blood}}}}$$$ $$$\lambda$$$=1ml/g; T1blood=1.664s. Data assessment was done by comparison of the MBF variability found across subjects and intrasession reproducibility.
Statistical analysis:
Friedman test, within-subject coefficient of variation (wsCV) and Bland-Altman plots.
RESULTS AND DISCUSSION
After motion detection, the percentage of detected outliers (mean±SD: 30 ±10% in FB and 16±16% in SB) was significantly greater in the FB than SB datasets (p=0.03,Wilcoxon-signed-rank). Therefore, detected outliers were only discarded in the SB strategy.Figure 2(B-C) shows the results obtained in the myocardium after the registration of synthetic images. In the set with no perfusion, the intensity across images presents low variability. In the set with perfusion, an alternating label-control zigzag pattern is observed. The average perfusion-weighted signal was lower than the reference value and the accuracy error in the perfusion-weighted images (in bold) was higher in the groupwise approach.
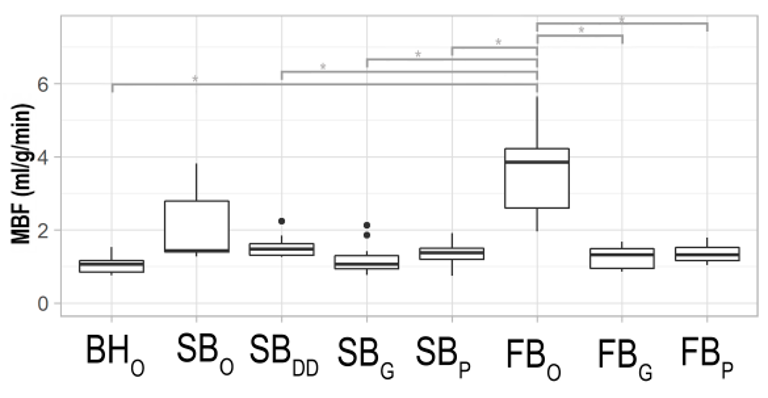
Figure 3 shows boxplots of MBF measurements in vivo. The Friedman test revealed significant differences (p=5.65·10-8) across datasets. Post-hoc comparisons after Hochber correction showed that these differences lied between the original FB and all other (p=0.05 for all comparisons), but the original SB dataset. This can be explained by the overestimation in MBF values and large variability across subjects found in the original datasets due to the fact that, in the presence of motion, perfusion values are contaminated with the intensity signal of the blood pool.
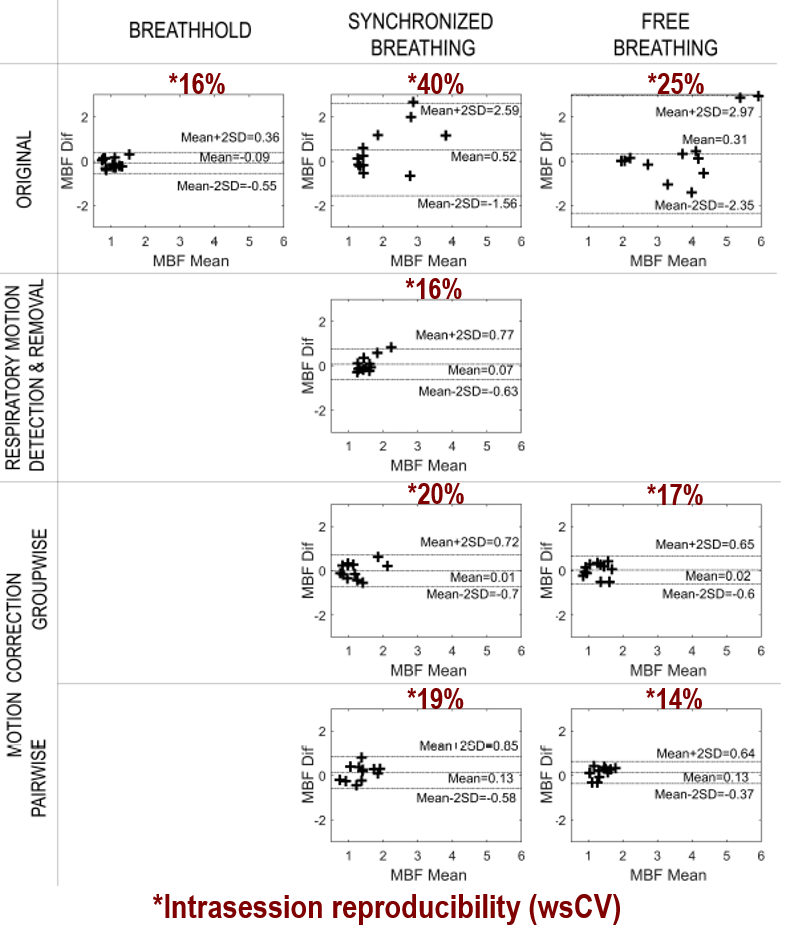
Figure 4 shows Bland-Altman plots and the wsCV of MBF measurements in vivo. BH, SBDD and FBP yielded the best reproducibility with wsCV of 16%, 16% and 14%, respectively. Bland-Altman showed a lack of agreement in the original SB and FB perfusion measurements. After motion detection or correction, limits of agreement were narrower, indicating more confident measurements.
CONCLUSION
Synthetic and experimental results agreed in the superiority of FB after pairwise registration, which showed higher accuracy (synthetic images) and higher intrasession reproducibility and lower variability across subjects (in vivo images). BH and SB after motion detection provided similar results, but their practical application is more complicated because it requires the subject’s collaboration.Acknowledgements
This work has been supported by Asociación de Amigos de la Universidad de Navarra and Banco Santander.References
1. Z. Zun, E. C. Wong, and K. S. Nayak. Assessment of myocardial blood flow (MBF) in humans using arterial spin labeling (ASL): feasibility and noise analysis. Magn. Reson. Med. vol. 62, no. 4, pp. 975–983, 2009, doi: 10.1002/mrm.22088.
2. B. P. Poncelet et al. Measurement of human myocardial perfusion by double-gated flow alternating inversion recovery EPI. Magn. Reson. Med. vol. 41, no. 3, pp. 510–519, 1999, doi: 10.1002/(SICI)1522-2594(199903)41:3<510::AID-MRM13>3.0.CO;2-G.
3. V. Aramendía-Vidaurreta, R. Echeverría-Chasco, M. Vidorreta, G. Bastarrika, and M. A. Fernández-Seara. Quantification of Myocardial Perfusion With Vasodilation Using Arterial Spin Labeling at 1.5T. J. Magn. Reson. Imaging, 2020, doi: 10.1002/jmri.27396.
4. D. J. J. Wang, X. Bi, B. B. Avants, T. Meng, S. Zuehlsdorff, and J. A. Detre. Estimation of perfusion and arterial transit time in myocardium using free-breathing myocardial arterial spin labeling with navigator-echo. Magn. Reson. Med., vol. 64, no. 5, pp. 1289–1295, 2010, doi: 10.1002/mrm.22630.
5. V. Aramendía-Vidaurreta, A. García-Osés, M. Vidorreta, G. Bastarrika, and M. A. Fernández-Seara. Optimal repetition time for free breathing myocardial arterial spin labeling. NMR Biomed., no. January, p. e4077, 2019, doi: 10.1002/nbm.4077.
6. A. Javed, T. R. Jao, and K. S. Nayak. Motion correction facilitates the automation of cardiac ASL perfusion imaging. 2015. doi: 10.1186/1532-429X-17-S1-P51.
7. W. Huizinga et al., “PCA-based groupwise image registration for quantitative MRI,” Med. Image Anal., vol. 29, pp. 65–78, 2016, doi: 10.1016/j.media.2015.12.004.
8. S. Klein, M. Staring, K. Murphy, M. A. Viergever, and J. P. W. Pluim, “Elastix: A toolbox for intensity-based medical image registration,” IEEE Trans. Med. Imaging, vol. 29, no. 1, pp. 196–205, 2010, doi: 10.1109/TMI.2009.2035616.
Figures