2718
Systematic investigation of the sensitivity of optimised pCASL protocols to macrovascular contamination1Institute of Biomedical Engineering, University of Oxford, Oxford, United Kingdom, 2Radiological Sciences, Division of Clinical Neurosciences, School of Medicine, University of Nottingham, Nottingham, United Kingdom, 3Sir Peter Mansfield Imaging Centre, School of Medicine, University of Nottingham, Nottingham, United Kingdom
Synopsis
Optimised pCASL protocols may still be sensitive to macrovascular contamination (MVC), leading to high CBF estimation error. In this study, we conducted a systematic investigation of CBF sensitivity to MVC from a comprehensive set of optimal pCASL protocols. The general kinetic model was only robust for CBF estimation when tissue ATT was less than 1.5s. An extended kinetic model could reduce CBF sensitivity to up to 2.3s. The results of CBF sensitivity maps could be used for examining a protocol for possible MVC effects before scanning, or data interpretation afterwards.
Introduction
Optimal sampling strategy has been used in pseudo-continuous arterial spin labelling (pCASL) to obtain protocols designed to achieve higher CBF estimation accuracy1. Previous work has shown that while these protocols may perform better under an ideal kinetic model, they could be sensitive to macrovascular contamination (MVC), leading to high CBF estimation error2. This simulation work systematically investigates the CBF estimation sensitivity to MVC in a comprehensive set of optimal pCASL protocols3, and demonstrates that adding a macrovascular compartment in the estimation model could benefit CBF estimation in most of the scenarios.Methods
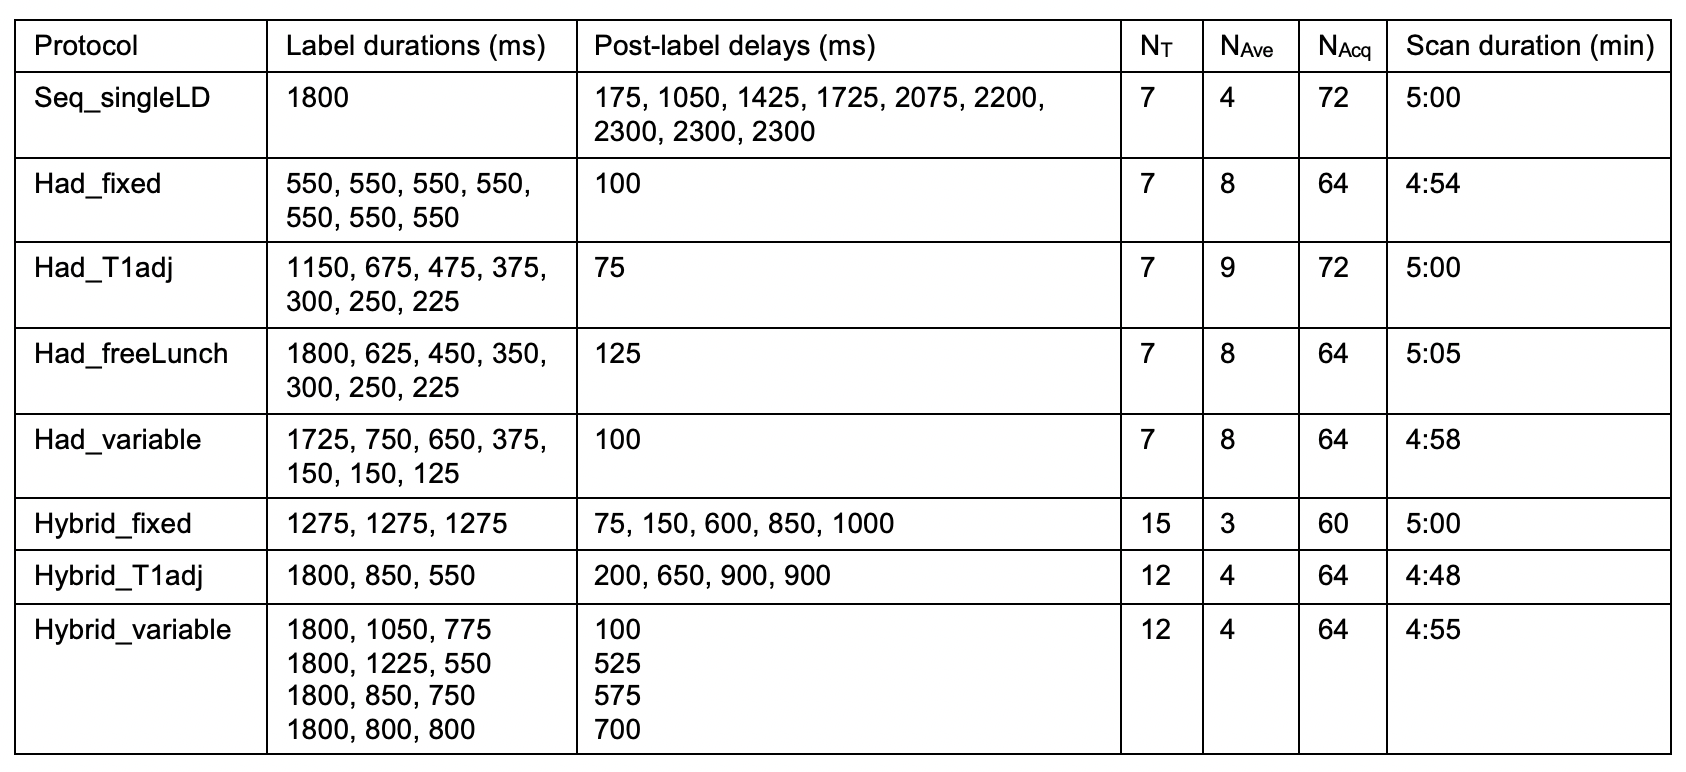
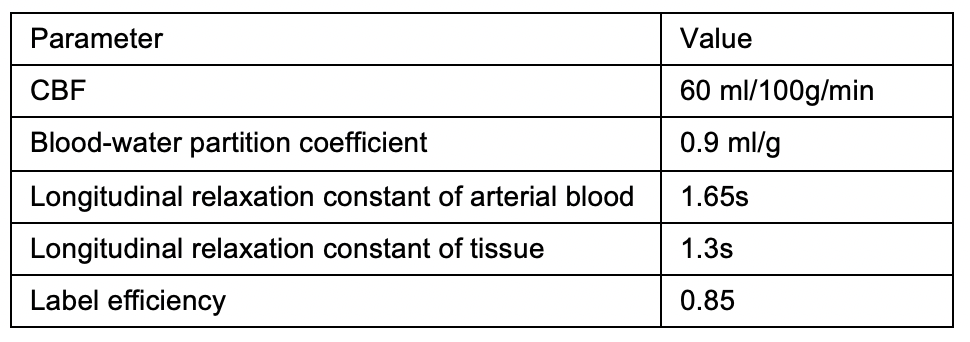
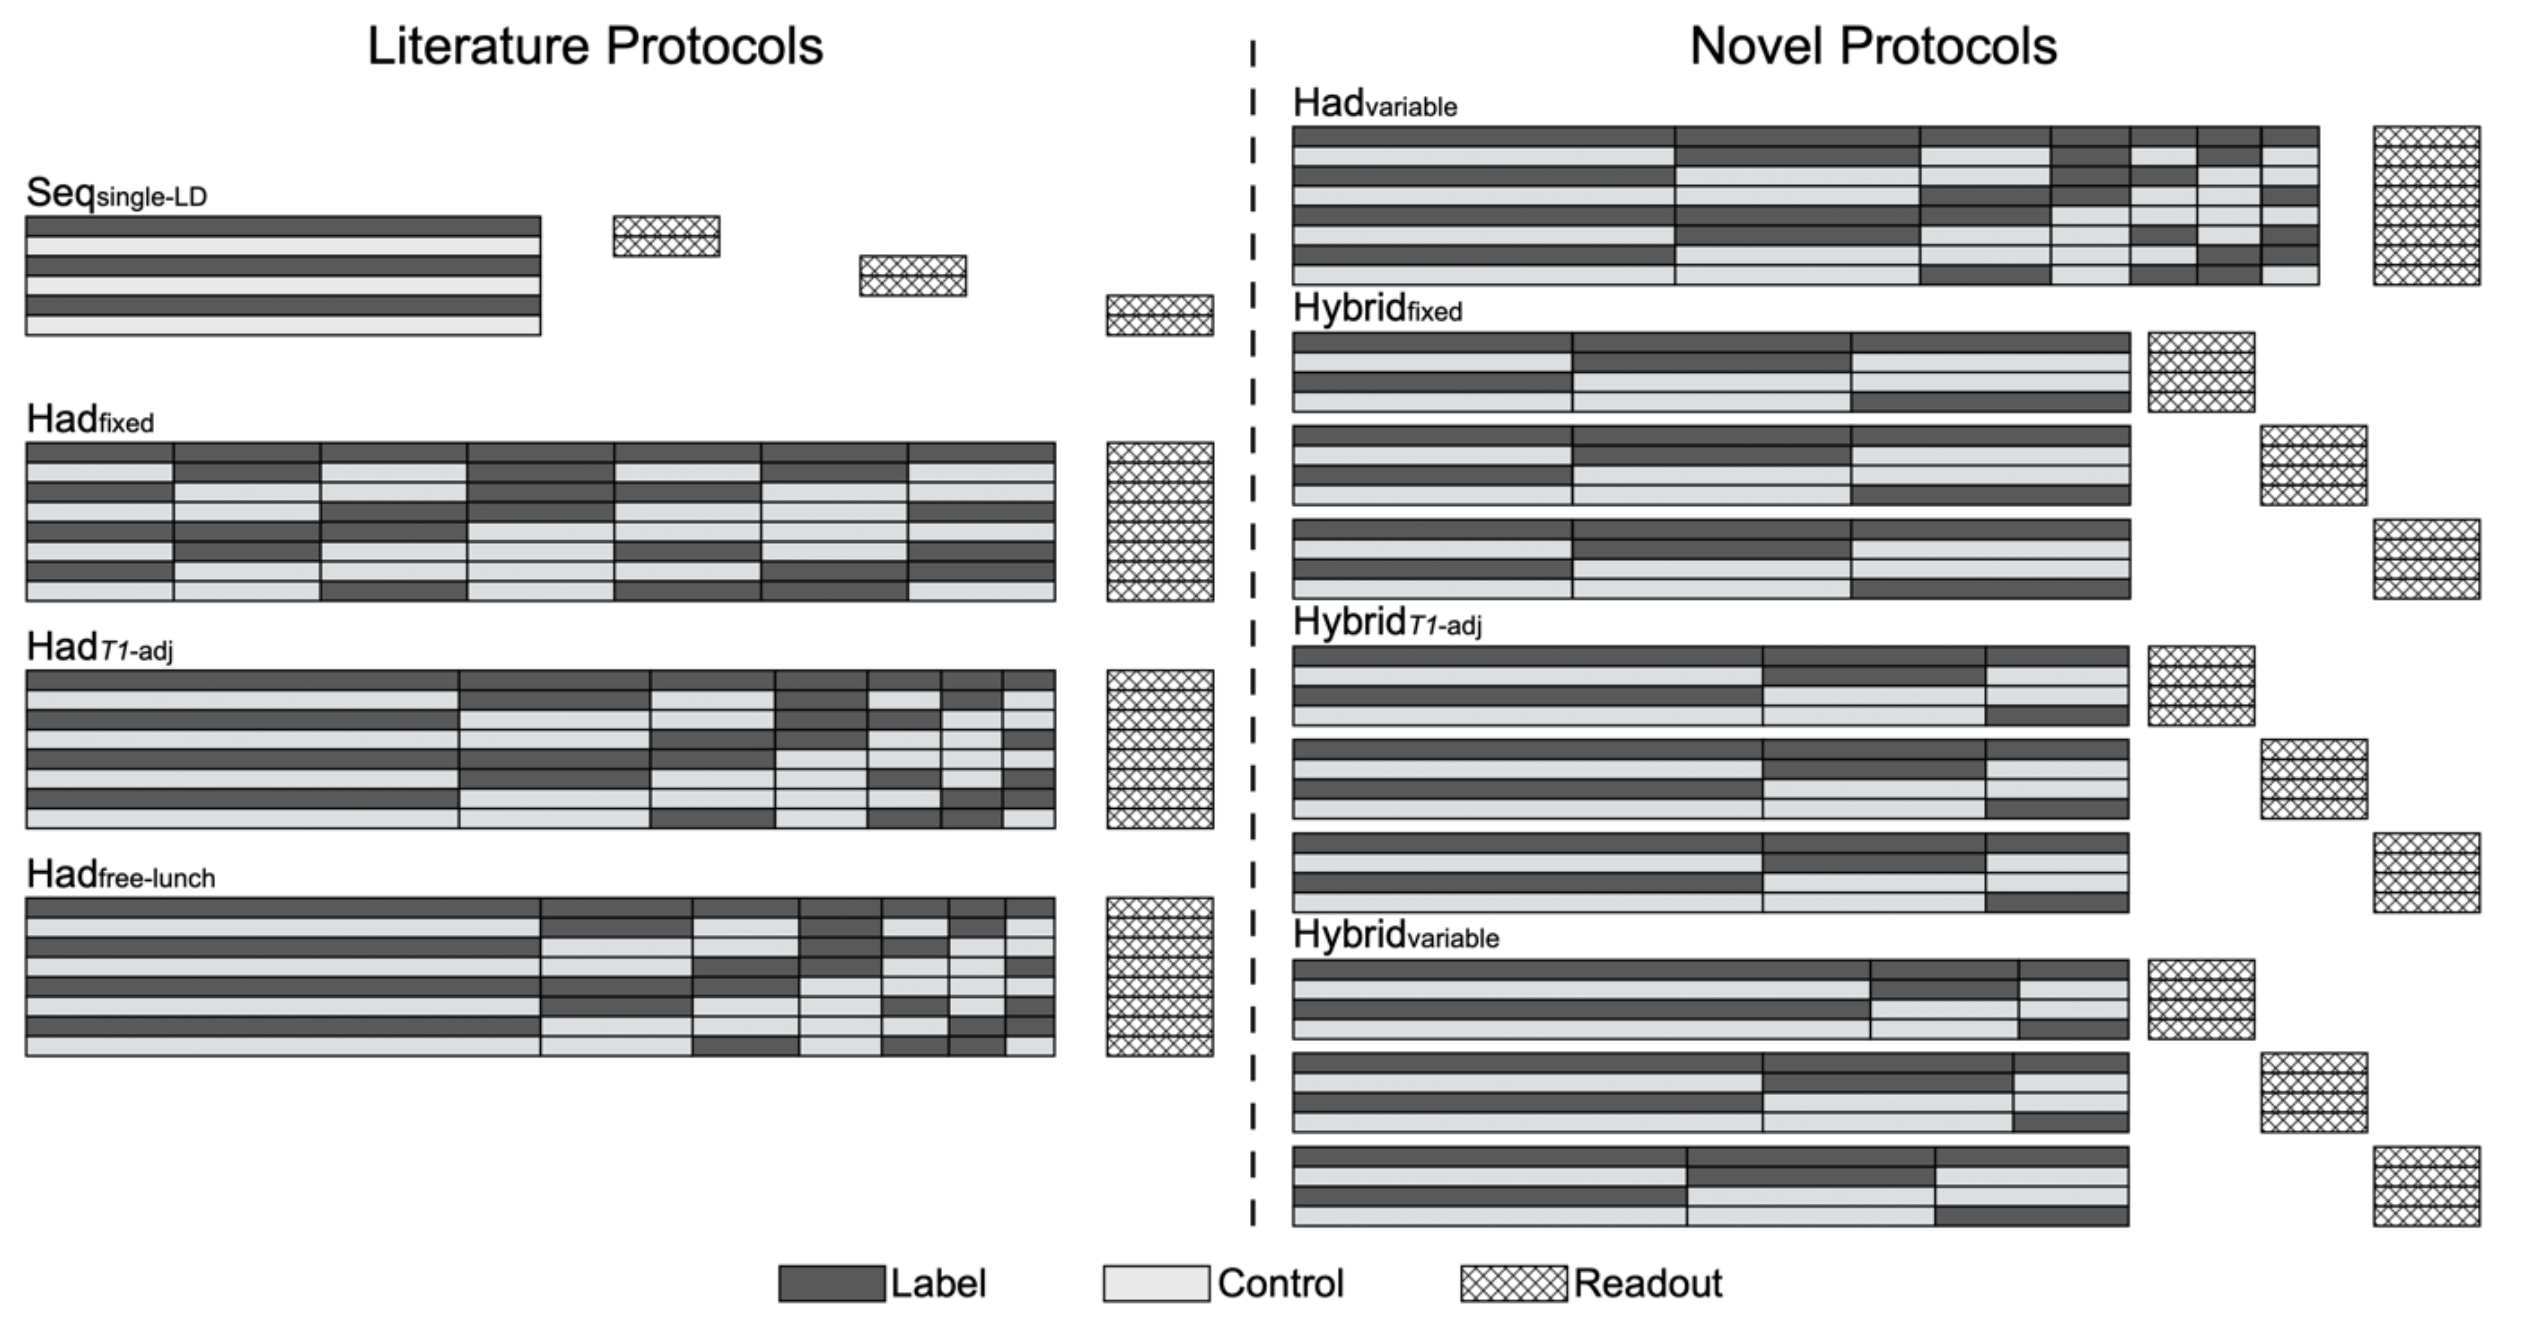
We selected eight representative optimal pCASL protocols3 including a sequential multi-PLD protocol (Seq_singleLD), four time-encoded multi-LD protocols with various label duration block types (Had_fixed, Had_T1adj, Had_freeLunch, Had_variable), and three time-encoded multi-PLD (‘Hybrid’) protocols (Hybrid_fixed, Hybrid_T1adj, Hybrid_variable). The protocol timings and schematics are shown in Table 1 and Figure 1, respectively. PCASL signals using the general kinetic model4 (GKM) with a macrovascular component5 were simulated and added Gaussian white noise6 to give an SNR of 10. The arterial blood volume (aBV) of the macrovascular component varied between 0 and 2.0%. Tissue ATT (ATTt) ranged from 0.5s to 3.0s, with the macrovascular transit time (ATTa) varied between 0 to each ATTt. Other simulation parameters can be found in Table 2. The signals were then fitted with two models in the BASIL toolkit of FSL7: GKM and GKMmvc, the latter explicitly accounting for the macrovascular signal. CBF and ATT estimation errors were obtained and averaged over 500 simulations. To quantify CBF sensitivity to MVC we calculated the slopes of the line of best fit of the CBF estimation error curves (unit: error% per 1% aBV) at each combination of ATTt and ATTa. Sensitivity values across the simulated ATTt and ATTa ranges were used to generate a CBF sensitivity map for each individual protocol.Results and Discussion
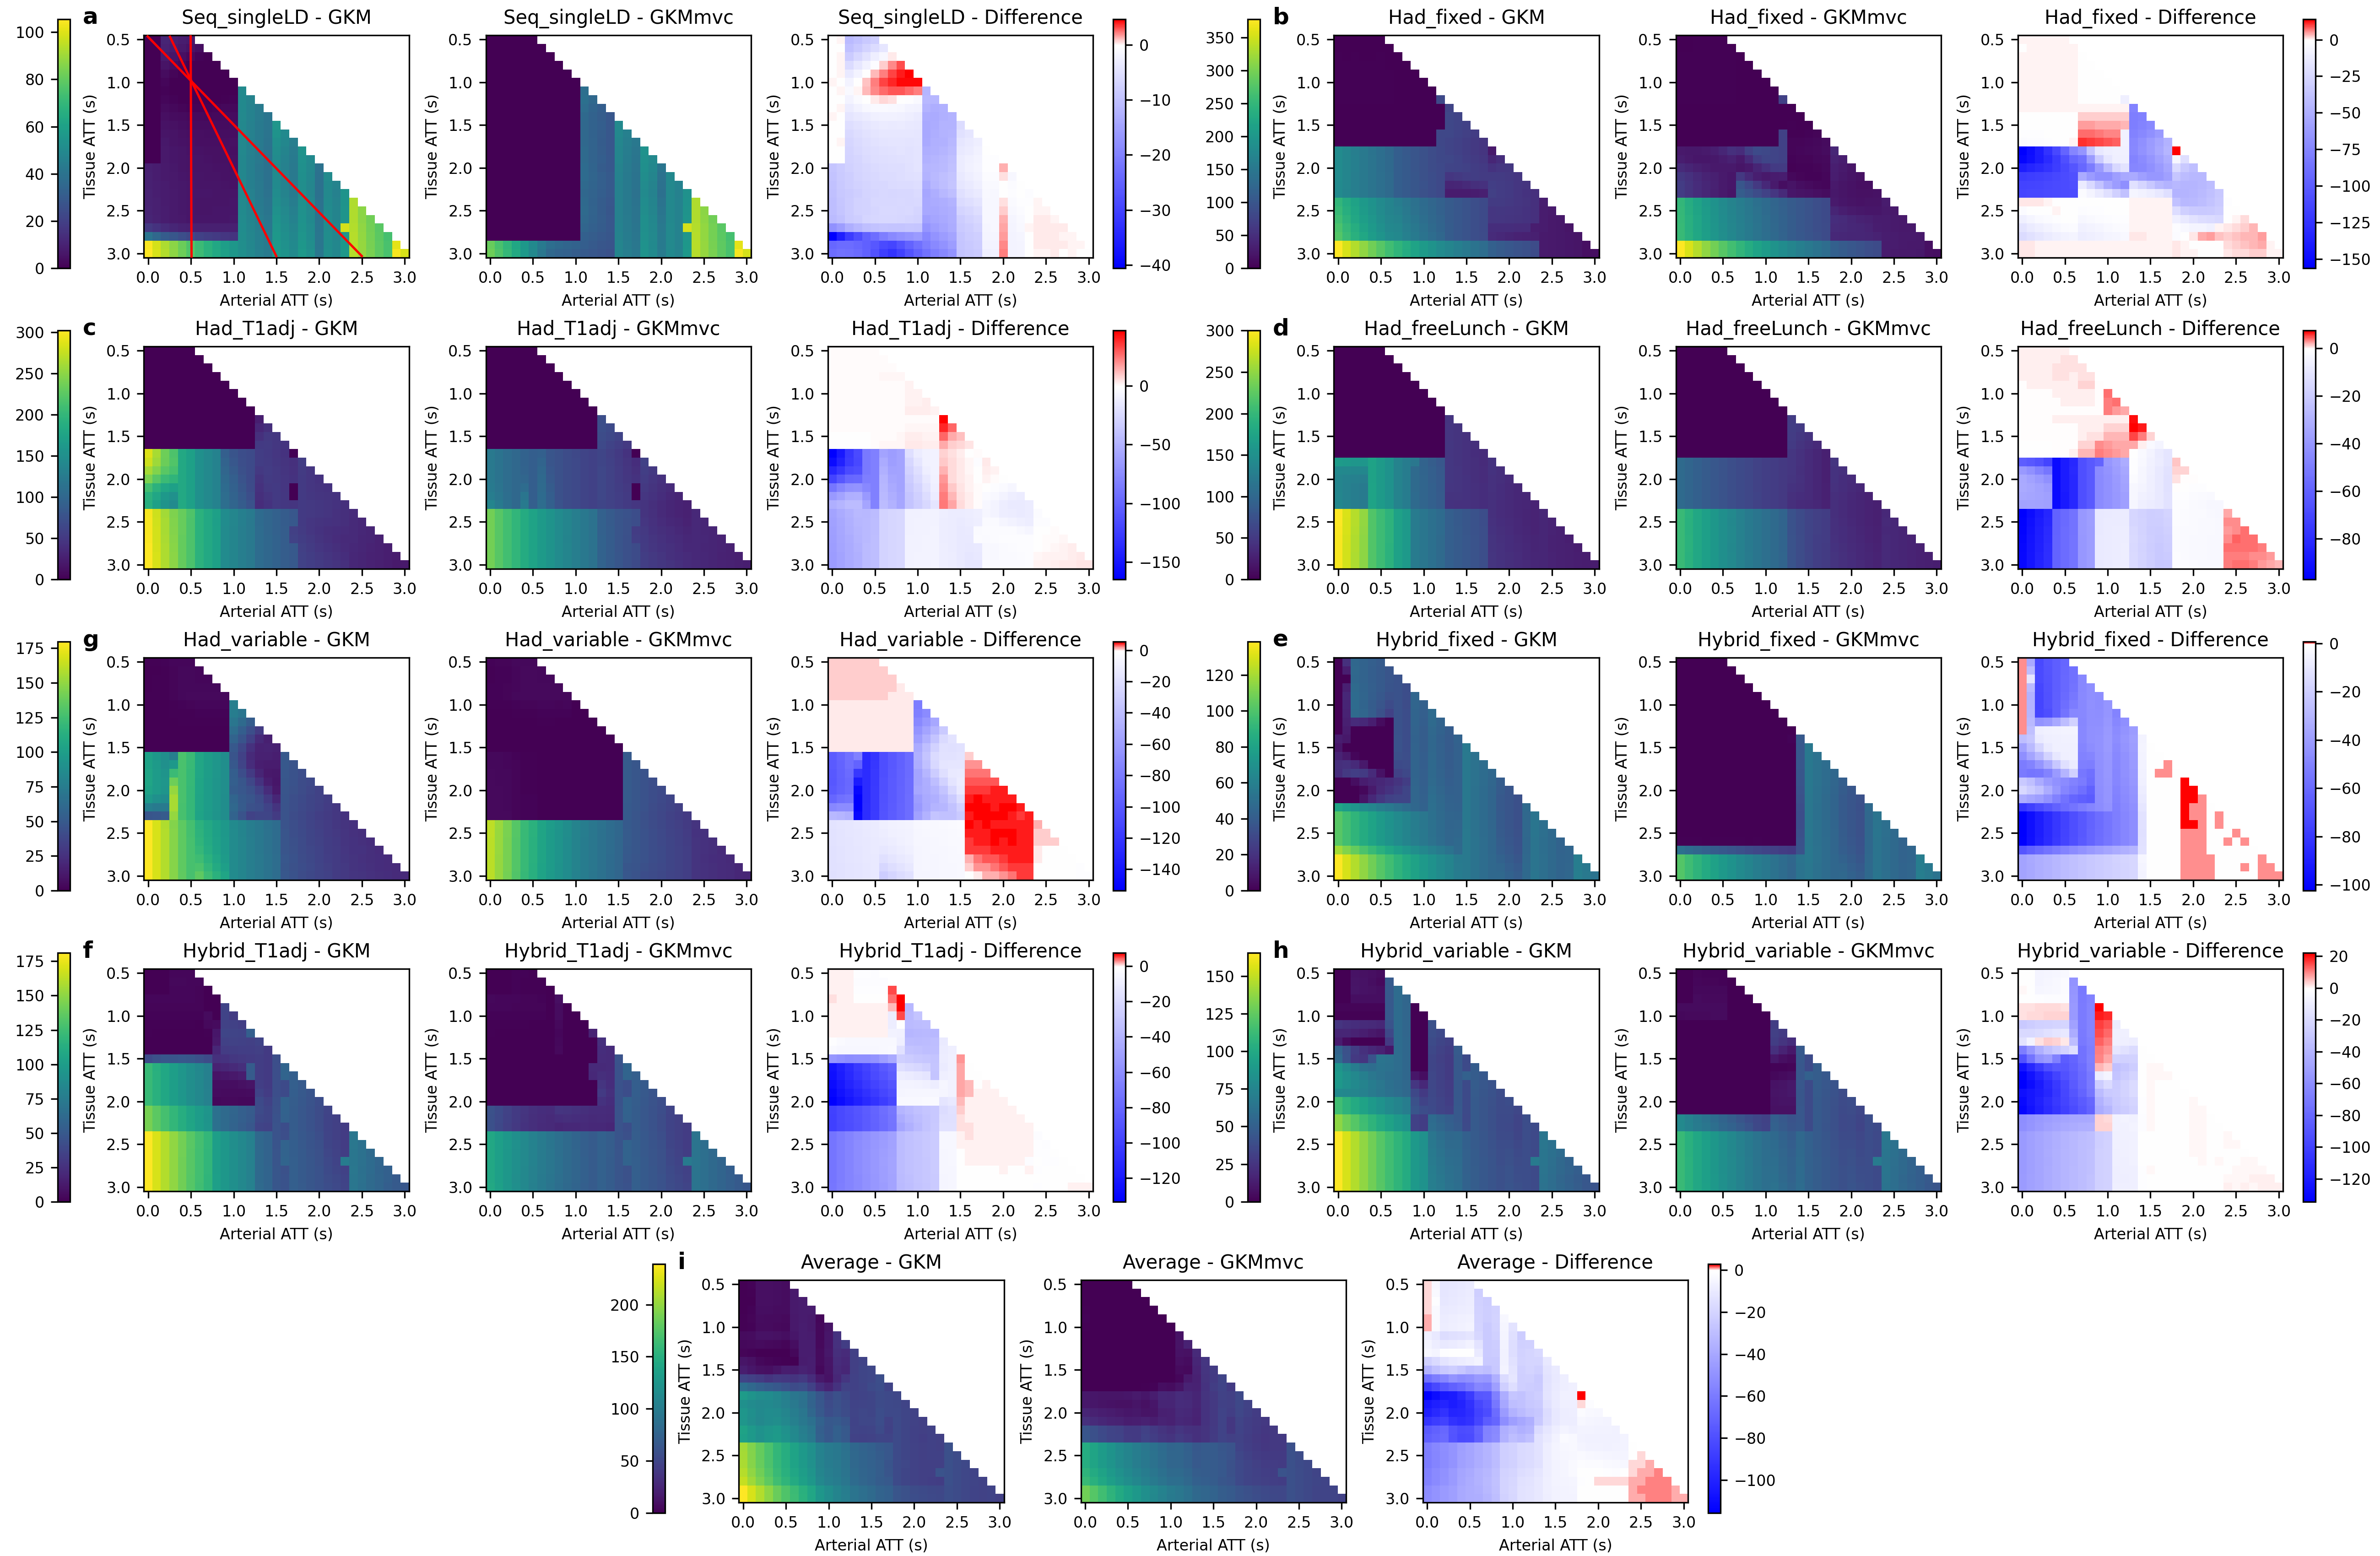
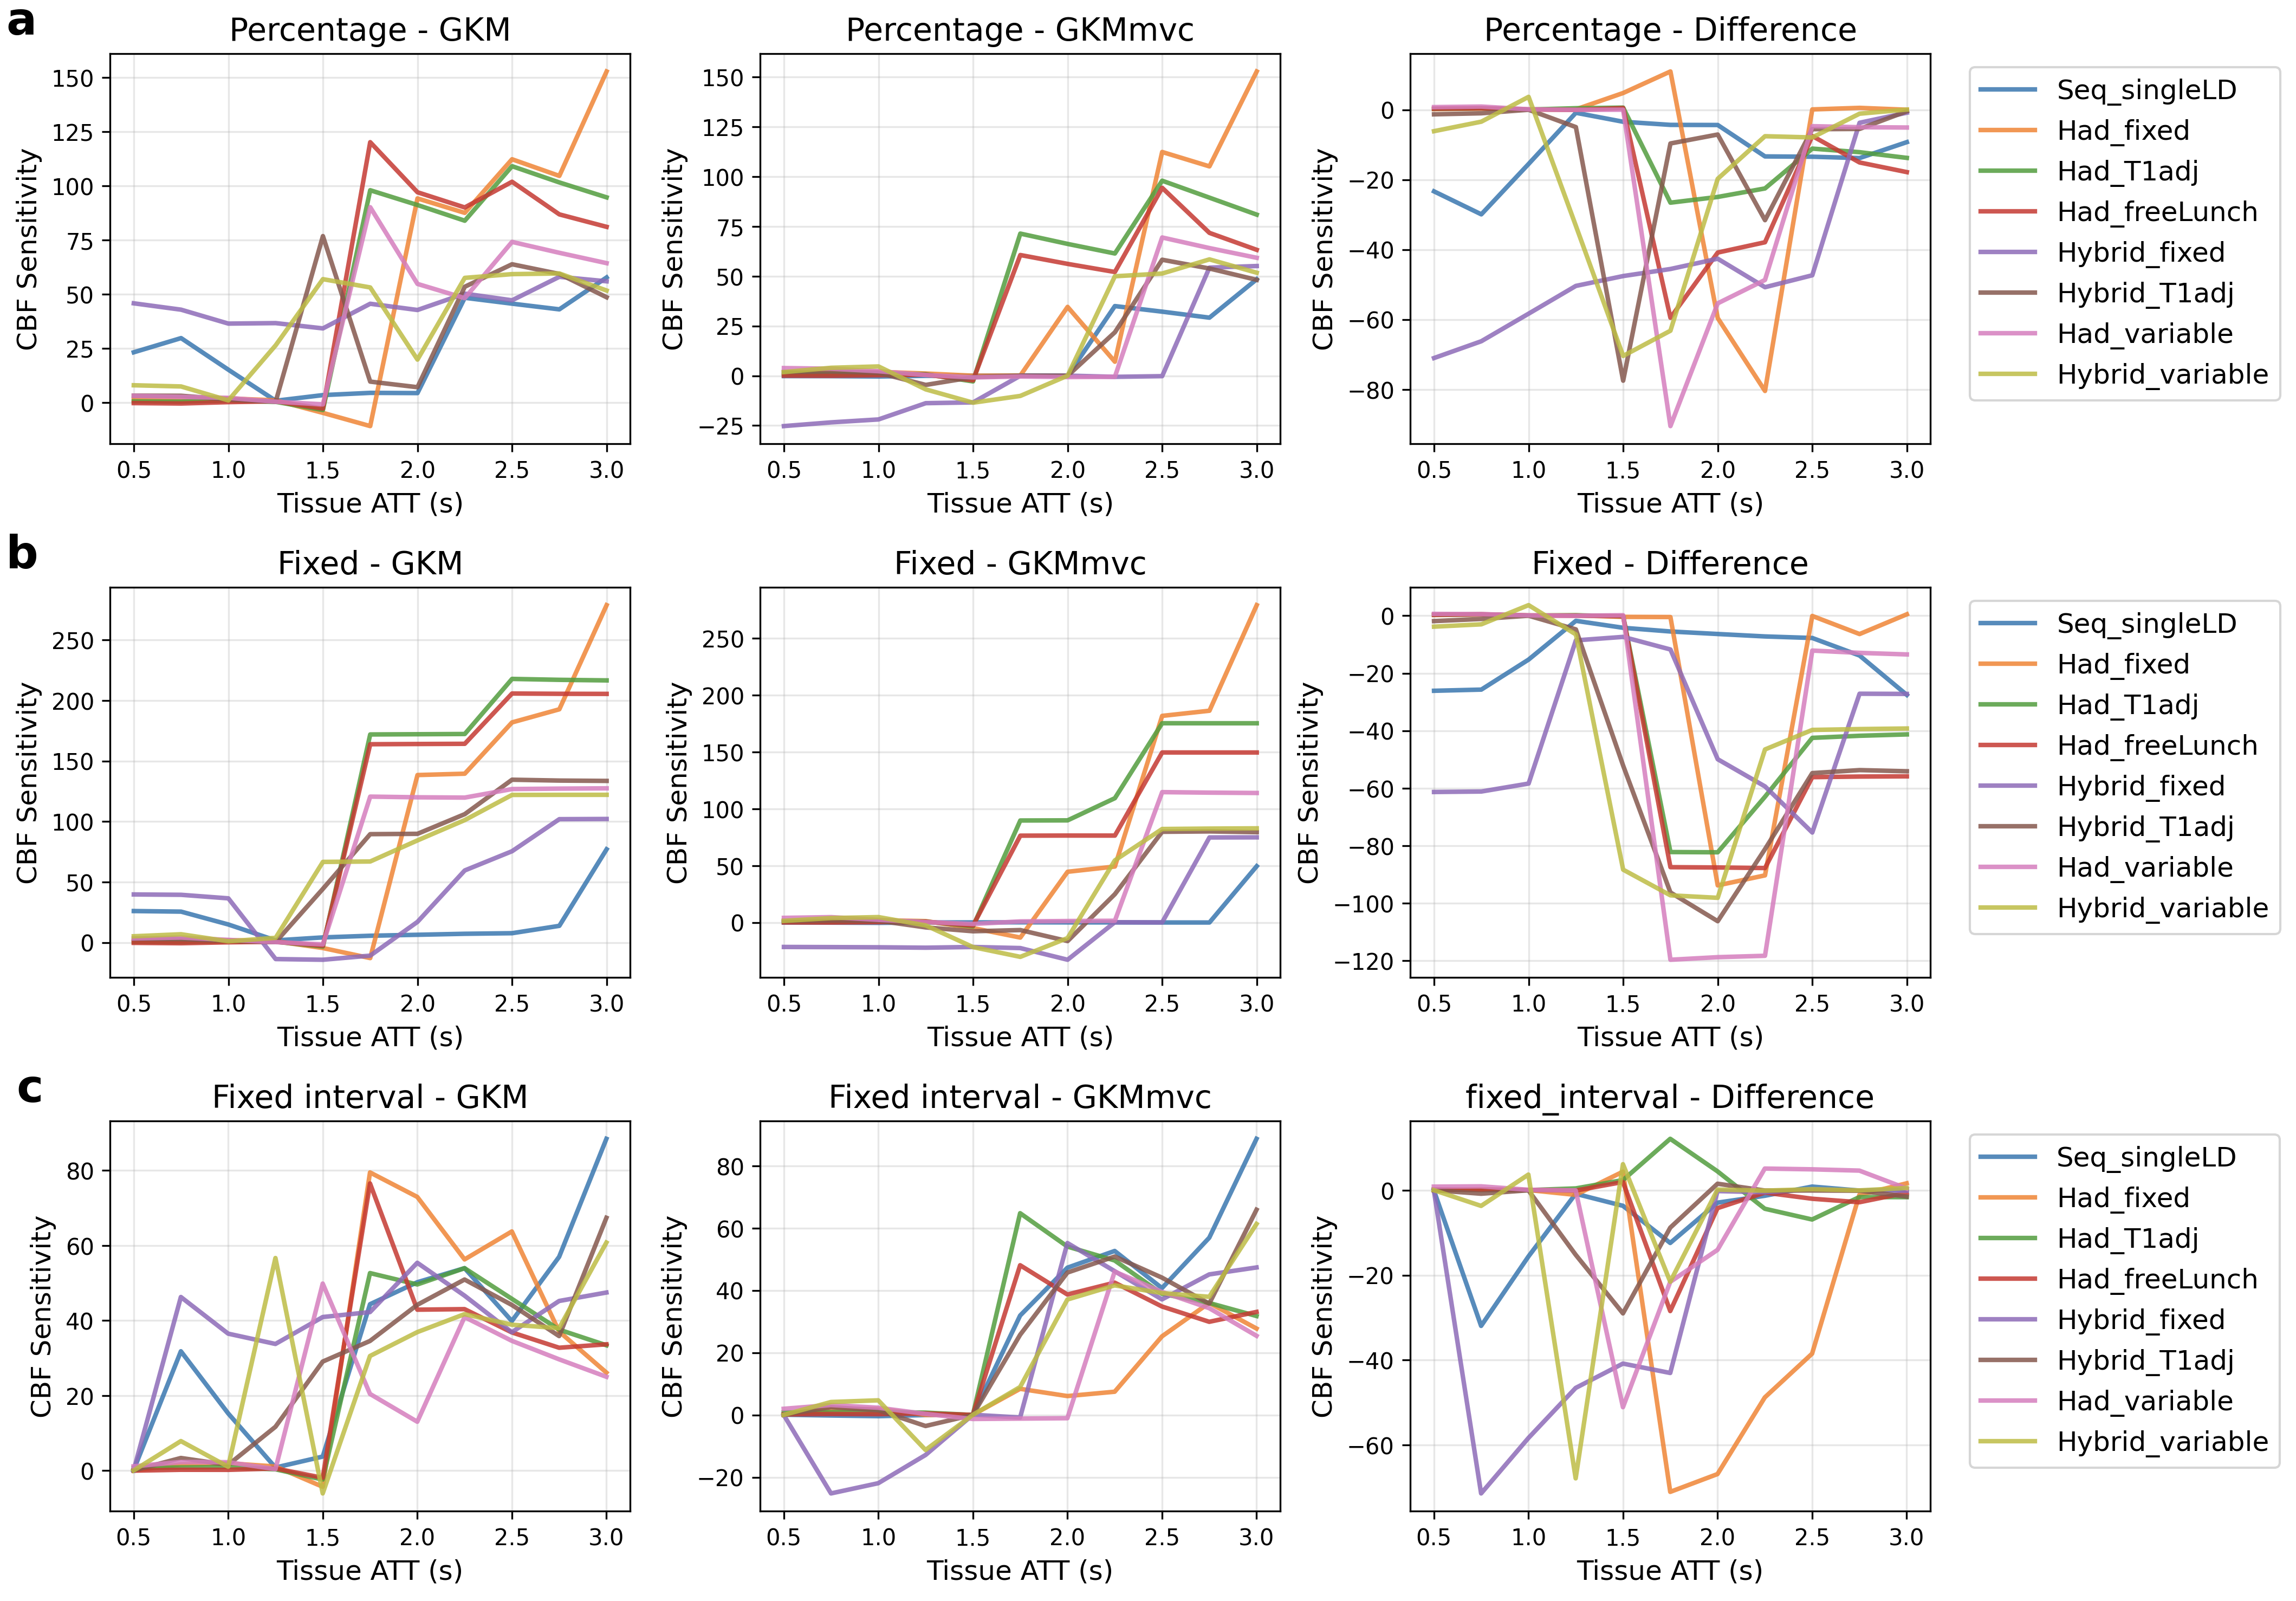
Figure 2a to 2h shows the CBF sensitivity maps for each protocol under the model GKM and GKMmvc and their difference maps (GKMmvc - GKM). The mean CBF sensitivity map is shown in Figure 2i as a measure of the average CBF estimation sensitivity to MVC in all tested protocols. Common features among all protocols could be observed: The general kinetic model had relatively low CBF sensitivity when tissue ATT was shorter than 1.5s (top left of the map). The extended model GKMmvc can reduce the CBF sensitivity to MVC under most conditions, indicated by the negative values on the difference maps. In particular, GKMmvc had the most reduction effect at 1.8s < ATTt < 2.3s. Under each protocol, both models had the global maximum CBF sensitivity at ATTt = 3.0s and ATTa = 0.0s (bottom left of the map). This is when the tissue signal and the macrovascular signal have the largest gap, and therefore macrovascular signal has the highest possibility of being recognised as tissue perfusion by the models, even being explicitly accounted for in GKMmvc. When both ATTt and ATTa were prolonged (bottom right of the map), GKMmvc did not have an apparent advantage over GKM.To compare the CBF sensitivity across protocols, three assumptions of the relationship of ATTt and ATTa were considered: percentage (ATTa = δ × ATTt), fixed (ATTa = δ[s]), and fixed interval (ATTa = ATTt - δ[s]). For simplicity we took δ = 0.5 in each scenario, which corresponds to the three red lines in Figure 2a. Figure 3 shows the CBF sensitivity for all protocols under each assumption as a function of tissue ATT. There were not consistent patterns across protocols using GKM. When fitted with GKMmvc, Hadamard-encoded protocols were nearly insensitive to MVC in the range of ATTt < 1.5s, whereas hybrid protocols may have negative CBF sensitivity values. In ‘percentage’ and ‘fixed’ types, hybrid protocols generally had lower CBF sensitivity than Hadamard-encoded protocols when ATTt > 2.0s, which is beyond the optimised ATTt range of all protocols. This is consistent with the results in the previous study3 which found Hybrid_T1adj to be the most accurate and robust CBF estimation protocol.
Conclusions
We have demonstrated that while time-encoded and multi-PLD pCASL protocols can be optimised for CBF accuracy, the use of the general kinetic model can still lead to high sensitivity to macrovascular contamination. By adding a macrovascular compartment in the model, the sensitivity to MVC was alleviated, particularly when 1.8s < ATTt < 2.3s. This indicates the extra step in modelling is beneficial to CBF estimation in the normal ATTt range. However, the extended model could not account for MVC when prolonged tissue ATT was present, specifically beyond the range for which these protocols had been optimised, especially when macrovascular ATT was short. We propose that the sensitivity map introduced here could be used to examine a protocol for possible MVC effects prior to scanning, or when interpreting results after data collection.Acknowledgements
This work received funding from the Engineering and Physical Sciences Research Council (EP/P012361/1). The Wellcome Centre for Integrative Neuroimaging is supported by core funding from the Wellcome Trust (203139/Z/16/Z).References
1. Woods, Joseph G., et al. "A general framework for optimizing arterial spin labeling MRI experiments." Magnetic resonance in medicine 81.4 (2019): 2474-2488.
2. Zhang, Xin (Logan), et al. "Examination of optimised PLD protocols for pCASL: accounting for dispersion and macrovascular contamination over a prolonged ATT range." In Proceedings of the Annual ISMRM & SMRT Virtual Conference and Exhibition (2020).
3. Woods, Joseph G., et al. "Designing and Comparing Optimised Pseudo-Continuous Arterial Spin Labelling Protocols for Measurement of Cerebral Blood Flow." bioRxiv (2020).
4. Buxton, Richard B., et al. "A general kinetic model for quantitative perfusion imaging with arterial spin labeling." Magnetic resonance in medicine 40.3 (1998): 383-396.
5. Chappell, Michael A., et al. "Separation of macrovascular signal in multi‐inversion time arterial spin labelling MRI." Magnetic resonance in medicine 63.5 (2010): 1357-1365.
6. Mehta, Rutej R., and Michael A. Chappell. "Quantification of errors in cerebral blood flow measurements due to dispersion in arterial spin labelling." 2015 37th Annual International Conference of the IEEE Engineering in Medicine and Biology Society (EMBC). IEEE, 2015.
7. Chappell, Michael A., et al. "Variational Bayesian inference for a nonlinear forward model." IEEE Transactions on Signal Processing 57.1 (2008): 223-236.
Figures