2716
Investigation of angiographic shine-through in time-encoded pCASL
Lena Vaclavu1, Dilek Betül Arslan2, Lydiane Hirschler1, Carles Falcon3,4, Esin Ozturk-Isik2, Juan Domingo Gispert3,4, Paula Montesinos5, Kim van de Ven6, and Matthias JP van Osch1
1Department of Radiology, C.J. Gorter Center for High Field MRI, Leiden University Medical Center, Leiden, Netherlands, 2Biomedical Engineering Institute, Boğaziçi University, Istanbul, Turkey, 3BarcelonaBeta Brain Research Center (BBRC), Pasqual Maragall Foundation, Barcelona, Spain, 4CIBER-BBN, Madrid, Spain, 5Philips Healthcare Iberia, Madrid, Spain, 6Philips Healthcare, Best, Netherlands
1Department of Radiology, C.J. Gorter Center for High Field MRI, Leiden University Medical Center, Leiden, Netherlands, 2Biomedical Engineering Institute, Boğaziçi University, Istanbul, Turkey, 3BarcelonaBeta Brain Research Center (BBRC), Pasqual Maragall Foundation, Barcelona, Spain, 4CIBER-BBN, Madrid, Spain, 5Philips Healthcare Iberia, Madrid, Spain, 6Philips Healthcare, Best, Netherlands
Synopsis
Physiologic fluctuations can lead to the appearance of artefactual angiographic signal in the perfusion image of time-encoded pCASL previously dubbed “shine-through effect”. The aim of this study was to investigate the potential mechanisms inducing this artefact by characterizing the noise in time-encoded pCASL signal from individual Hadamard columns and rows as well as without labeling. We observed higher temporal standard deviation in the arteries compared to gray matter, and found that the shine-through effect was present even without labeling, suggesting that it is caused by the selective background suppression pulse applied close to acquisition time and the associated fresh inflow.
Introduction
Time-encoded arterial spin labeling (te-pCASL) is a multi-time point perfusion technique in which temporal information is encoded according to, for example, a Hadamard matrix1. The decoding process ensures that for each post-label delay (PLD), signals from all other PLDs cancel out. In practice however, physiologic fluctuations that are present in vessels, lead to angiographic signal in the perfusion image, previously dubbed “shine-through effect”2 (Figure 1). This artefact may affect clinical interpretation, since it can be mistaken for a transit delay artefact indicative of large vessel pathology and delayed arrival of label3. The exact cause of the shine-through effect is unknown, but theoretically could be caused by, 1) decoding errors of the high intensity angiographic signal, 2) slight mismatches between the Hadamard-encoded bolus due to cardiac pulsations, 3) imperfect interleaving of control and label for certain sub-boli, or 4) artefacts due to the necessity for selective background suppression (BGS)4,5 pulses applied during the labeling6.The aim of this study was to investigate the origin of the shine-through effect in te-pCASL.
Methods
Imaging: All images were acquired at 3T (Ingenia CX/Achieva, Philips, NL) using a 32-channel head-coil. Thirty volunteers were initially scanned for both standard pCASL and te-pCASL using a 2D GE-EPI sequence with SENSE=2.5, FOV=220x220x120 mm3, resolution=2.3x2.3x6 mm3 and flip angle=90°. Standard pCASL|te-pCASL parameters were: 30|8 averages, TR=4600|4127 ms, TE=12|10 ms, label duration=1800|1800/600/400/300/200/150/150 ms, PLD=2000|200 ms, duration=5:07|5:52 minutes. For BGS after labeling, two global hyperbolic secant inversion pulses were used. For BGS during labeling, two selective FOCI inversion pulses were used. Optimal BGS-times were determined automatically by the scanner console.Additional experiments: To study the effect of individual blocks, the full Hadamard scheme was acquired as normal, except that radiofrequency (RF) pulses were only enabled for a single block at a time (Figure 2). Global and selective BGS pulses were compared while the RF of the pCASL labeling was disabled to isolate the effect of the BGS-pulses. Finally, a single-BGS pulse was applied at varying times (2800/1800/1300/300ms) before the readout.
Analysis: The contribution of individual Hadamard lines to noise (temporal standard deviation [tStdv]) was investigated in the fully acquired Hadamard matrix in gray matter (GM) and arterial regions-of-interest. GM was defined by T1 tissue segmentation, and an arterial region-of-interest was defined by the average signal of the three shortest PLDs which consist mainly of angiographic signal. For the additional experiments, tStdv was calculated over the ASL (subtracted) signal when labeling was enabled, or over the raw unsubtracted images when labeling was disabled. .
Results
The shine-through artefact was observed in the subtracted ASL images (Figure 1a), but because it can be either positive or negative, the tStdv of the ASL signal is more informative to visualize and quantify the effect (Figure 1b). In 30 volunteers, (mean±std age: 55±16y, range: 28-75y, 50% male), compared to standard pCASL, GM tStdv was the same for all Hadamard lines (Figure 3a). However, arterial tStdv was significantly higher for all Hadamard lines except for the first line consisting of only label condition (Figure 3b). Since the images with increased tStdv were those in which label and control conditions switch according to the Hadamard scheme, we hypothesized that this higher tStdv could be caused by mismatches between Hadamard lines (e.g. due to small differences in the distance travelled by the encoded bolus into the vascular tree). However, when labeling individual blocks only, we found that the artefact was also visible in the disabled blocks (Figure 4), and to our surprise, also in the experiment without any labeling at all (Figure 5a). Finally, lower tStdv was observed with global versus selective BGS-pulses (without any labeling, Figure 5b), supporting a potential mechanism of fresh inflow of untouched spins from below the edge of the BGS-pulse. The timing of the single-BGS pulses had a small influence on tStdv depending on its proximity in time, to the readout, with selective pulses leading to higher tStdv (Figure 5c).Discussion
Our results indicate that the shine-through effect is associated with increased signal fluctuations in arterial vessels. We observed that the shine-through effect is not dependent on the Hadamard labeling procedure, since it was also visible in absence of RF labeling. One major difference between standard and te-pCASL is that BGS is applied globally during the PLD in standard pCASL, and selectively during the labeling in te-pCASL (because the PLD is too short for optimal BGS). This creates a difference in the suppression of spins below the labeling plane such that fresh inflowing blood will result in enhancement of arterial fluctuations when selective BGS is used. This hypothesis was supported by our single-BGS experiments showing a difference between the selective and global pulse placed between 1300 and 1800 ms before the readout. An explanation for this could be that global BGS inverts all spins within the range of the transmit coil, while selective BGS inverts only the spins above the middle of the labeling plane, creating a transition zone of inverted-uninverted spins flowing into the large vessels and leading to increased tStdv.Conclusion
We observed increased signal fluctuations in arteries in te-pACSL compared to standard pCASL, which was not related to the Hadamard-encoding but due to selective background suppression.Acknowledgements
This research was supported by the EU under the Horizon2020 program (project: CDS-QUAMRI), and by Philips Healthcare.References
- Günther M. Highly efficient accelerated acquisition of perfusion inflow series by Cycled Arterial Spin Labeling. Proceedings of the 15th Annual Meeting of ISMRM. 2007, p. 380 of ISMRM. Vol. 15. Berlin, Germany, 2007
- Suzuki Y, Helle M, Koken P, et al. Simultaneous acquisition of perfusion image and dynamic MR angiography using time‐encoded pseudo‐continuous ASL. Magn. Reson. Med. 2018;79(5):2676-2684.
- Di Napoli A, Cheng SF, Gregson J, et al. Arterial Spin Labeling MRI in Carotid Stenosis: Arterial Transit Artifacts May Predict Symptoms. Radiology. 2020;297:652-660.
- Mani S, Pauly J, Conolly S, et al. Background suppression with multiple inversion recovery nulling: applications to projective angiography. Magn. Reson. Med. 1997;37: 898–905.
- Maleki N, Dai W & Alsop DC. Optimization of background suppression for arterial spin labeling perfusion imaging. Magma 2012;25: 127–133.
- Dai W, Robson PM, Shankaranarayanan A, et al. Benefits of Interleaved Continuous Labeling and Background Suppression. Proceedings of the 18th Annual Meeting of ISMRM. 2010, p. 1748
Figures
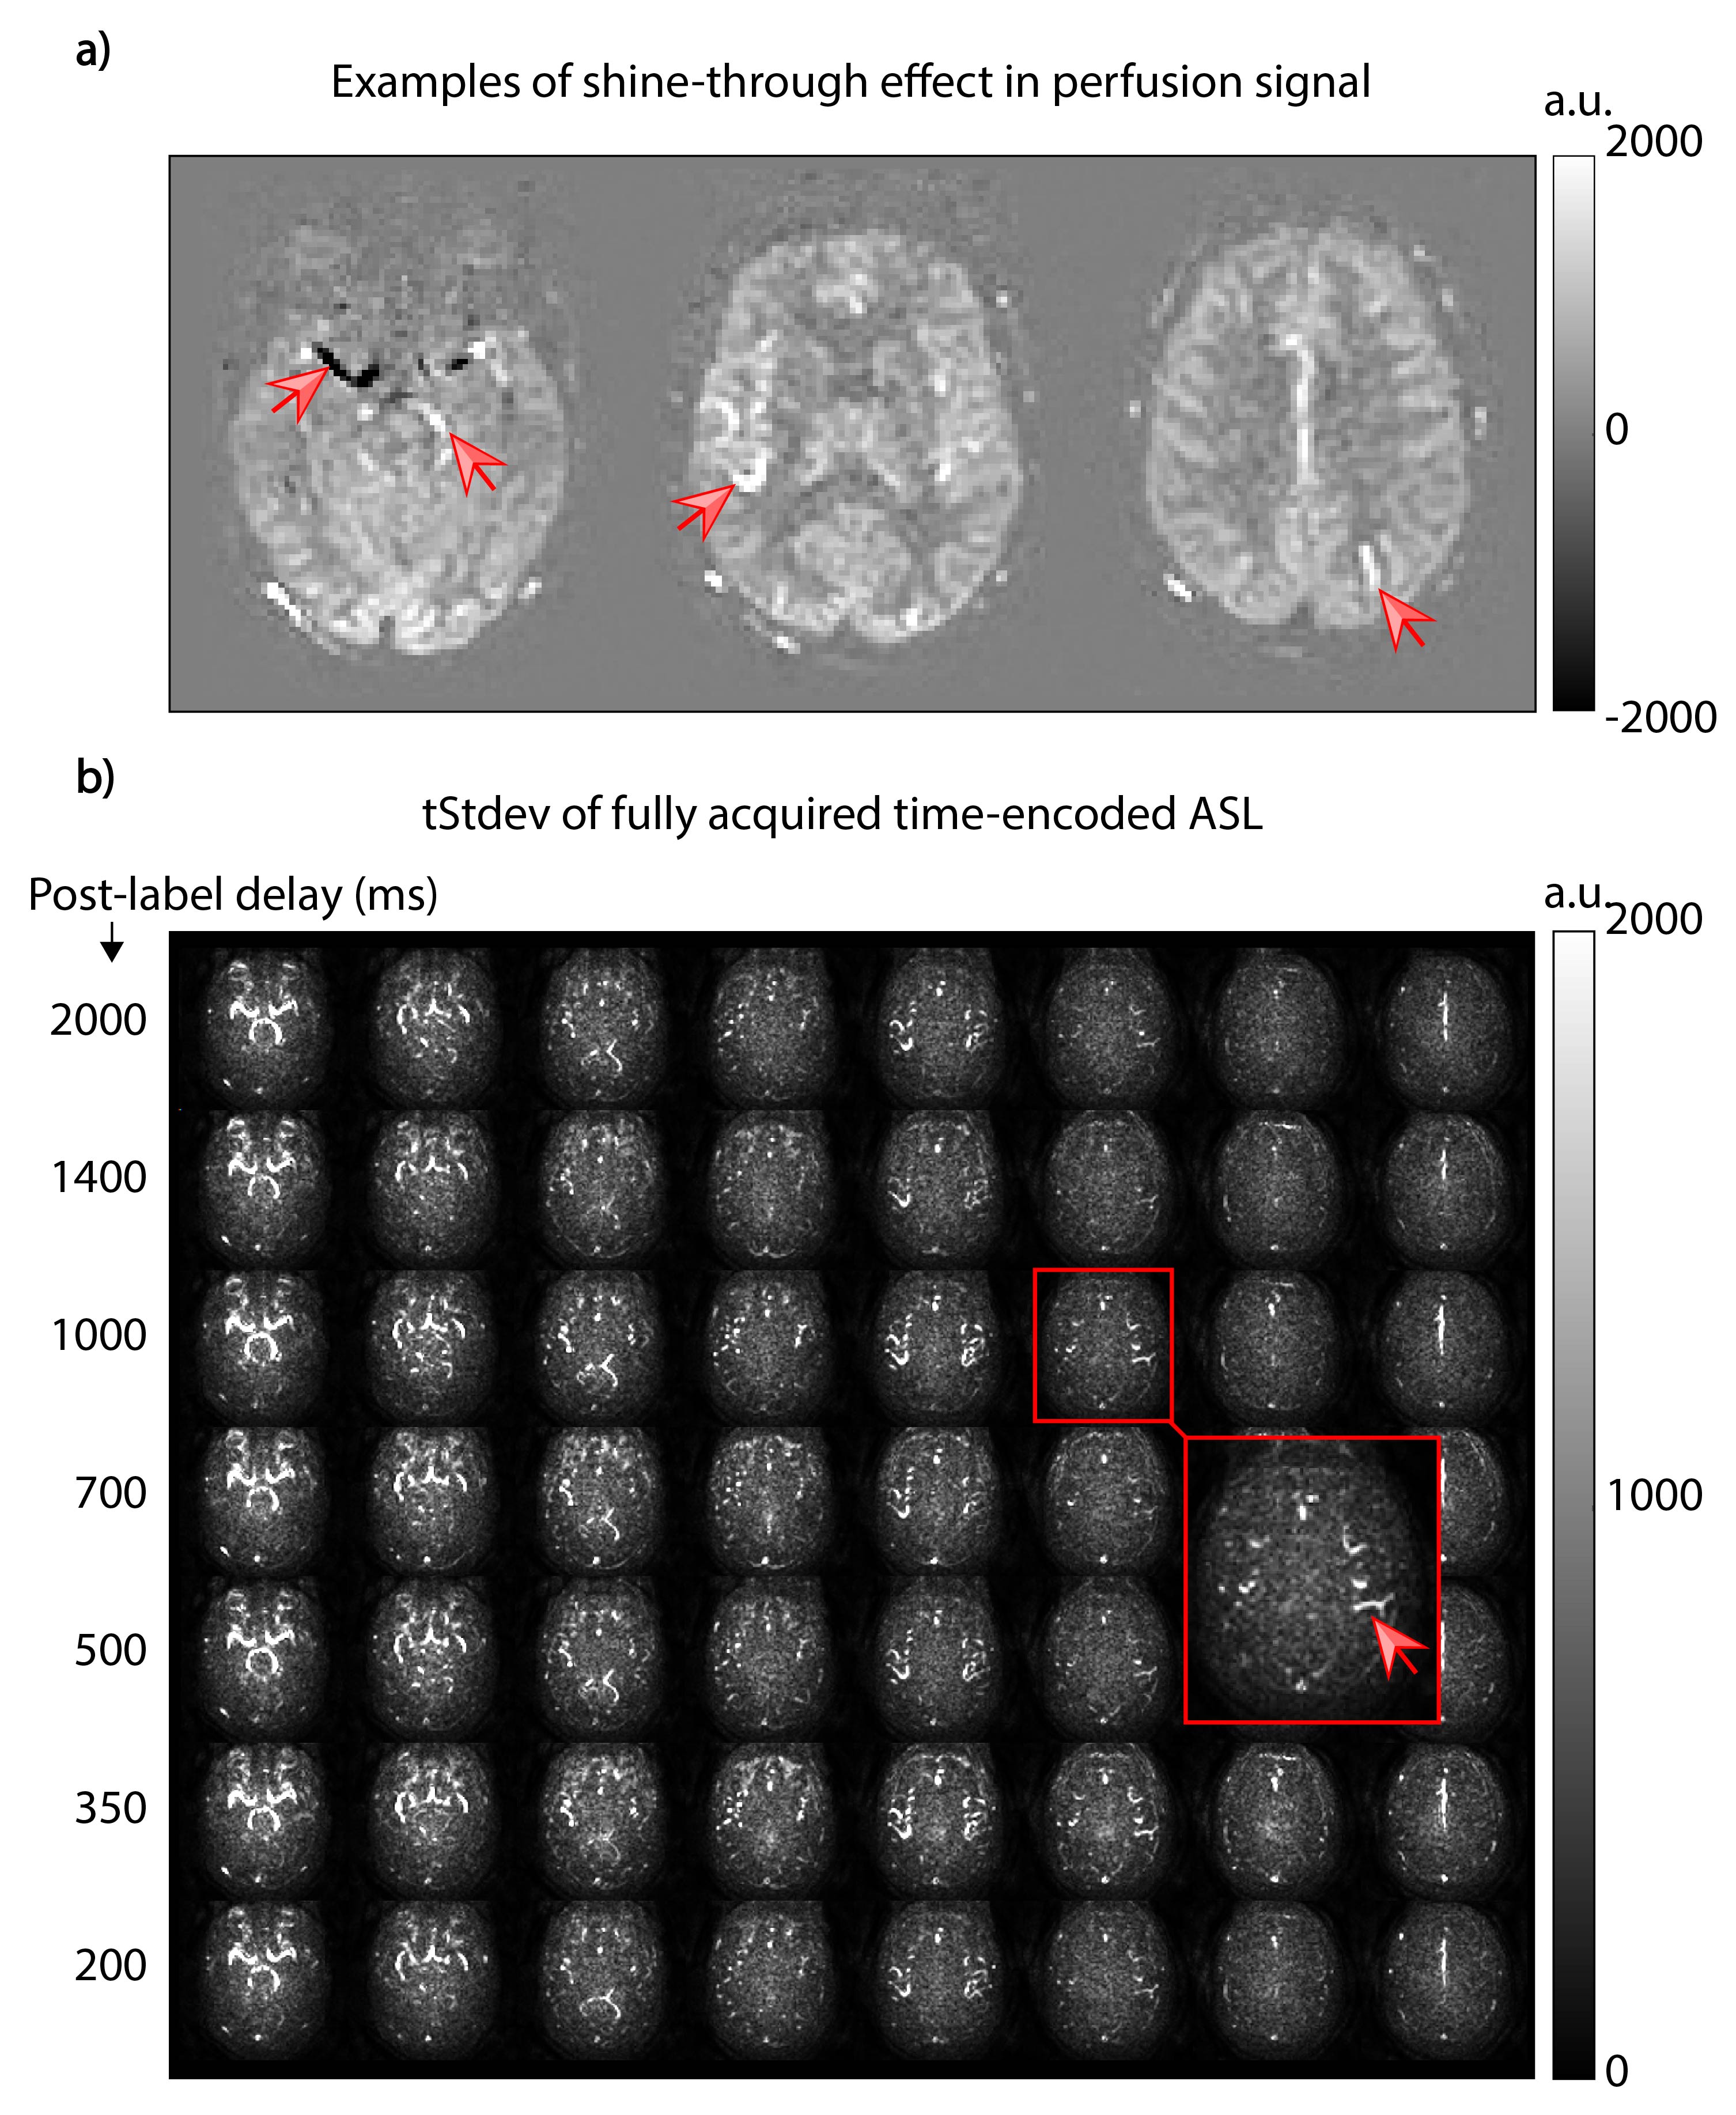
Figure 1. a) An example of the shine-through effect in a
healthy volunteer seen in the perfusion block of a fully acquired time-encoded
pCASL (te-pCASL) dataset noticeable as negative signal in the large arteries
and/or positive signal in higher slices. b) The temporal standard deviation
(tStdv) of the same dataset shows that the effect (high tStdv in vessels) is
present in all post-label-delays (PLDs) and that tStdv is an insightful measure
of the effect.
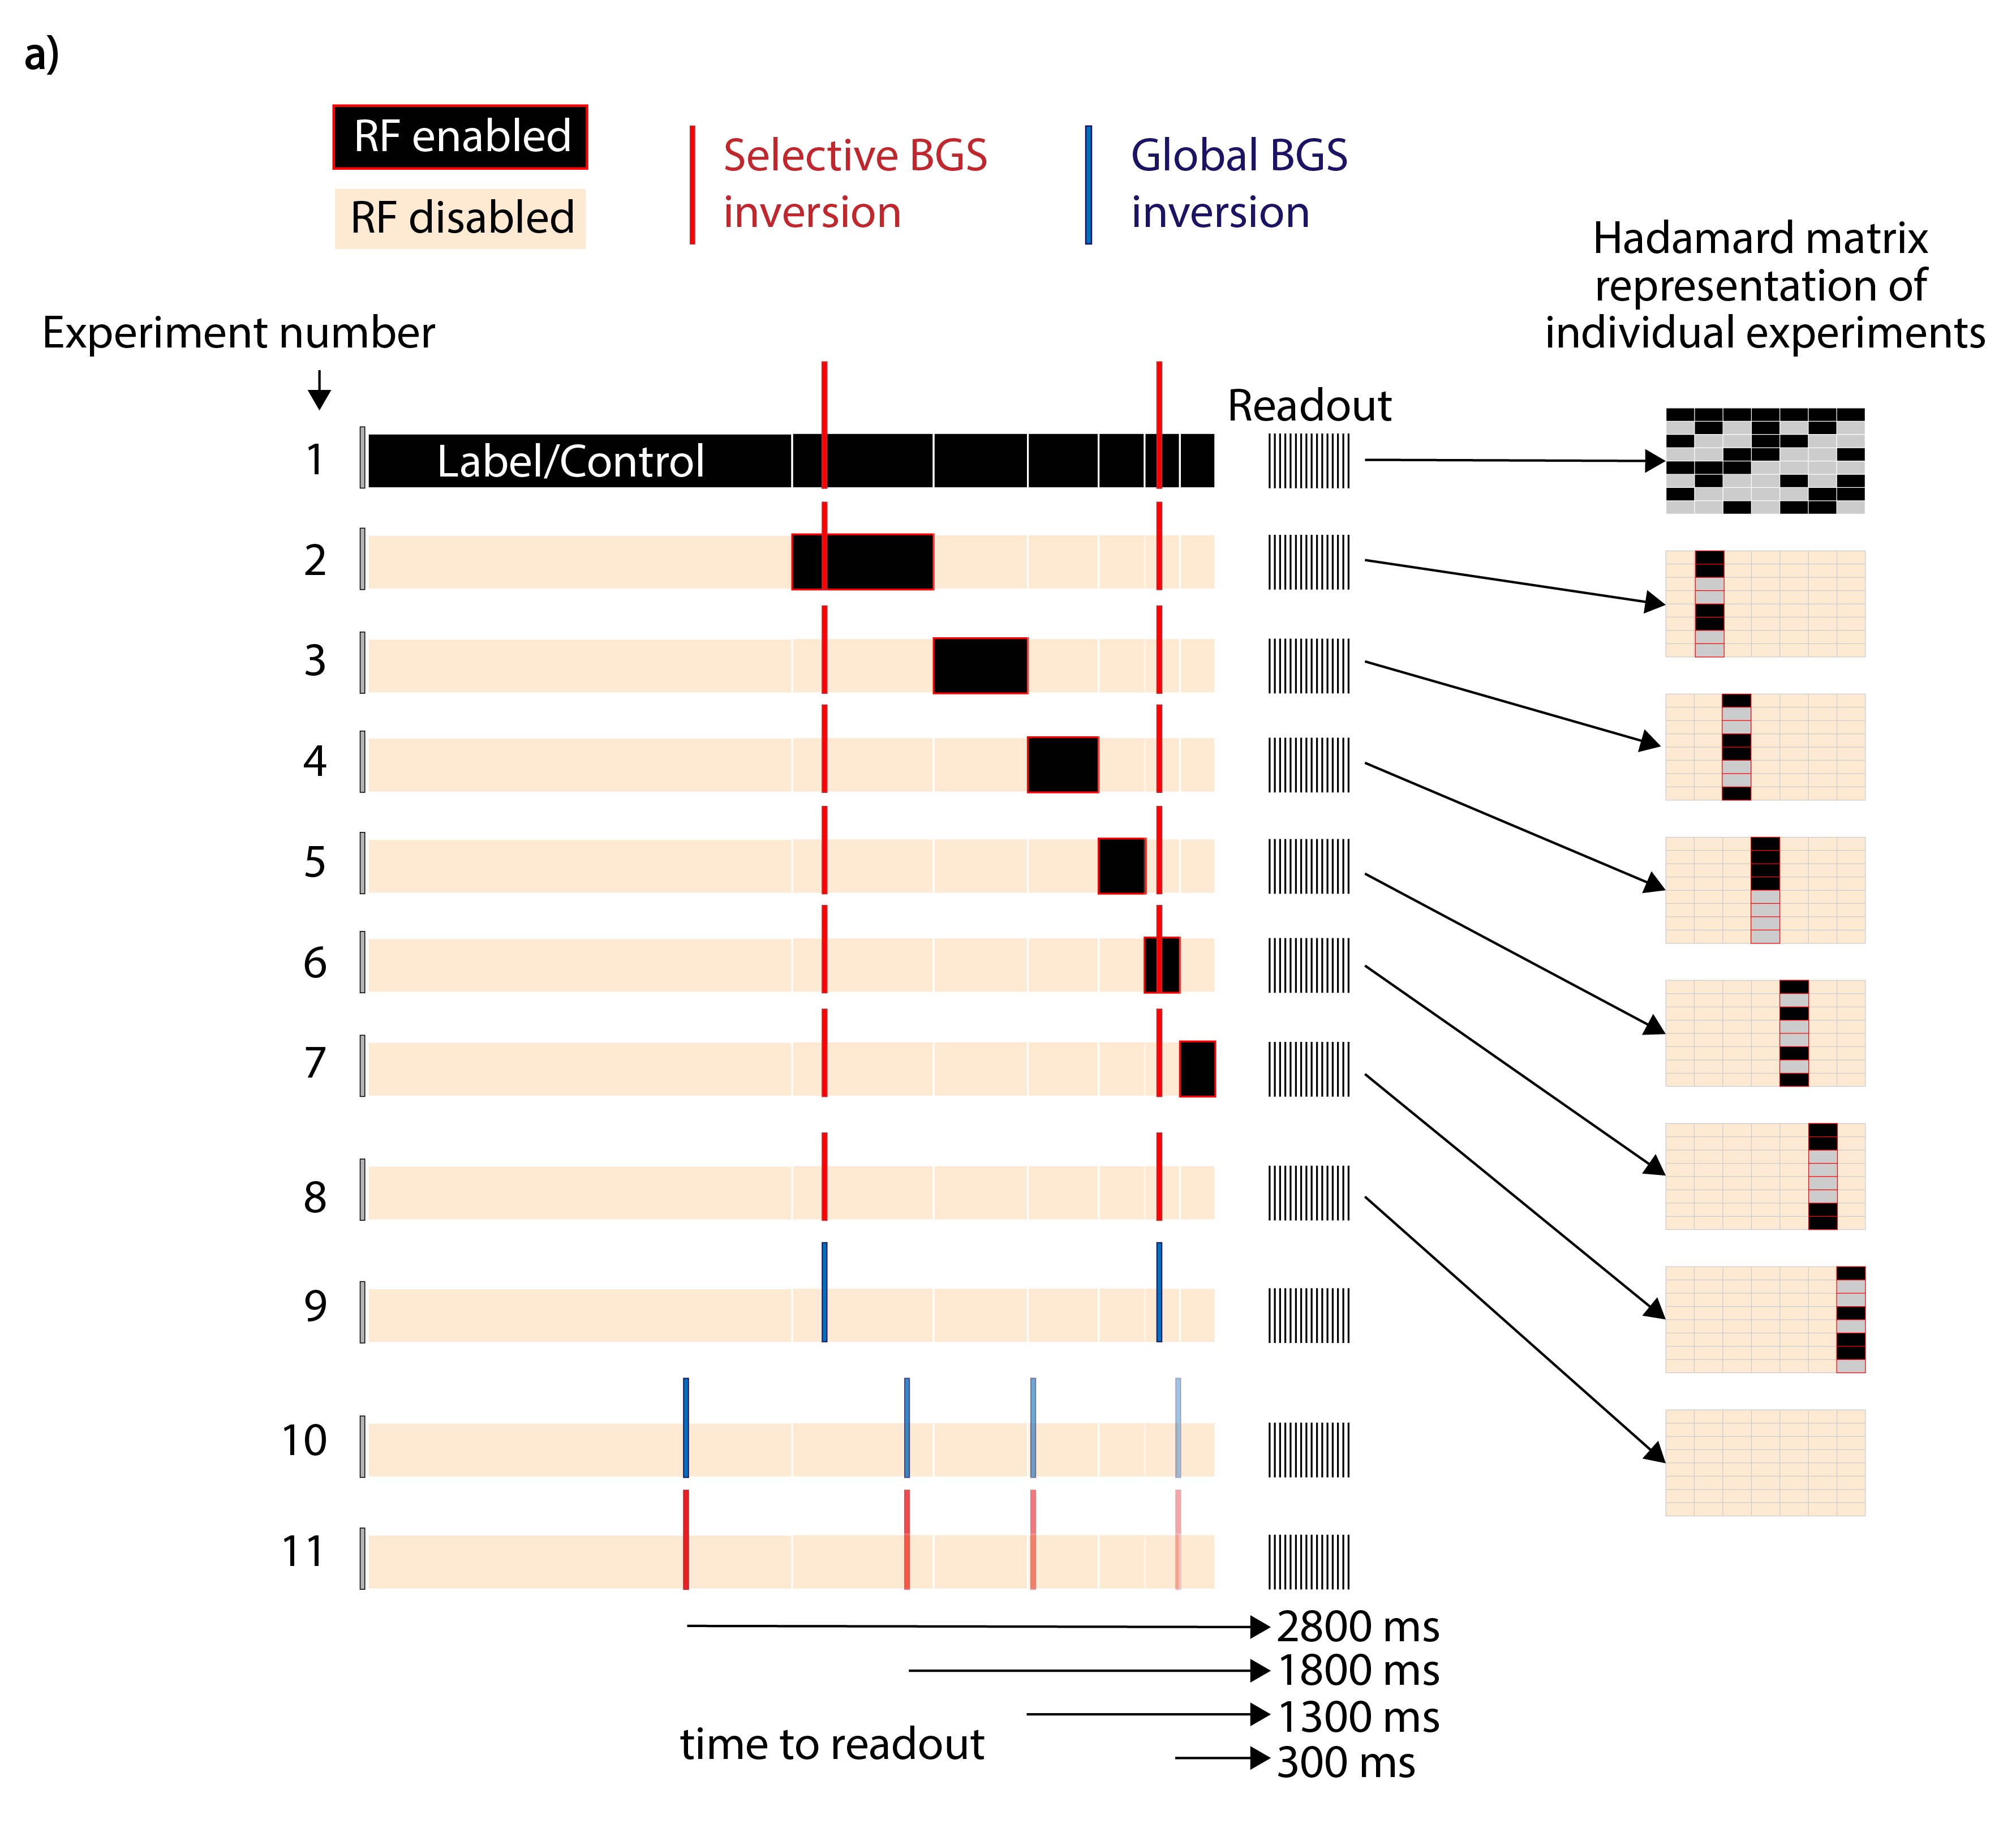
Figure 2. Individual experiments (each scan
duration is equal to a fully acquired scan) of time-encoded pCASL in which the
radiofrequency (RF) was switched off for all Hadamard blocks except a single
one (2-7), as shown on the right in Hadamard matrix form. The background
suppression type (global or selective) was also investigated in the experiment
without any labeling (8-9). And the time to image readout of a single BGS pulse
was also investigated for global and selective BGS pulses (10-11).
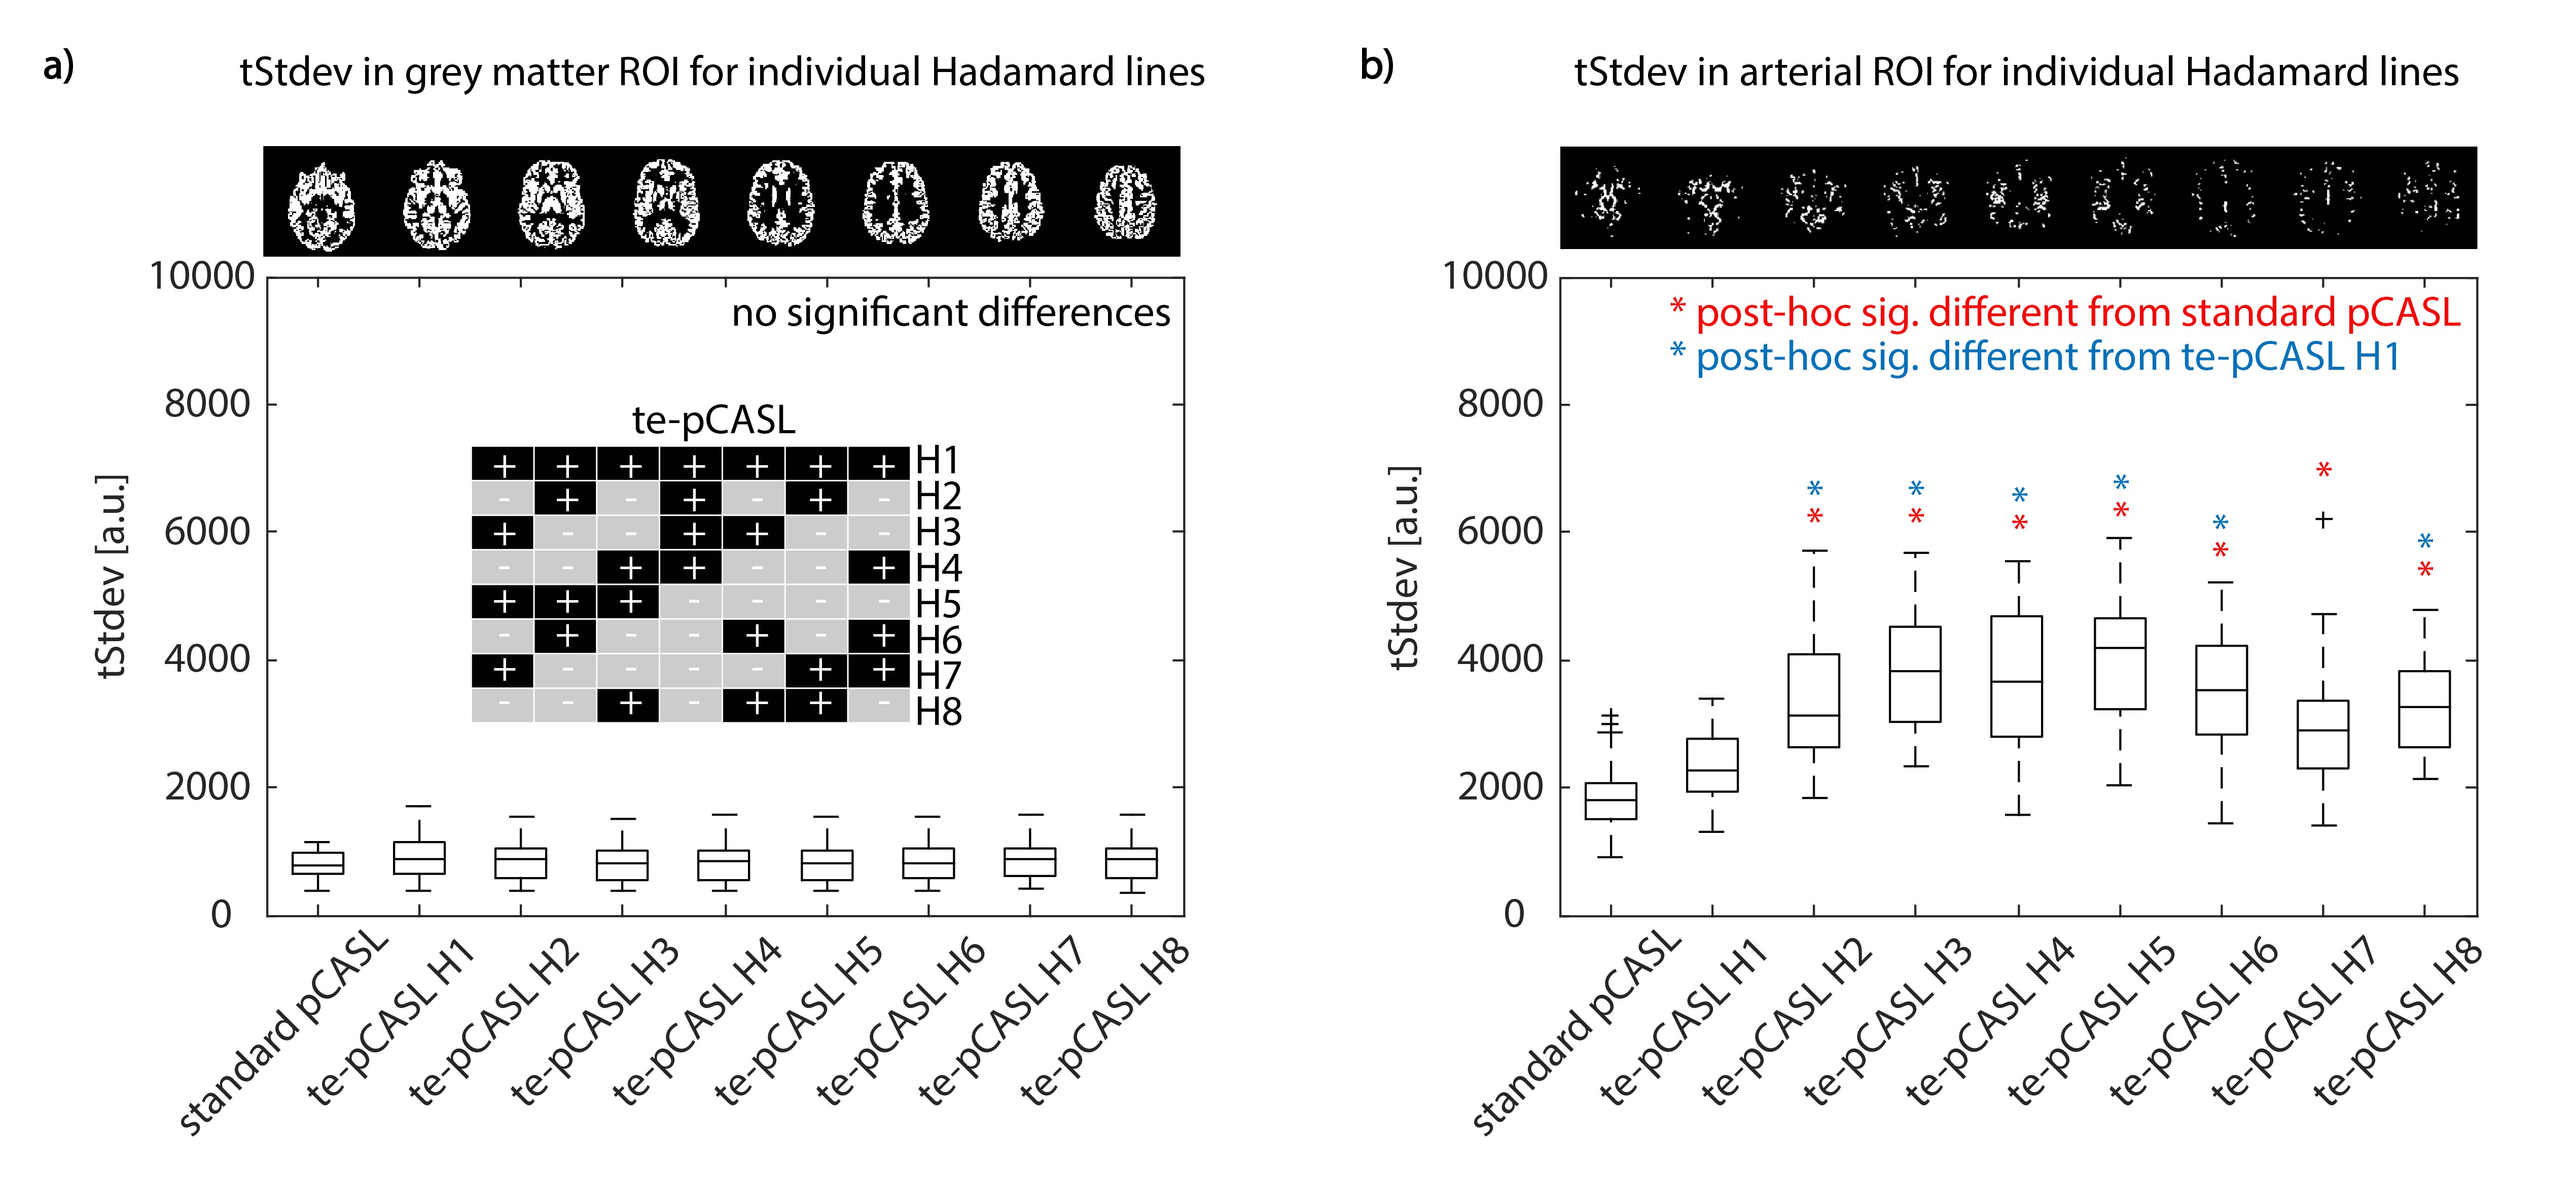
Figure 3. a) Compared
to standard single-PLD pCASL, the noise (tStdv) contributed by individual
Hadamard lines in te-pCASL was similar in the gray matter region-of-interest
(ROI) (n=30, ANOVA =ns). b) compared to standard single-PLD pCASL, the
noise (tStdv) contributed by individual Hadamard lines in te-pCASL was
significantly higher in the arteries (n=30, ANOVA p<0.001).
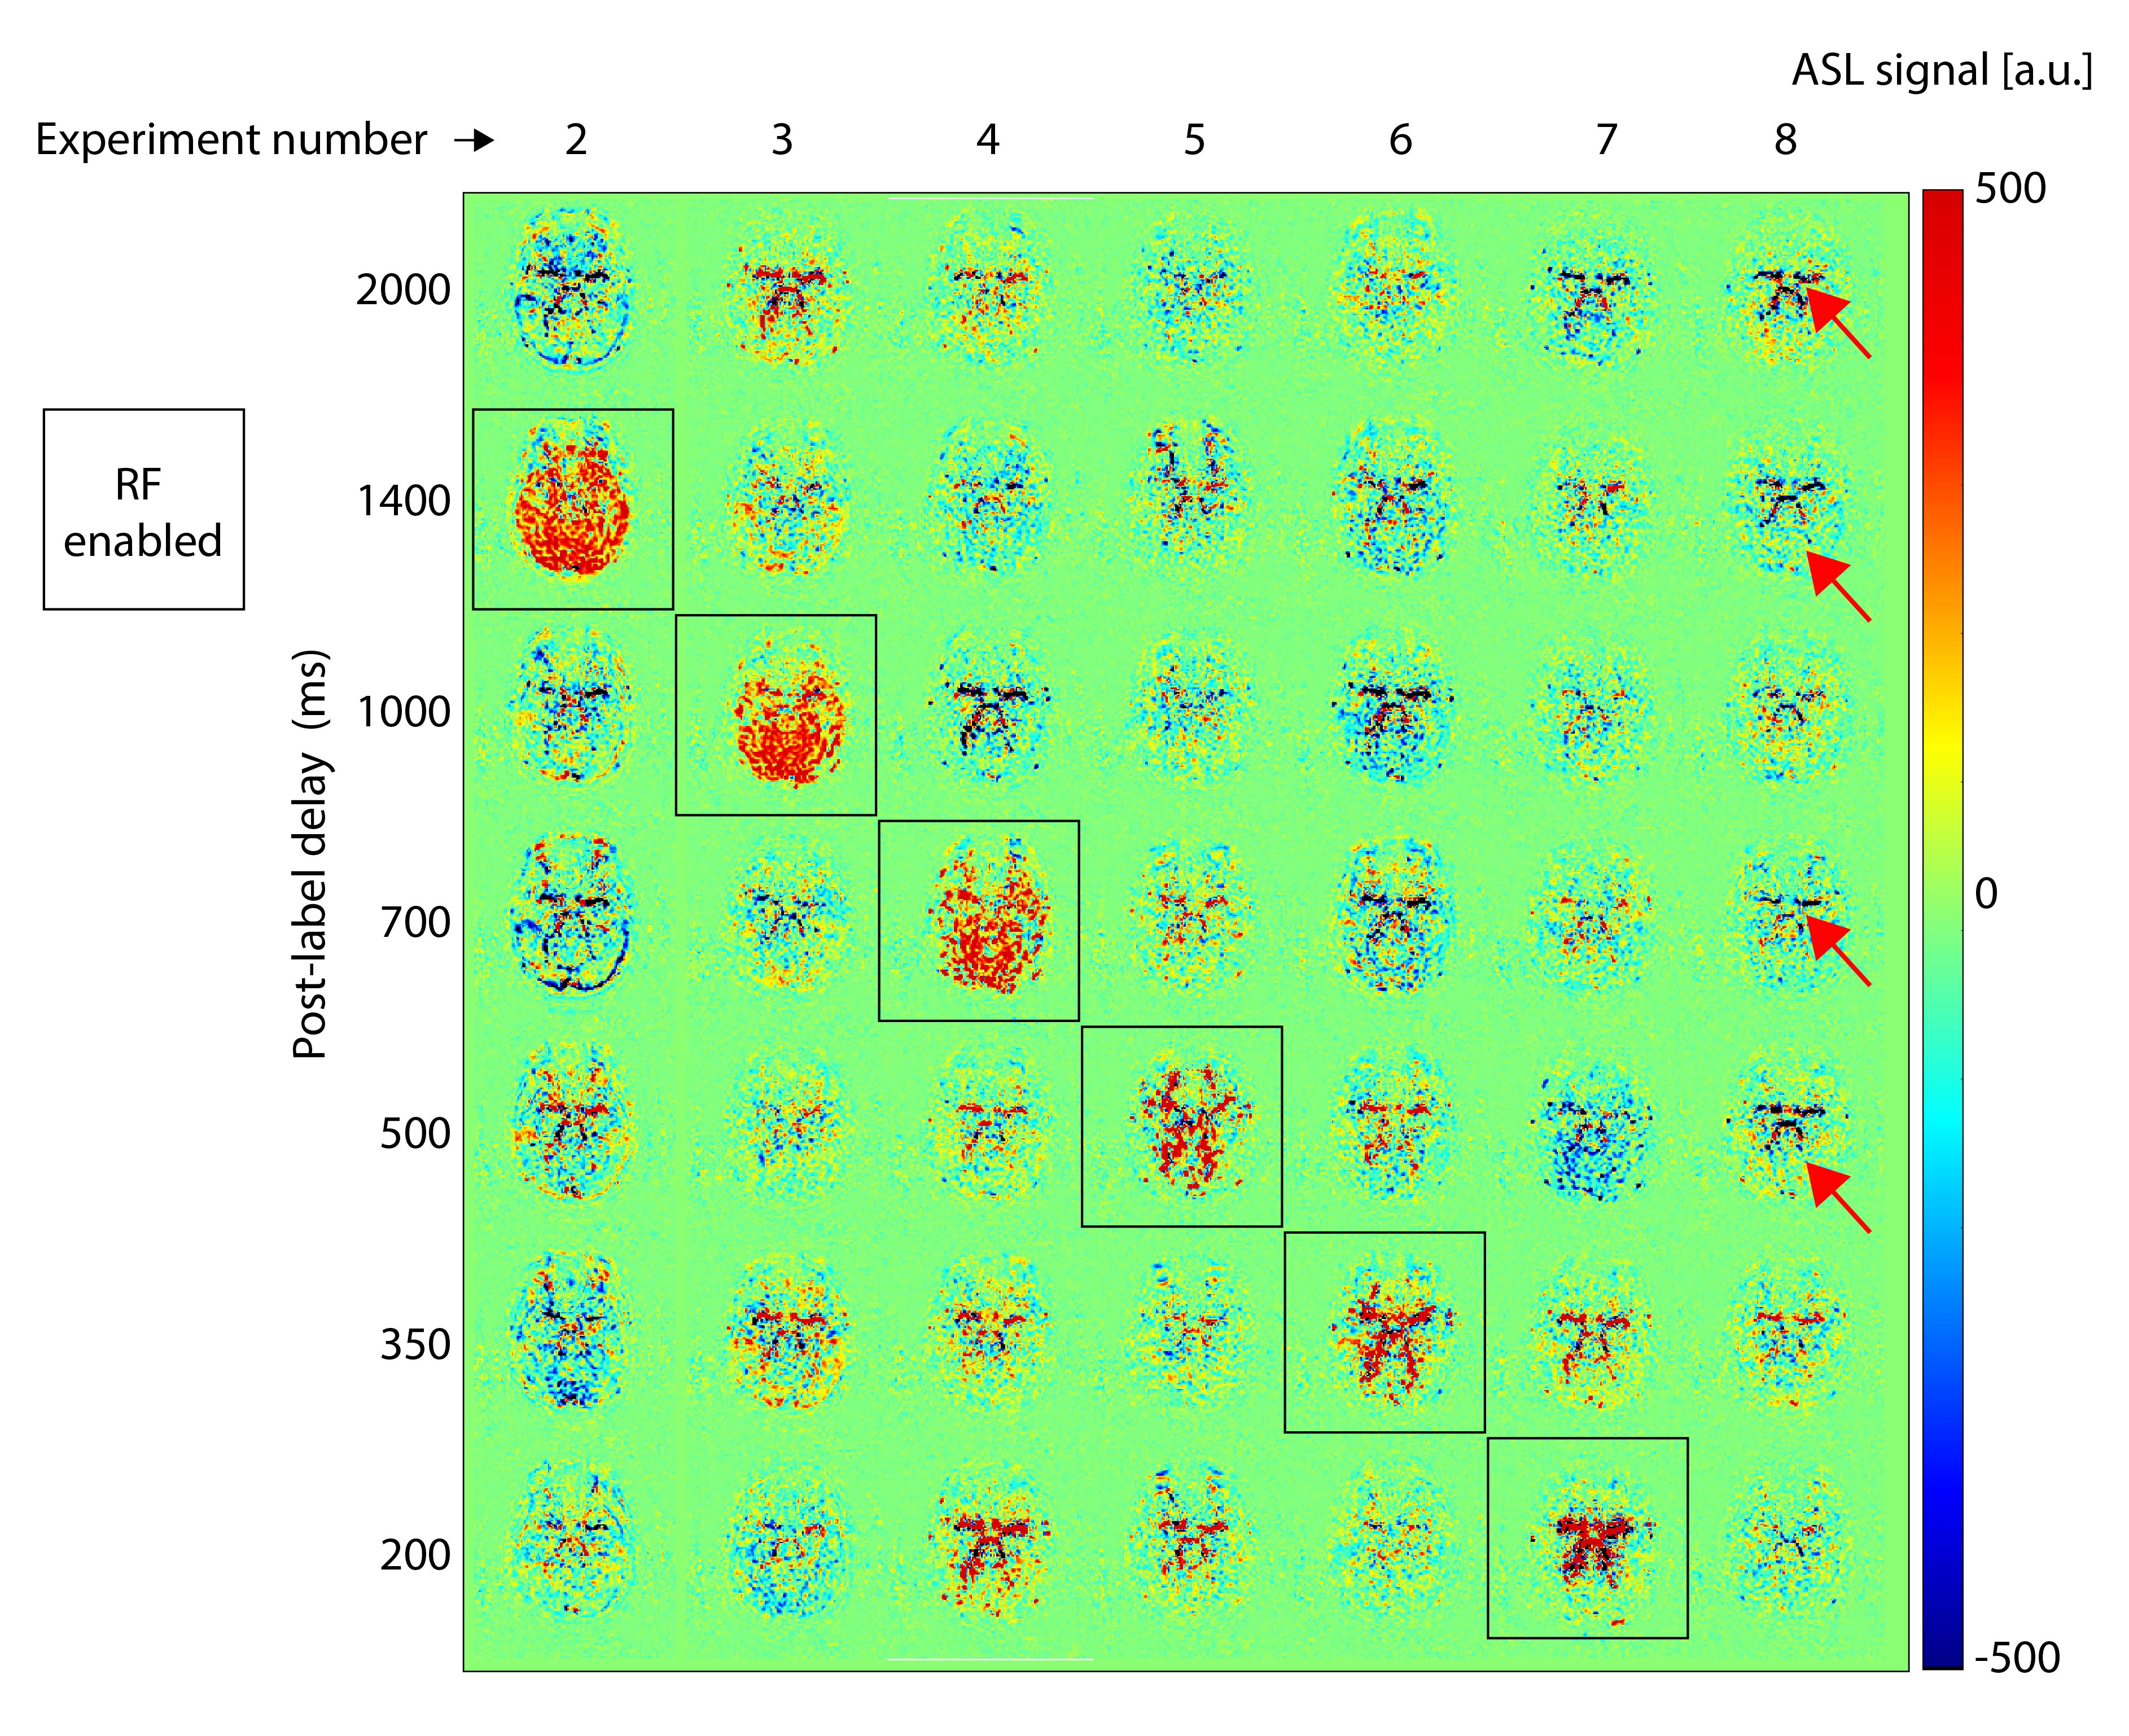
Figure 4. ASL (subtracted) signal is shown for a single
slice low in the brain, for the seven individual experiments in which RF
(labeling) was enabled for single blocks only (columns). The separation of the
individual blocks in each experiment can be seen in the black squares which
have positive ASL signal. We observed that the shine-through artefact (red
arrows) was visible in the disabled blocks, (negative or positive
signal), and surprisingly, also in the experiment without any labeling at all
(last column, experiment #8). See Figure 1 for explanation of the experiment
numbers.
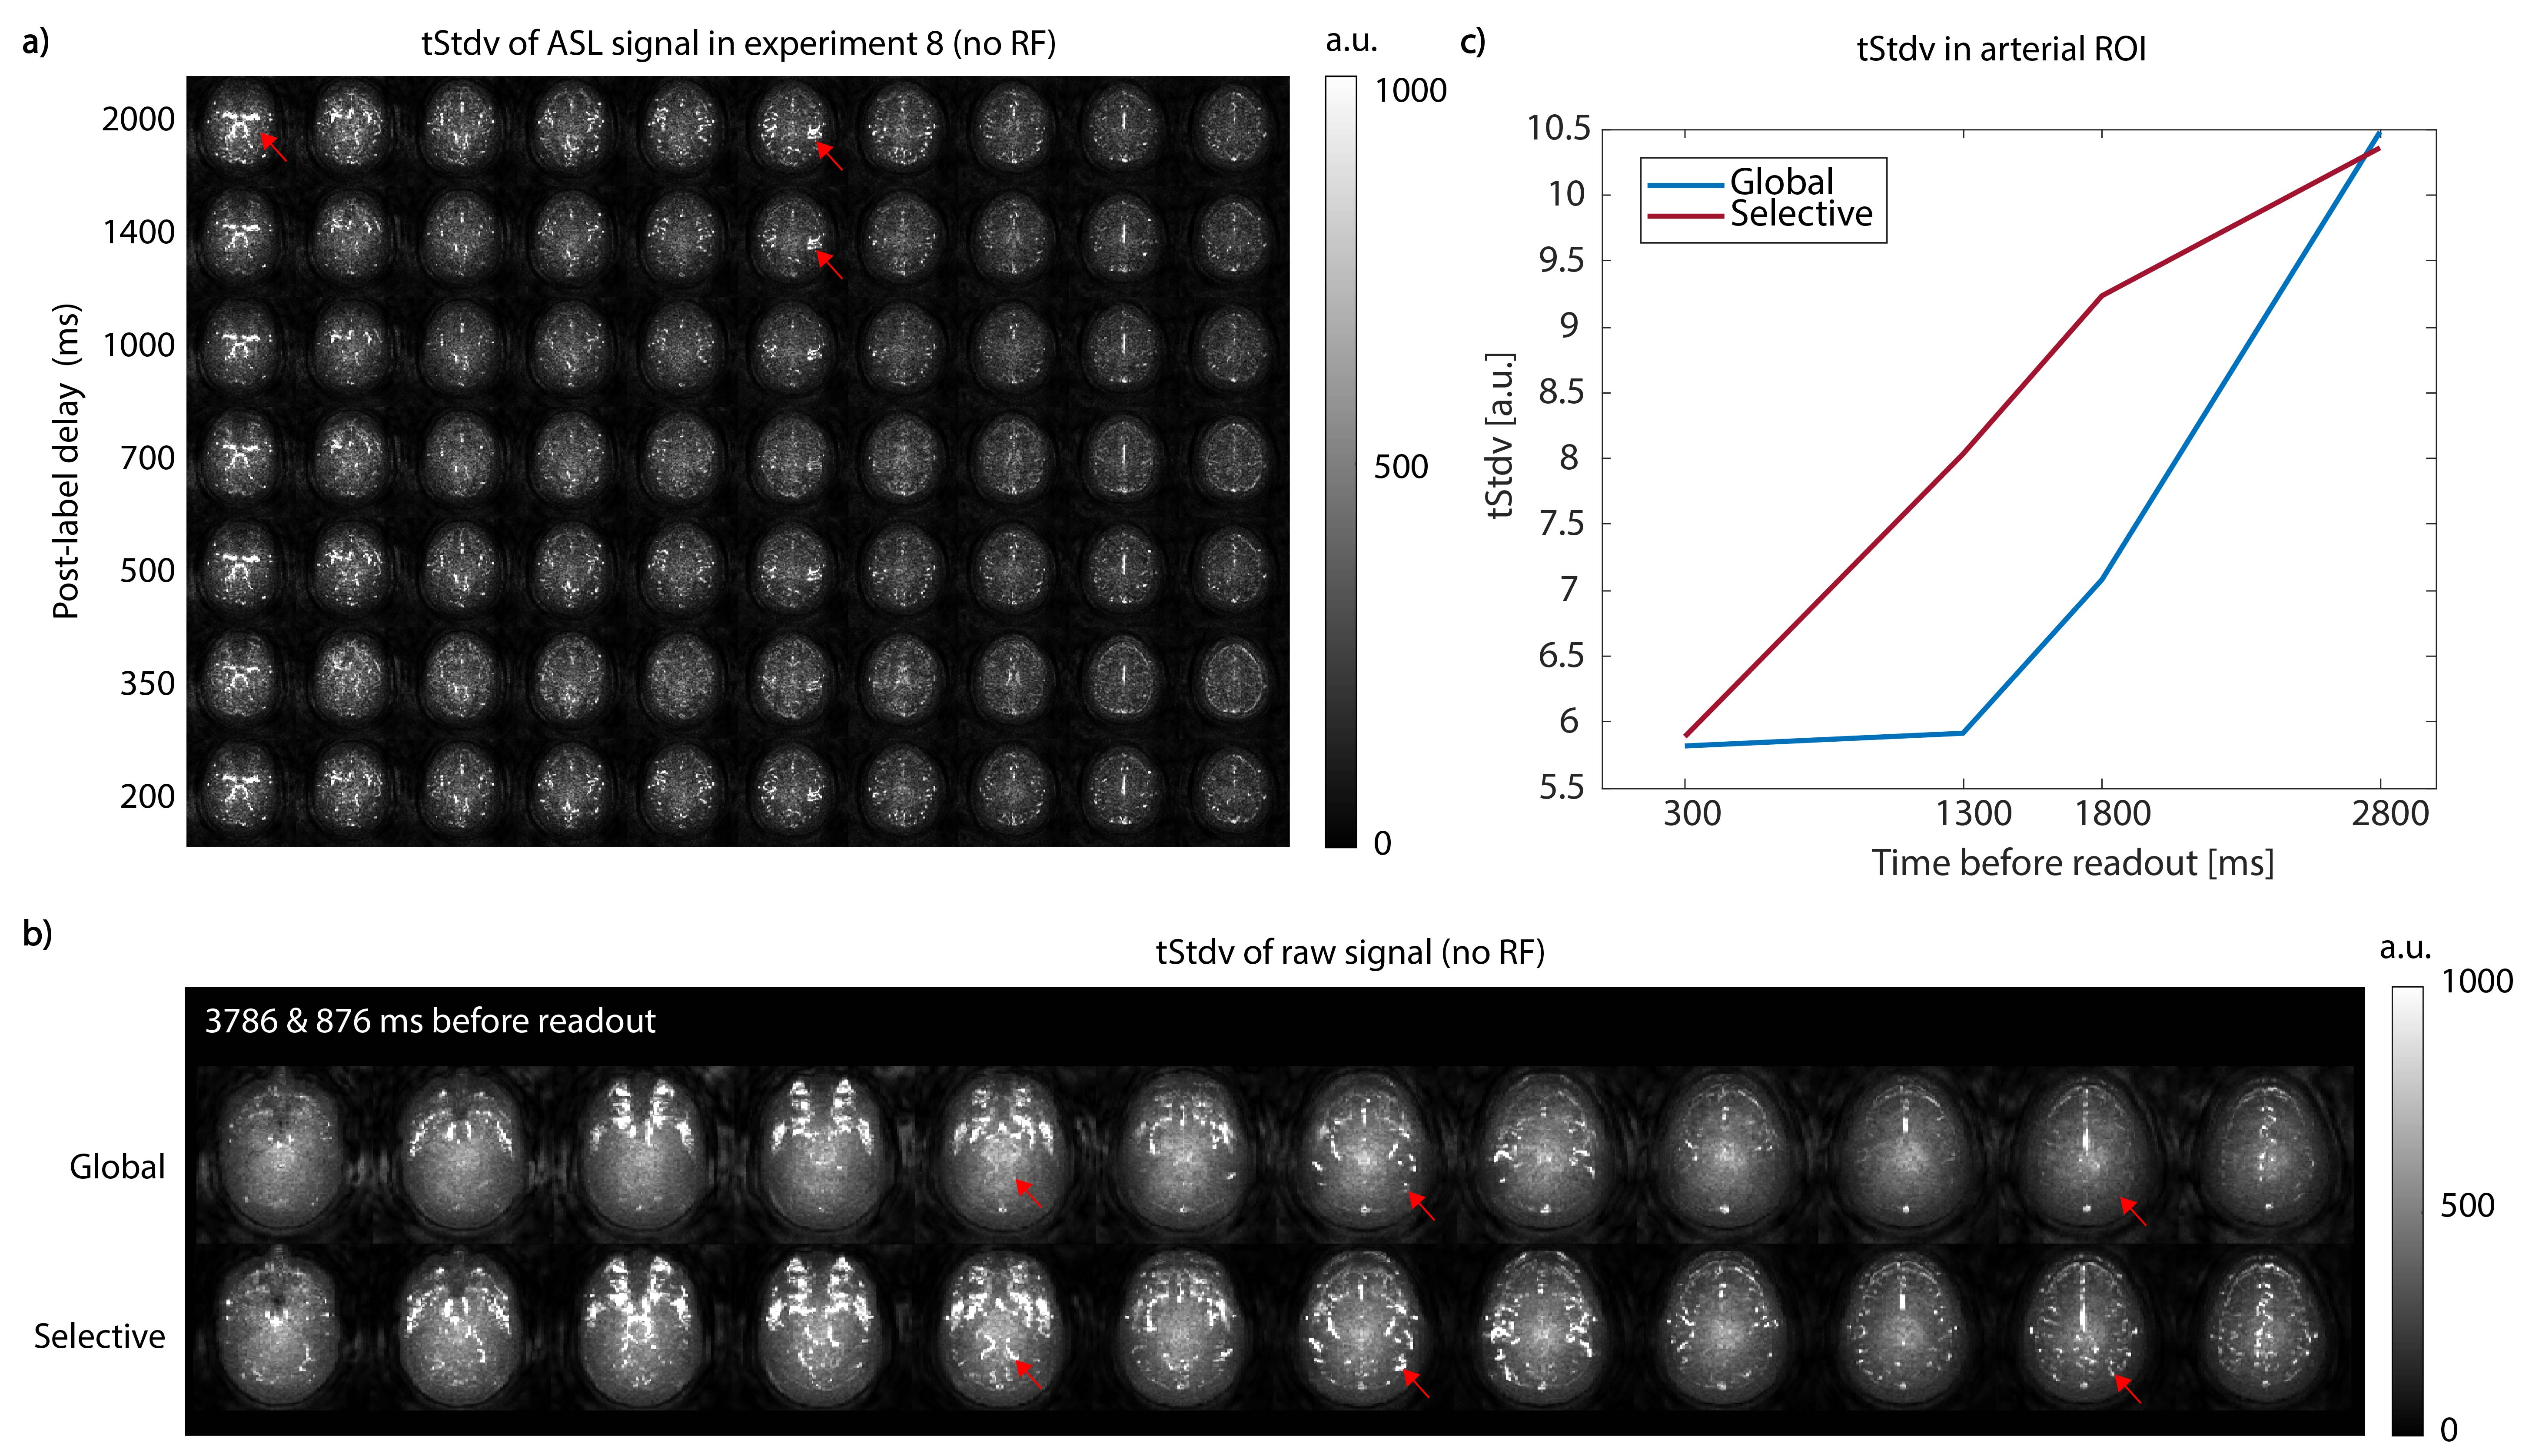
Figure 5. a) shows tStdv maps of ASL signal from experiment #8 without labeling, showing the artefact (e.g.arrows). b) shows
tStdv maps in another volunteer from experiments #8-9 comparing global with
selective BGS. A higher tStdv was
observed with selective BGS (e.g.arrows). c) shows a plot of the mean
tStdv in arteries from experiment #10-11 acquired without labeling and BGS applied at different times before the readout.
tStdv was higher for selective versus global for pulses applied 1300 and 1800
ms before imaging. See Figure 1 for explanation of the experiment numbers.