2715
Optimization of post-labeling delays in multi-delay 3D pCASL by modeling arterial transit time distribution
Zhiyuan Zhang1,2, Timothy Macaulay3, and Lirong Yan1
1USC Stevens Neuroimaging and Informatics Institute, Keck School of Medicine, University of Southern California, Los Angeles, CA, United States, 2Department of Biomedical Engineering, University of Southern California, Los Angeles, CA, United States, 3Division of Biokinesiology and Physical Therapy, Ostrow School of Dentistry, University of Southern California, Los Angeles, CA, United States
1USC Stevens Neuroimaging and Informatics Institute, Keck School of Medicine, University of Southern California, Los Angeles, CA, United States, 2Department of Biomedical Engineering, University of Southern California, Los Angeles, CA, United States, 3Division of Biokinesiology and Physical Therapy, Ostrow School of Dentistry, University of Southern California, Los Angeles, CA, United States
Synopsis
The design of post-labeling delays (PLDs) directly affects the accuracy of CBF and ATT quantifications using multi-delay ASL. In this study, we optimized PLDs in 3D pCASL based upon different ATT distributions including normal distribution directly derived from in vivo ASL data and uniform distribution. Evenly spaced PLDs were also applied for comparison. Our results showed that optimal PLDs based on ATT normal distribution had the best performance in CBF and ATT quantifications with the smallest errors.
Introduction
Arterial spin labeling (ASL) with a single post-labeling delay (PLD) is commonly used for the measurement of cerebral blood flow (CBF). However, varied arterial transit time (ATT) especially in the aged population or under disease conditions could cause undesired bias in CBF quantification, compromising the clinical utility of ASL. As an alternative approach, multi-delay ASL that allows for the estimation of both CBF and ATT according to the general kinetic model theoretically reduces such bias in CBF quantification. Currently, PLD settings are generally based on previous studies in which evenly spaced PLDs were usually employed1, 2, 3. The purpose of this study is to optimize PLDs in a 5-minute multi-delay 3D pCASL protocol by modeling ATT distributions to improve the accuracy of CBF quantification.Method
In vivo multi-delay ASL data: Multi-delay ASL images were collected on 18 healthy elderly volunteers (69.5±5.36 years) on a Siemens Prisma 3T scanner using a 20-channel head coil. A 5 minutes ASL protocol using pCASL with background suppressed 3D GRASE sequence were applied using the following parameters: FOV=240x240mm2, voxel size=2.5x2.5x2.5mm3; TE/TR=36.7/4100ms, labeling duration=1.5s, 7 pairs of control and label with PLDs of 300/800/1300/1800/1800/2300/2300ms leading to a scan time of ~5min. CBF and ATT maps were calculated on each subject1.ATT distribution and PLD optimization: The histogram of ATT values in gray matter was fitted to a Gaussian function on each subject. The voxels with ATT<600ms were excluded for the Gaussian fitting as the majority of these voxels were from vessels with short ATTs. An example of a gray matter ATT histogram with Gaussian curve is showed in Figure 1. The final Gaussian function of ATT distribution was determined by averaging the mean and standard deviation (SD) of Gaussian curves across subjects. Optimal PLDs were generated using the Cramer-rao lower bound optimization4 which takes into account the number of PLDs, ATT distribution function, and measurements. For the sake of simplicity, the total number of measurements was fixed here, which was the same as that of the ASL protocol. Except Gaussian distribution, evenly distributed ATT within the same range was also applied to generate another set of optimal PLDs. A third ATT profile was a variant of uniform distribution by including a transition phase on each side to avoid edging effects4. Three ATT distribution profiles for PLD optimization were shown in Figure 2, generating three ASL protocols with optimal PLDs termed PLDsGaussian_ATT, PLDsRectangle_ATT, and PLDsTrapezoidal_ATT.
Evaluation of ASL protocols with different optimal PLDs: ASL images at optimal PLDs with the three protocols were regenerated based on the M0, CBF, and ATT maps from each subject. Gaussian white noise was added to the control and label images, respectively, before subtraction. Three noise levels including 5/10/15 dB were applied. CBF and ATT maps of gray matter were calculated for each ASL protocol. For comparison, evenly spaced PLDs (PLDsEvenly_spaced) between 0.1s and 2.5s were also used to generate ASL images and subsequent CBF and ATT maps. The CBF and ATT values calculated from the actual ASL scans served as ground truth to evaluate the performance of each protocol. Error maps were obtained by calculating the absolute difference between CBF/ATT values and ground truth.
Result
The histogram of gray matter ATT values from each subject presented good normal distribution except the initial ascending segment due to the contamination of vascular signals, (Figure 1). The mean and SD of the Gaussian function averaged across subjects were 1303.9ms and 412.86ms, respectively. The calculated optimal PLDs under each ATT distribution were listed in Figure 2, besides the evenly spaced PLDs. Figure 3 shows representative CBF and ATT maps and corresponding error maps from a subject using four ASL protocols at SNR of 15dB. An overall good qualitative agreement can be achieved between the generated CBF/ATT maps and the ground truth. Some errors in both CBF and ATT quantifications were noticed to some degree from each protocol. Average root mean square errors of CBF and ATT across subjects at different SNRs were shown in Figure 4. Both CBF error and ATT error increased as noise level increased. Among the four protocols, CBF using PLDsGaussian_ATT showed the smallest errors at all noise levels (p<0.050), whereas relatively greater CBF errors were obtained with PLDsRectangle_ATT and PLDsTrapezoidal_ATT. Similar findings were obtained for ATT errors except that ATT using PLDsEvenly_spaced presented lowest errors at SNR of 5 dB.Discussion and Conclusion
In this study, optimal PLDs were generated using different ATT distributions. We demonstrated that optimal PLDs based on ATT Gaussian distribution showed the best performance in the accuracy of CBF and ATT quantifications, which had the smallest errors across subjects. There are a few strengths in this study. First, this study systematically evaluated the performance of optimal PLDs using different ATT distribution models. Second, the testing data were generated from in vivo data, which can evaluate the performance of each ASL protocol by considering intra- and inter-subject variations of CBF and ATT values. This study suggests that CBF quantification with multi-delay ASL can be improved using optimized PLDs by modeling ATT as normal distribution, which can be also applied to other ASL protocols.Acknowledgements
This work is supported by grants of NIH K25AG056594 and R01NS118019 and BrightFocus Foundation A20201411S.References
- Wang DJ et al. Multi-delay multi-parametric arterial spin-labeled perfusion MRI in acute ischemic stroke - Comparison with dynamic susceptibility contrast enhanced perfusion imaging. Neuroimage Clin. 2013 Jul 6;3:1-7.
- Dai W et al. Reduced resolution transit delay prescan for quantitative continuous arterial spin labeling perfusion imaging. Magn Reson Med. 2012 May;67(5):1252-65.
- Fan AP et al. Long-Delay Arterial Spin Labeling Provides More Accurate Cerebral Blood Flow Measurements in Moyamoya Patients: A Simultaneous Positron Emission Tomography/MRI Study. Stroke. 2017 Sep;48(9):2441-2449.
- Woods JG et al. A general framework for optimizing arterial spin labeling MRI experiments. Magn Reson Med. 2019 Apr;81(4):2474-2488.
Figures
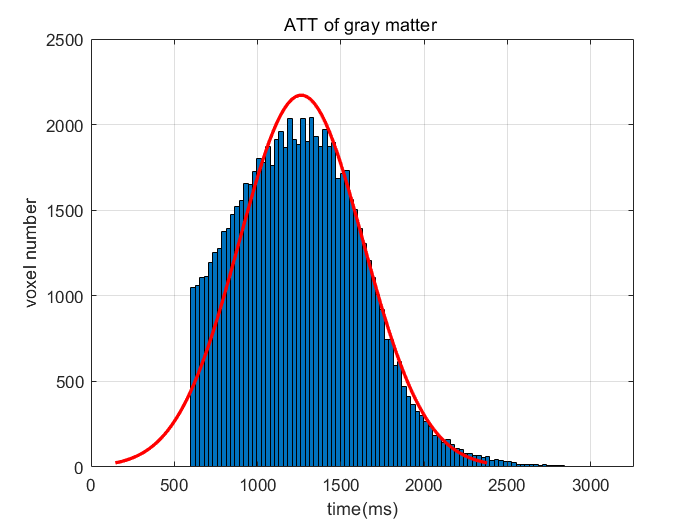
Figure 1. The histogram of ATT (ATT>600ms)
distribution in gray matter from a representative one subject. Gaussian curve
is shown in red.
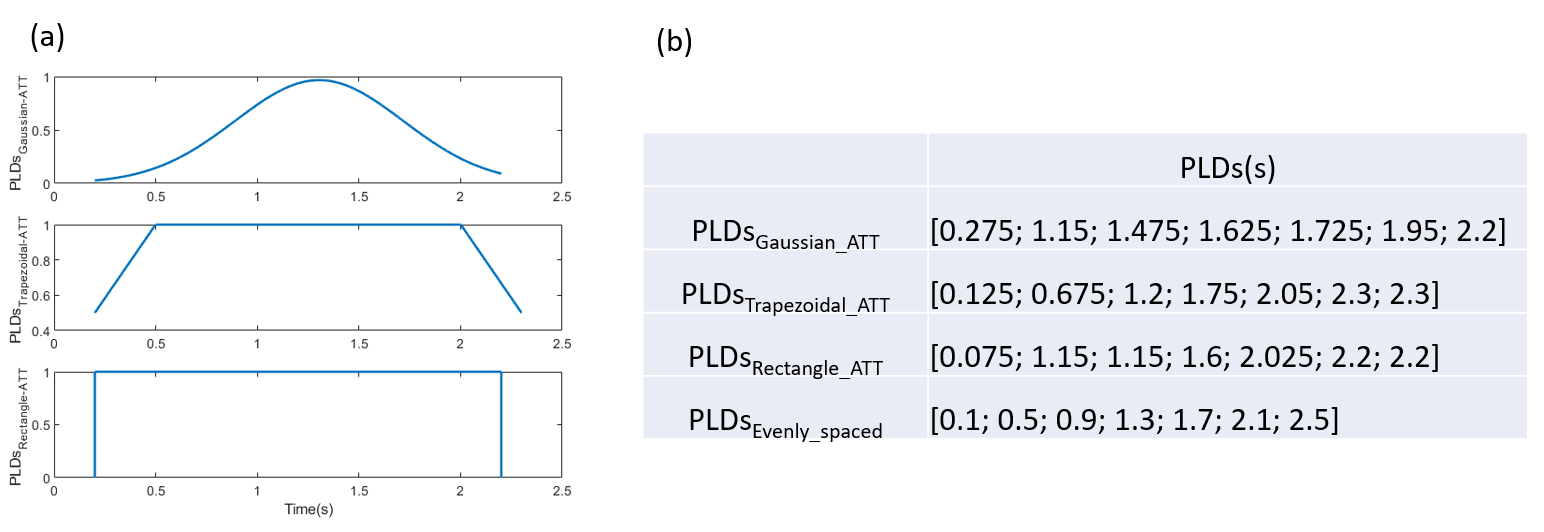
Figure 2. a) Three ATT distribution profiles used for
PLD optimization b) and generated optimal PLDs for each ATT distribution along
with evenly spaced PLDs .
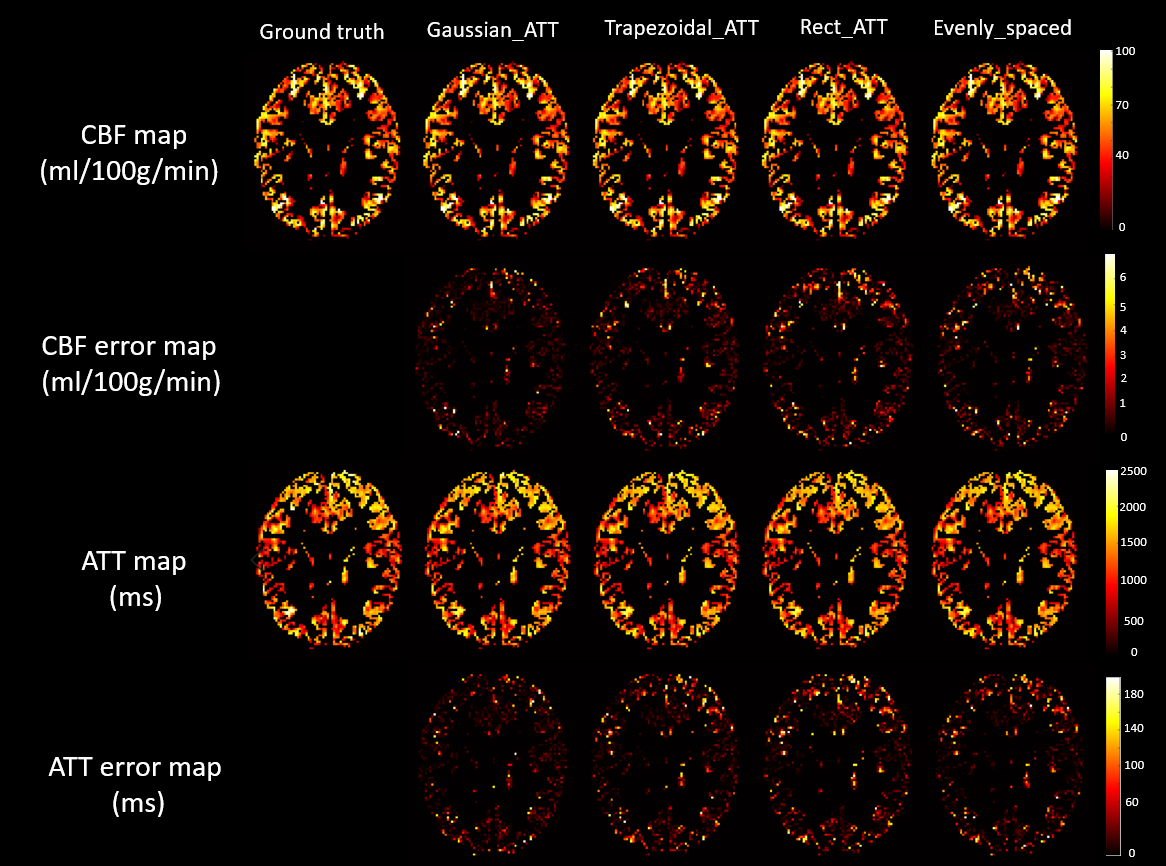
Figure 3. The estimated CBF and ATT maps and corresponding
error maps with the four ASL protocols at SNR of 15dB from a subject. Ground
truth was CBF map and ATT map calculated from the in vivo ASL scan,
respectively.
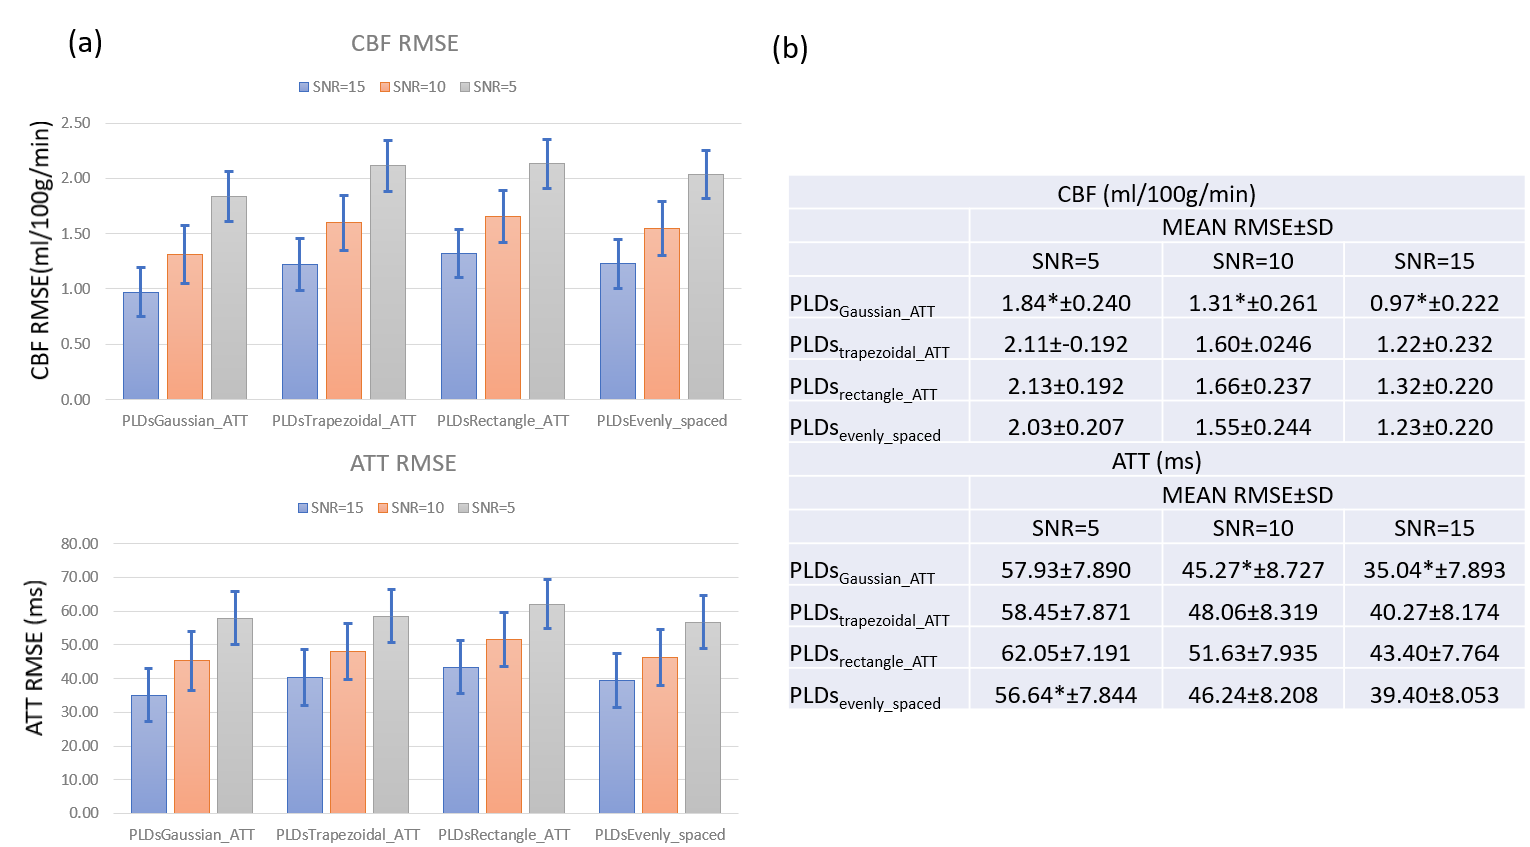
Figure 4. a) The
average root mean square error (RMSE) of gray matter CBF and ATT across
subjects with the four ASL protocols at SNR of 5/10/15 dB, respectively. Error
bar represents the standard deviation of RMSE across subjects. b) Table of mean
and standard deviation of CBF RMSE and ATT RMSE for the four ASL protocols at different
SNRs. *p<0.05, compared with the other protocols.