2713
The Open Source Initiative for Perfusion Imaging (OSIPI): ASL Pipeline inventory1Department of Radiology, University of Pennsylvania, Philadelphia, PA, United States, 2The Johns Hopkins School of Medicine, Baltimore, BC, United States, 3Radiological Sciences, Division of Clinical Neuroscience, School of Medicine, University of Nottingham, Nottingham, United Kingdom, 4Sir Peter Mansfield Imaging Centre, School of Medicine, University of Nottingham, Nottingham, United Kingdom, 5Leiden University Medical Center, Leiden, Netherlands, 6Western University, London, ON, Canada, 7UCL Queen Square Institute of Neurology, University College London, London, United Kingdom, 8Department of Radiology and Nuclear Medicine, Amsterdam University Medical Center, location VU, Amsterdam, Netherlands, 9Helmholtz-Zentrum Dresden-Rossendorf, Dresden, Germany
Synopsis
As a part of the Open Source Initiative for Perfusion Imaging (OSIPI), we have created an inventory of software for automated processing of Arterial Spin Labeling (ASL) perfusion MRI data. We contacted the ASL community through different channels, inviting software developers to list their pipelines by completing a questionnaire covering different aspects and features of a desired pipeline. We received inputs from 18 developers and have summarized the main characteristics of their pipelines based on the information they provided. We expect that this inventory will facilitate ASL-related research, reduce duplicate development, and enable translation of ASL to clinical practice.
Introduction
The Open Source Initiative for Perfusion Imaging1 (OSIPI) aims at promoting the sharing of perfusion imaging software to facilitate research development and collaborations, minimize duplicate development, and expedite translation of perfusion modalities to clinical practice. Arterial Spin Labeling (ASL) perfusion MRI provides non-invasive and quantitative measurement of cerebral blood flow2 (CBF). Since its inception in 1992, the acquisition strategies for ASL have undergone significant improvements, and a consensus recommendation on acquisition has been formed.3 However, there have been limited efforts on creating a consensus on post-processing strategies, which still remain rather disparate among different centers.4-14 This lack of post-processing consensus, in addition to differences across acquisition implementation by each MR vendor, leads to difficulties in comparing findings across research studies. Lack of systematic sharing of pipelines can hinder reproducible research and might limit progress for new ASL users. The OSIPI Task Force 1.115 was created to address these shortcomings by creating an inventory of the available ASL pipelines and summarizing their features and requirements.Methods
We prepared an online questionnaire16 designed to obtain the details of each pipeline. The questions were aimed to obtain information about i) sharing and license information, ii) operating system and other software and hardware requirements, iii) ease of installation and use, iv) input data type and scanner compatibility, v) supported ASL types, vi) data processing features, vii) outputs e.g. CBF maps in different spaces, ROI values, viii) applications other than in the human brain, and ix) amount of data already processed by the pipeline. The questionnaire was sent to the ASL research community using mailing lists of perfusion and medical imaging networks (i.e. OSIPI, ASL-network, GLIMR 2.0, ISMRM Perfusion group, ICP, SPM, an FSL) and directly to pipeline developers.Results
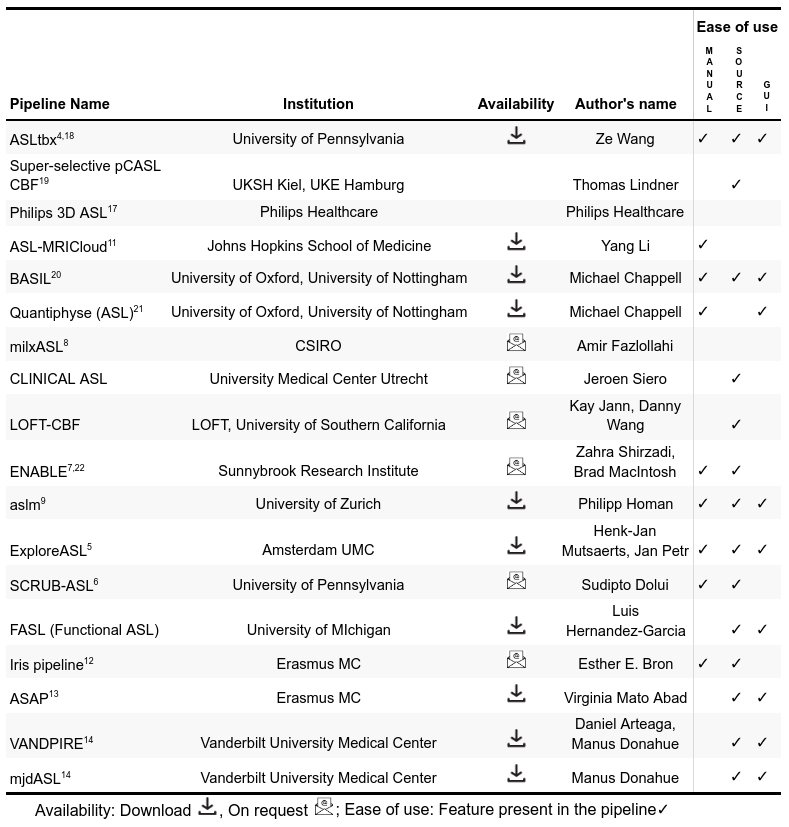
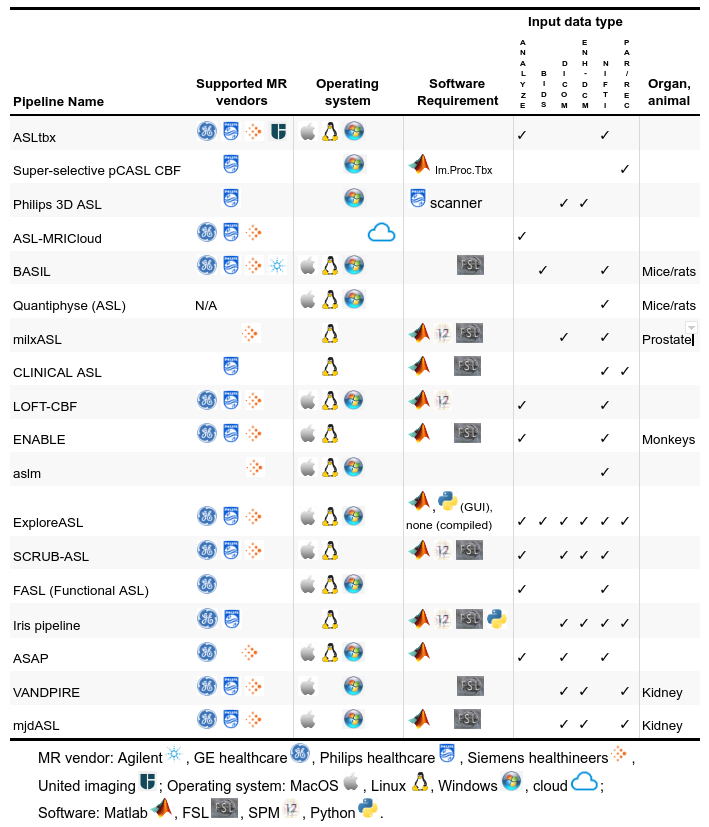
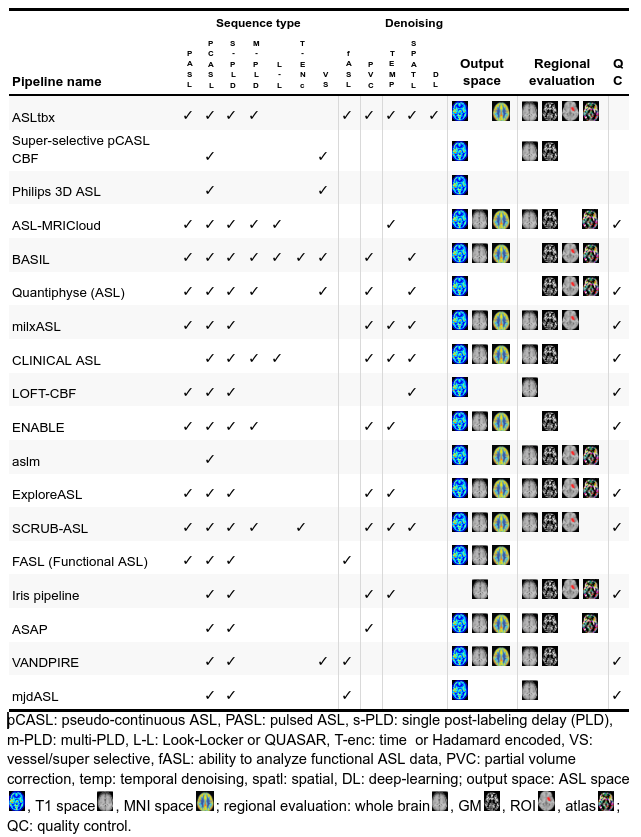
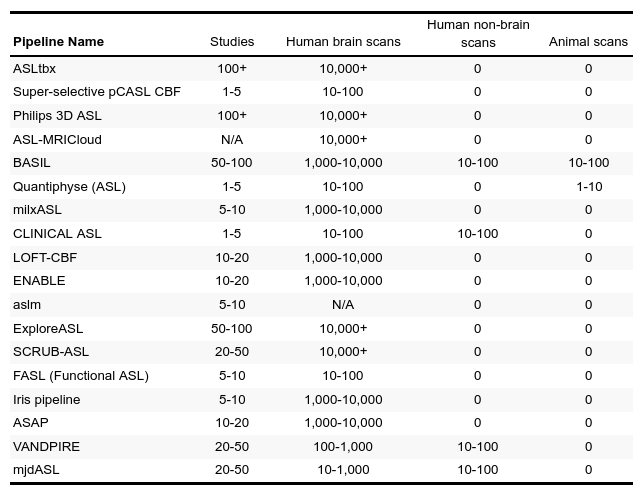
We received responses from 18 pipeline developers. The responses were summarized in four tables below, focusing on the differences and uniqueness of each pipeline. Table 1 lists the details about pipelines’ authorship and availability. Ten pipelines are available for direct download and six additional can be obtained upon request at the developers. All pipelines are free for research purposes, except the Philips pipeline that is integrated directly at the scanner with the ASL sequence product. Table 2 provides a list of the compatible scanners, and software and input data requirements. A large part of the pipelines (n=9) support data from all three major vendors - GE, Philips, and Siemens - and run on Linux (n=13). MacOS (n=12) and Windows (n=12) are also fairly supported, but only a single pipeline works in a cloud. Almost all pipelines work with Nifti inputs (n=13), though there are some that offer DICOM import (n=8) or the new BIDS standard (n=2). The majority of pipelines require Matlab (n=10), highlighting that ASL is still predominantly a research tool. All listed pipelines have been tested on human brain data and only a few are adapted for body imaging (n=3) and preclinical imaging (n=3). Table 3 provides the features based on compatible ASL modalities and the provided outputs. All the pipelines can process pseudo-continuous ASL data and provide output in the ASL space. A smaller proportion of pipelines can also handle multi post-labeling-delay data (n=7). Advanced sequences such as time-encoding (n=2) or territorial mapping with vessel selective ASL (n=5) are not widely supported. All pipelines perform basic processing strategies such as motion correction, blood flow quantification, and M0 processing. Most pipelines perform some types of denoising (temporal=8, spatial=7, deep-learning based=1), partial volume corrections (n=10), or provide some quality control measure (n=11). Key differences among the pipelines are the abilities to align and segment the structural scans, and use these to coregister to standard space, or output regional perfusion measures.Finally, Table 4 lists the number of studies and scans that have been processed by each pipeline as reported by the pipeline developers. Note that these numbers are subjective estimates only and should be interpreted accordingly.Discussion
We presented a summary of the current status of the OSIPI ASL pipeline inventory,15 listing pipelines’ main features and requirements in a concise way. Note that our goal was not to compare the ASL pipelines in terms of their performance. Rather, we recognize that the pipelines are unique and each have something to offer to the community. Specifically, this inventory will serve as a useful guide to new ASL users in helping them to find the best tool for their task. Additionally, this inventory will also enable to capture the different processing strategies that will serve as the first step towards developing a consensus recommendation. Currently, the pipeline authors have self-assessed their pipelines in predefined categories and the answers to many of the questions, such as user friendliness or level of flexibility are subjective and should be considered as such. Future work will address these aspects by performing a more objective evaluation of all pipelines on different datasets covering a wide variety of ASL sequences and diseases. Note that the submissions to the pipeline inventory are still open, and ASL developers focused on different organs and/or animals are especially encouraged to list their pipelines.Acknowledgements
We acknowledge the following developers and companies for providing information about their pipelines by completing our questionnaire: Ze Wang, Thomas Lindner, Philips Healthcare, Yang Li, Michael Chappell, Amir Fazlollahi, Jeroen Siero, Kay Jann and Danny Wang, Zahra Shirzadi and Brad MacIntosh, Philipp Homan, Luis Hernandez-Garcia, Esther Bron, Juan Antonio Hernández Tamames, Fernando Zelaya, and Manus Donahue. SD is supported by NIH grant R03 AG063213. HM is supported by the Dutch Heart Foundation (2020T049), and by the Eurostars-2 joint programme with co-funding from the European Union Horizon 2020 research and innovation programme, provided by the Netherlands Enterprise Agency (RvO).References
1. Open Source Initiative for Perfusion Imaging (OSIPI) website: http://osipi.org/
2. J.A. Detre, J.S. Leigh, D.S. Williams, A.P. Koretsky. Perfusion imaging. Magn. Reson. Med., 23 (1) (1992), pp. 37-45
3. David C. Alsop, John A. Detre, Xavier Golay, Matthias Günther, Jeroen Hendrikse, Luis Hernandez-Garcia, Hanzhang Lu, et al. Recommended implementation of arterial spin-labeled perfusion MRI for clinical applications: a consensus of the ISMRM perfusion study group and the European consortium for ASL in Dementia Magn. Reson. Med., 73 (1) (2015), pp. 102-116
4. Z. Wang, K. Aguirre Geoffrey, H. Rao, J. Wang, María A. Fernández-Seara, Anna Rose Childress, John A. Detre. Empirical optimization of ASL data analysis using an ASL data processing toolbox: ASLtbx. Magn. Reson. Imag., 26 (2) (2008), pp. 261-269
5. Henk J.M.M. Mutsaerts, Jan Petr, Paul Groot, et al. ExploreASL: An image processing pipeline for multi-center ASL perfusion MRI studies. NeuroImage. Volume 219, 2020
6. Sudipto Dolui, Ze Wang, Russell T. Shinohara, David A. Wolk, John A. Detre, Alzheimer’s Disease Neuroimaging Initiative. Structural correlation-based outlier rejection (SCORE) algorithm for arterial spin labeling time series. J. Magn. Reson. Imag., 45 (6) (2017), pp. 1786-1797
7. Zahra Shirzadi, David E. Crane, Andrew D. Robertson, Pejman J. Maralani, Richard I. Aviv, Michael A. Chappell, Benjamin I. Goldstein, Sandra E. Black, Bradley J. MacIntosh. Automated removal of spurious intermediate cerebral blood flow volumes improves image quality among older patients: a clinical arterial spin labeling investigation. J. Magn. Reson. Imag., 42 (5) (2015), pp. 1377-1385
8. Amir Fazlollahi, Pierrick Bourgeat, Xiaoyun Liang, Fabrice Meriaudeau, Alan Connelly, Olivier Salvado, Fernando Calamante. Reproducibility of multiphase pseudo-continuous arterial spin labeling and the effect of post-processing analysis methods. Neuroimage, 117 (2015), pp. 191-201
9. Homan P, Kindler J, Hubl D, Dierks T. Auditory verbal hallucinations: imaging, analysis, and intervention. Eur Arch Psychiatry Clin Neurosci. 2012 Nov;262 Suppl 2:S91-5.
10. Michael A. Chappell, Bradley J. MacIntosh, Manus J. Donahue, Matthias Günther, Jezzard Peter, Mark W. Woolrich. Separation of macrovascular signal in multi-inversion time arterial spin labelling MRI. Magn. Reson. Med., 63 (5) (2010), pp. 1357-1365
11. Yang Li, Peiying Liu, Li Yue, Hongli Fan, Su Pan, Shin-Lei Peng, Denise C. Park, et al. ASL-MRICloud: an online tool for the processing of ASL MRI data NMR Biomed., 32 (2) (2019), Article e4051
12. Bron EE, Steketee RM, Houston GC, Oliver RA, Achterberg HC, Loog M, van Swieten JC, Hammers A, Niessen WJ, Smits M, Klein S. Diagnostic classification of arterial spin labeling and structural MRI in presenile early stage dementia. Human brain mapping. 2014 Sep;35(9):4916-31.
13. Mato Abad V, García-Polo P, O'Daly O, Hernández-Tamames JA, Zelaya F. ASAP (Automatic Software for ASL Processing): a toolbox for processing arterial spin labeling images. Magnetic Resonance Imaging. 2016 Apr 1;34(3):334-44.
14. Arteaga DF, Strother MK, Davis LT, Fusco MR, Faraco CC, Roach BA, Scott AO, Donahue MJ. Planning-free cerebral blood flow territory mapping in patients with intracranial arterial stenosis. J Cereb Blood Flow Metab. 2017 Jun;37(6):1944-1958.
15. OSIPI Task Force 1.1 website: https://www.osipi.org/task-force-1-1/
16. OSIPI ASL pipeline questionnaire: https://docs.google.com/forms/d/e/1FAIpQLSf-4_pBXFA31htMNPZo1kQgcY0EJ5_AWxjyvkkYIQVGUHo6sg/viewform
17. Philips Website: https://www.philips.co.uk/healthcare/product/HCNMRB967/3d-asl-mr-clinical-application
18. Ze Wang. Improving cerebral blood flow quantification for arterial spin labeled perfusion MRI by removing residual motion artifacts and global signal fluctuations Magnetic Resonance Imaging. 30(10) (2012), pp. 1409-1415.
19. Lindner T, Jansen O, Helle M. Optimized super-selective Arterial Spin Labeling for quantitative flow territory mapping. Magn Reson Imaging. 2018 Nov;53:14-19.
20. BASIL website: https://fsl.fmrib.ox.ac.uk/fsl/fslwiki/BASIL
21. Quantiphyse website: https://eng.ox.ac.uk/quantiphyse/
22. Shirzadi Z, Stefanovic B, Chappell MA, Ramirez J, Schwindt G, Masellis M, Black SE, MacIntosh BJ. Enhancement of automated blood flow estimates (ENABLE) from arterial spin‐labeled MRI. Journal of Magnetic Resonance Imaging. 2018 Mar;47(3):647-55.
Figures