2711
An Automatic and Subject-specific Method for Locus Coeruleus Localization and BOLD Activity Extraction1Department of Biomedical Engineering, Columbia University, New York, NY, United States, 2Department of Electrical Engineering, Columbia University, New York, NY, United States, 3Department of Radiology, Columbia University, New York, NY, United States, 4Data Science Institute, Columbia University, New York, NY, United States
Synopsis
The locus coeruleus (LC) is a small nucleus in the brainstem whose function is integral to regulating cognitive arousal. Despite the LC’s importance in cognitive processing, localizing it in functional space is challenging. Here, we propose a method that uses both an atlas and subjects’ neuromelanin-sensitive MRI images to estimate LC BOLD activity. We show that the LC BOLD extracted with our method is more strongly correlated with trial-to-trial variability in baseline pupil diameter than comparable approaches, an important metric since non-luminance changes in pupil diameter have been shown to covary with LC electrophysiological recordings in non-human primates.
Introduction
With broad projections to the cortex, the locus coeruleus (LC) has been implicated in arousal, attention, task performance and exploration behaviors1. In most fMRI studies, LC localization is based on a functional activation map2, 3, a predefined atlas4, 5 or both6. Since the LC is a small brainstem nucleus surrounded by other nuclei, these methods lack specificity in the anatomical evidence of the nucleus’ location7, and tend to ignore individual variability in the LC's shape and location8. To address this, some studies perform manual segmentation based on neuromelanin-sensitive Turbo Spin Echo (TSE) images9, 10. TSE images tend to localize the LC more accurately, although the images need to be manually inspected on a subject-by-subject basis. Here, by using both subject-specific TSE images and a predefined atlas, we develop an automatic localization method to extract BOLD activity in the LC. Given substantial evidence that pupil diameter and LC covary with one another1, 3, 11, 12, we evaluated the quality of our results and compared them to alternative approaches by computing the trial-to-trial correlation between the extracted LC BOLD activity and simultaneously recorded pupil diameter.Methods
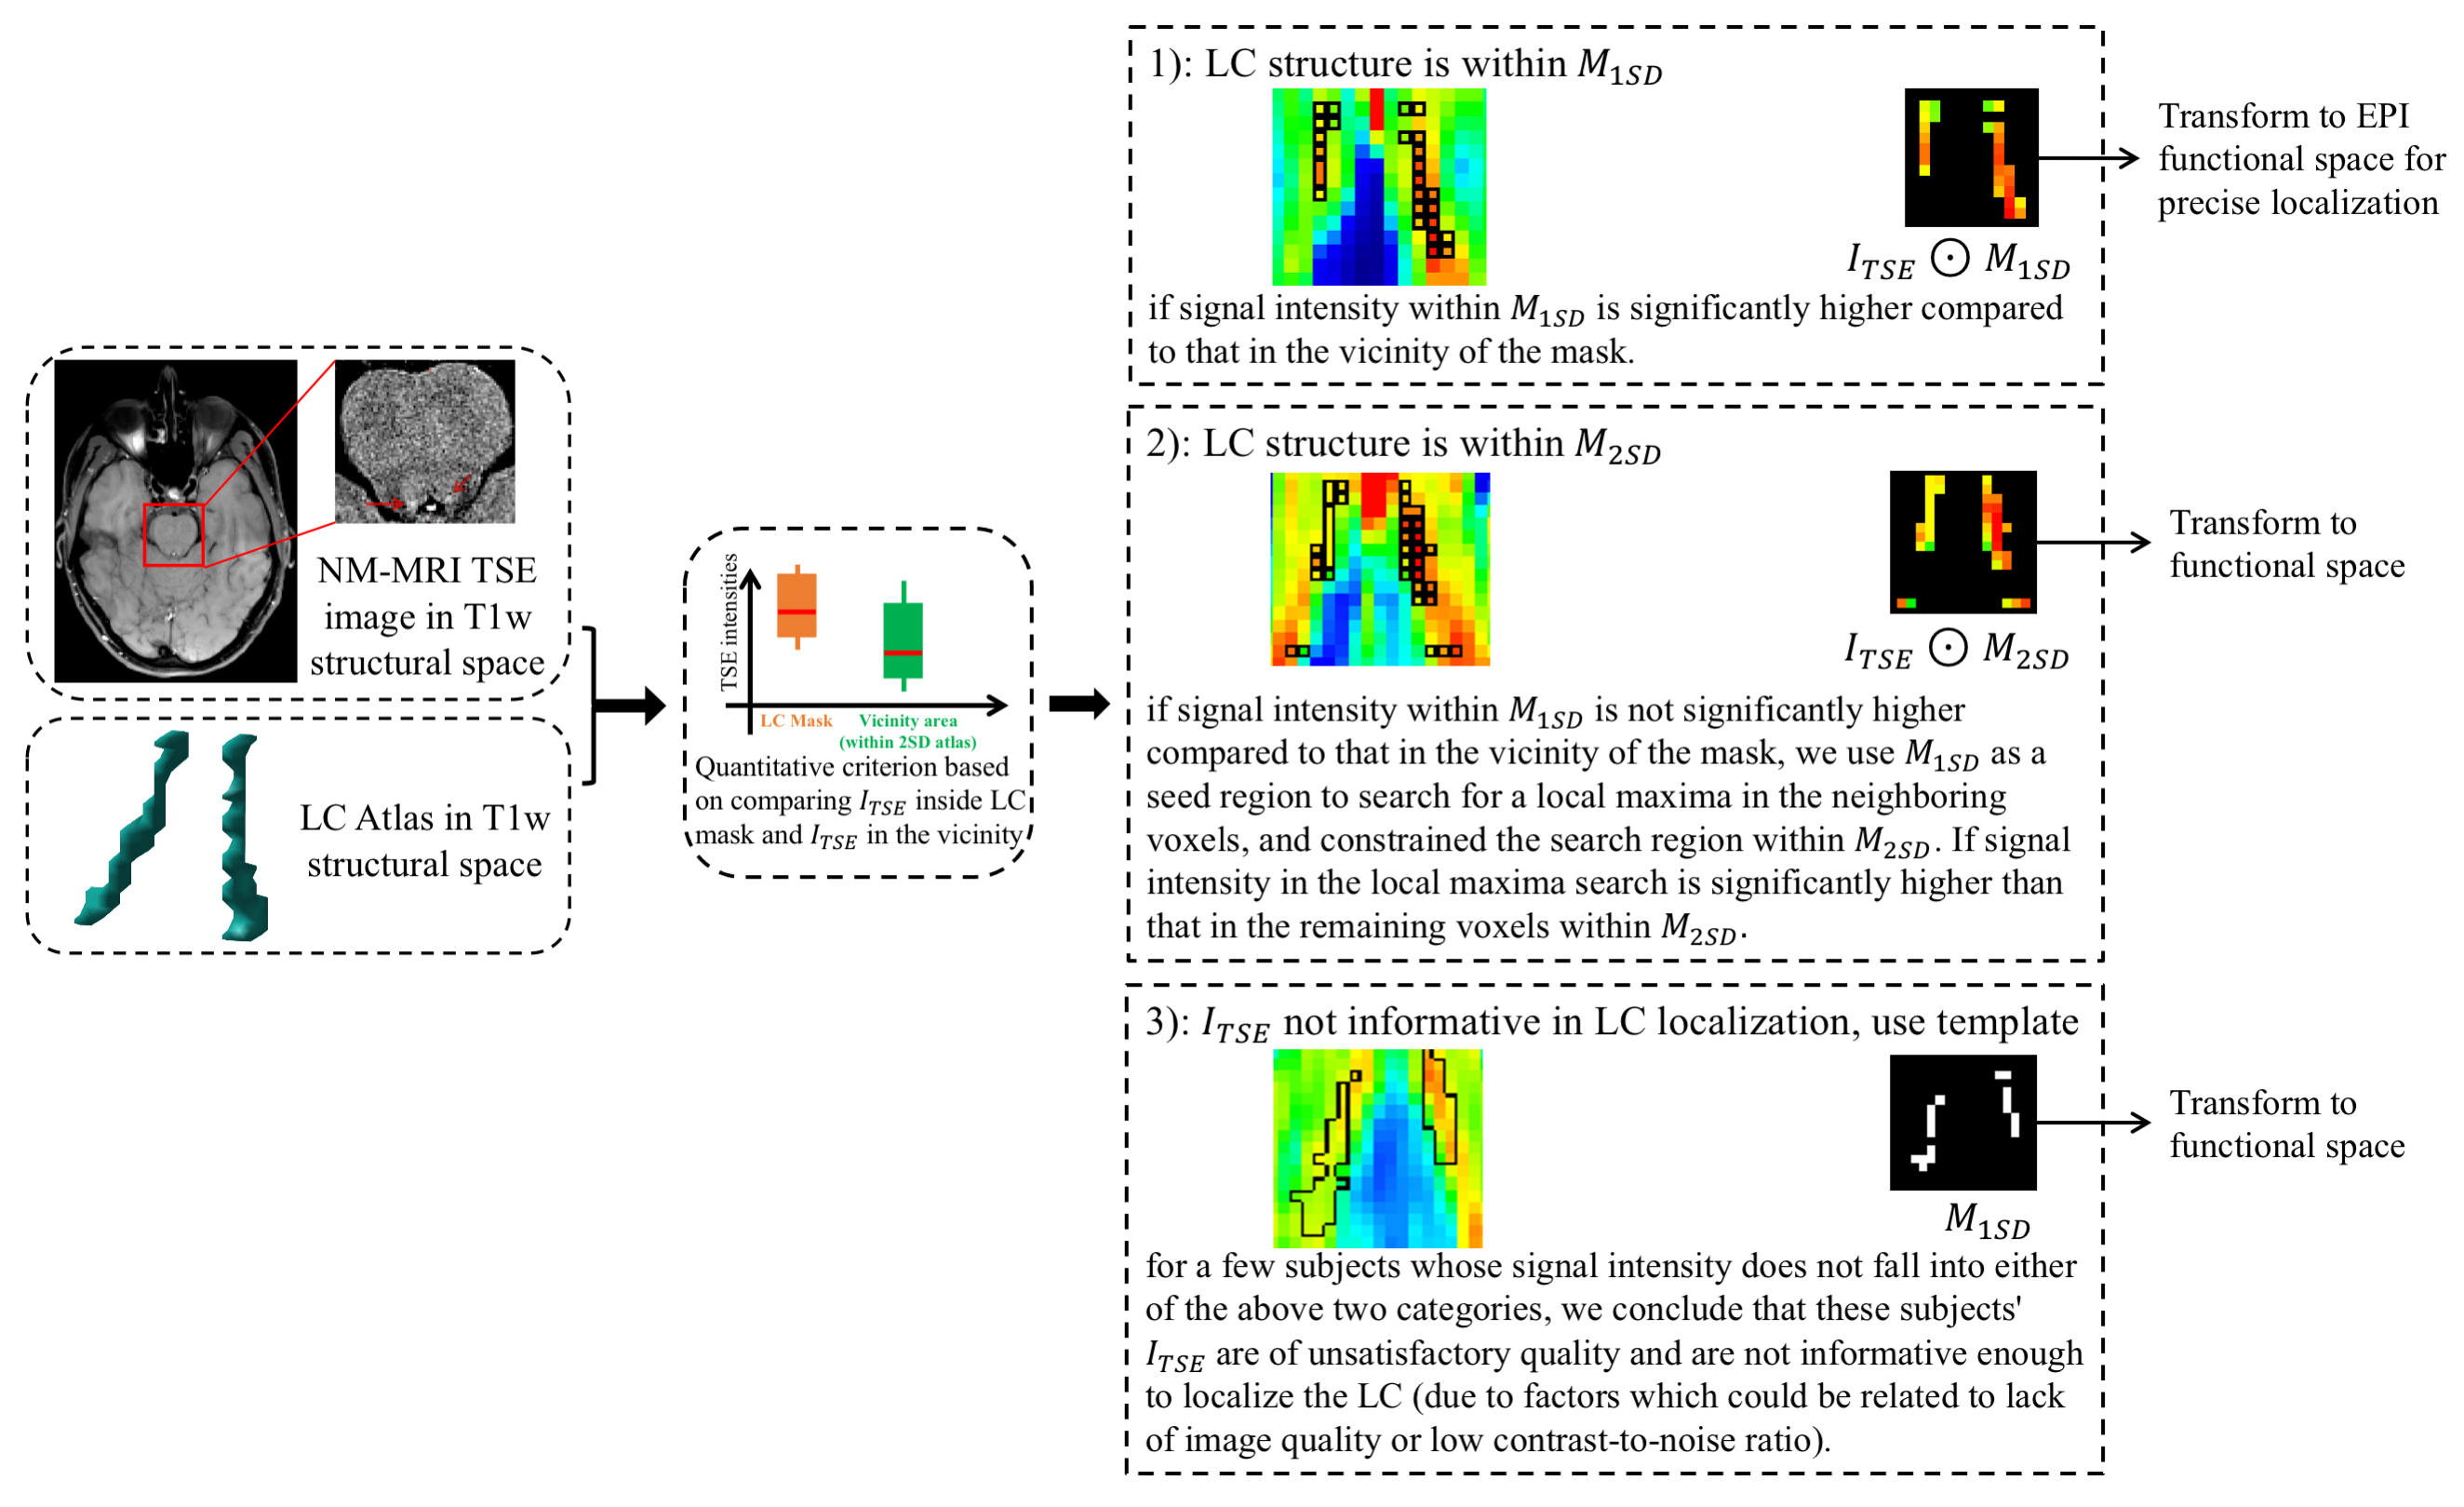
For LC localization and BOLD activity extraction, we used a combination of a predefined LC atlas13 and subject-specific TSE images to determine the spatial distribution of the LC in subjects' structural space, and then performed a more precise localization in functional space. Specifically, the LC atlas includes both one standard deviation (SD) and two SD estimates of the peak LC signal in standard space, and can be used as a template to map the spatial location of the LC in the brainstem. We first transformed the atlas to the structural space14, denoting these 1SD and 2SD LC masks as $$$M_{1SD}$$$ and $$$M_{2SD}$$$. We denote the TSE images as $$$I_{TSE}$$$. Next as shown in Fig. 1, and contrary to other studies3, 4, 6 which localized LC in standard space, we first identified the spatial distribution of the LC in the structural space in order to eliminate resampling of the fMRI signal. As the LC shows a hyperintensity in TSE images15, voxels within the LC structure exhibit high intensity compared to voxels which are outside of the nucleus. We used subject-specific $$$I_{TSE}$$$ alongside $$$M_{1SD}$$$ and $$$M_{2SD}$$$ to develop a quantitative criterion. This criterion compares the intensities of voxels, $$$I_{TSE}$$$, in the LC mask and intensities of voxels in the vicinity of the mask. This localization strategy results in three outcomes, summarized in Fig. 1.After identifying the spatial distribution of LC in the structural space, we fine-tuned the localization of LC in functional space by transforming $$$I_{TSE}\bigodot{M_{1SD}}$$$, $$$I_{TSE}\bigodot{M_{2SD}}$$$, or $$$M_{1SD}$$$ to functional space, respectively for the three outcomes given in Fig 1. We included both two-voxel and six-voxel versions of the LC in functional space. Voxel intensity within these fine-tuned LC masks were then normalized to represent the probability of each voxel being inside the LC structure. These probability maps were then applied to BOLD signal at LC, and produced weighted average LC BOLD signals. Signals in the two-voxel and six-voxel LC masks are denoted as core-LC and entire-LC BOLD, respectively.
Experiments and Results
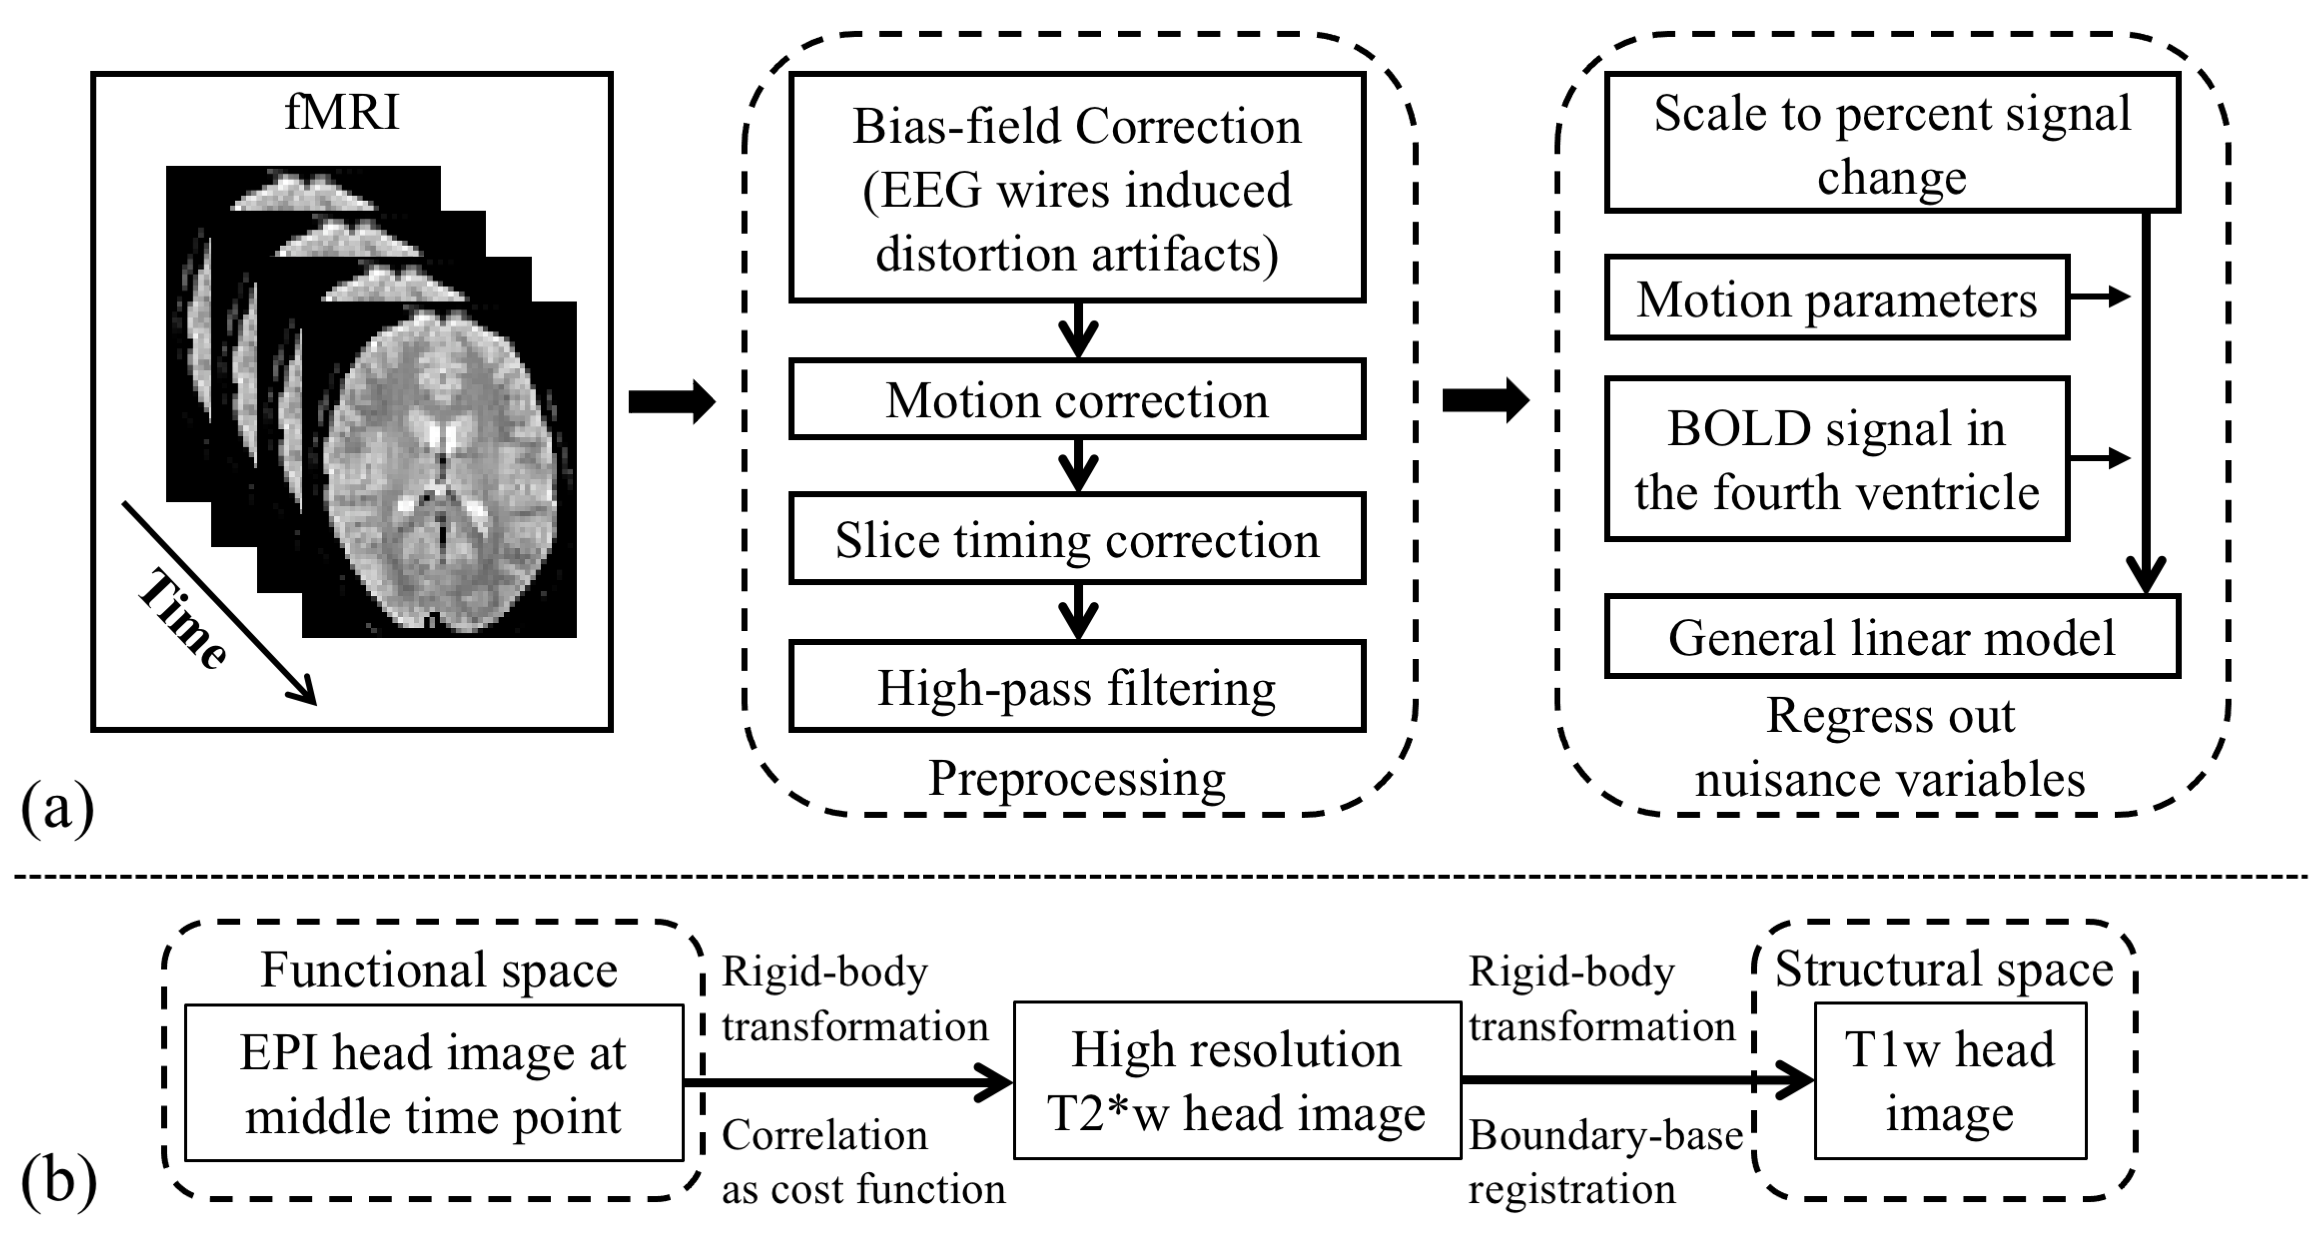
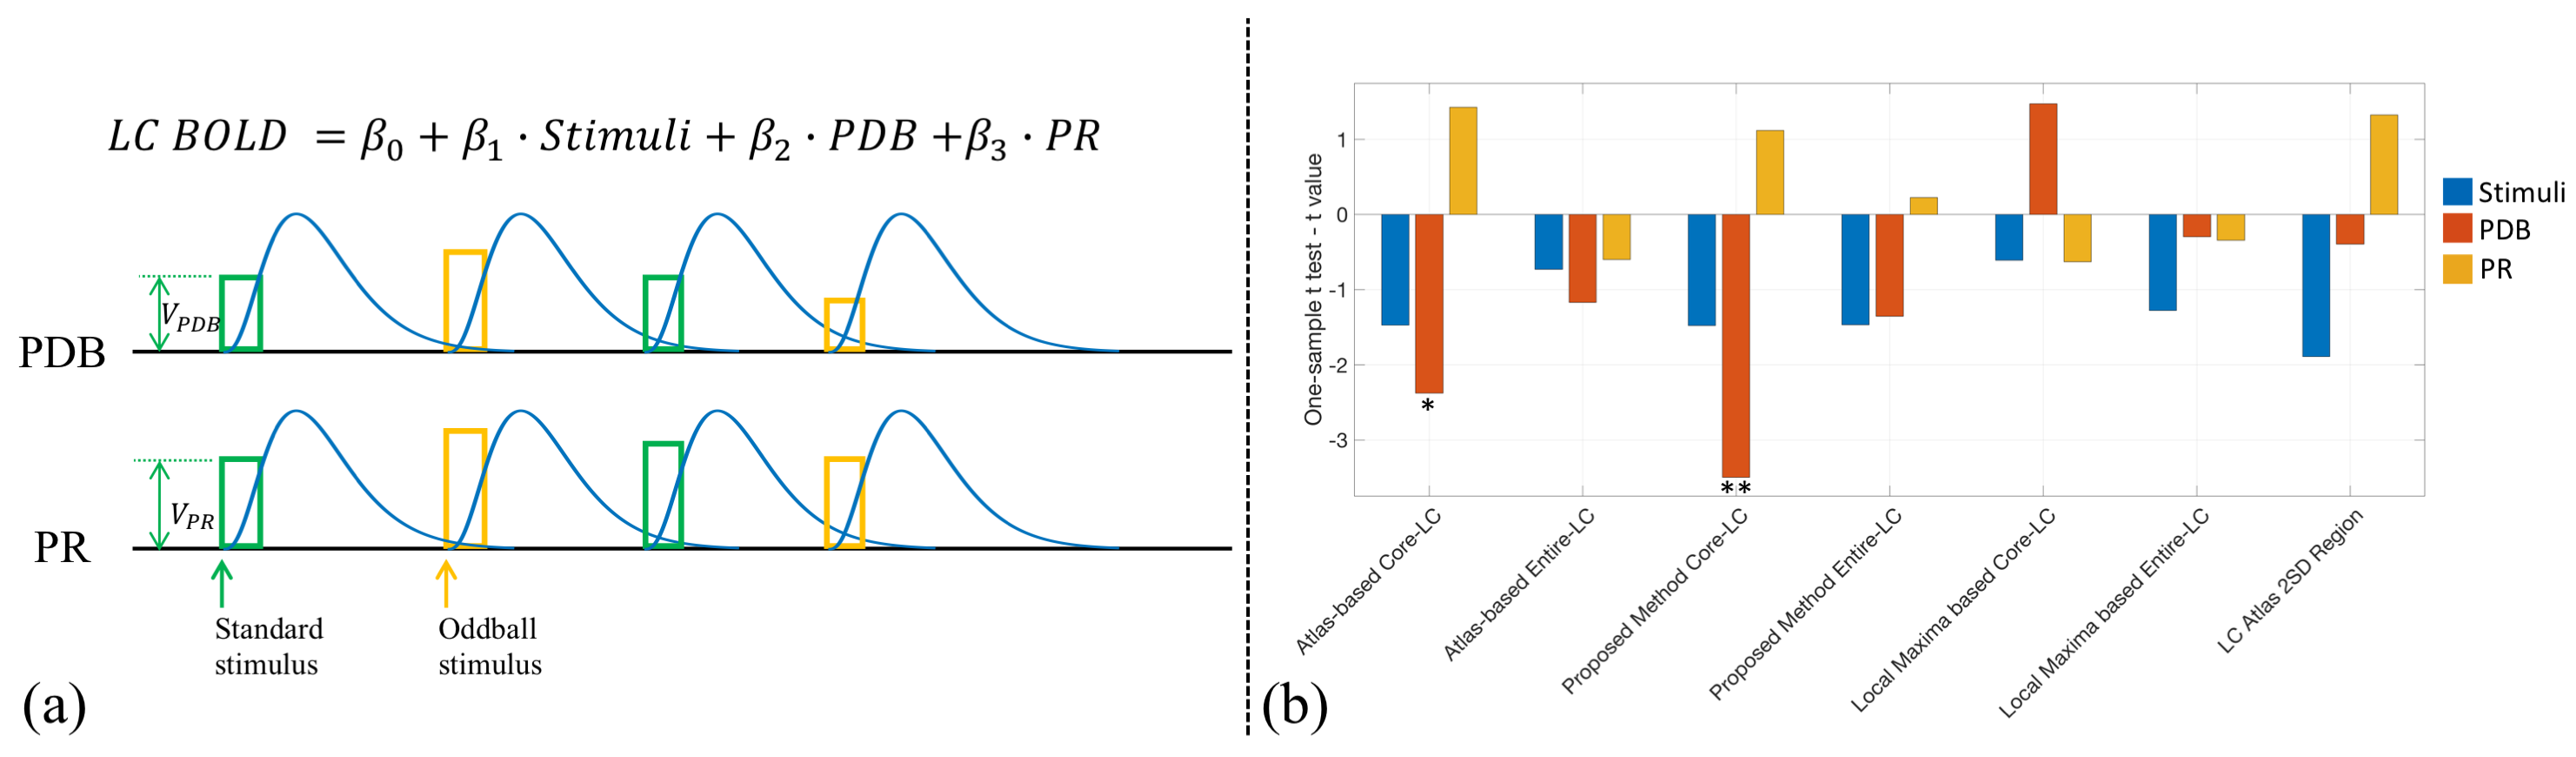
Nineteen subjects performed an auditory oddball task inside the scanner, with their pupil diameter recorded simultaneously. A 3T Siemens Prisma scanner was used to acquire T1w (TR=2300ms; TE=3.95ms; voxel size 1x1x1mm; Matrix Size=176x248x256), T2*w EPI (TR=2100ms; TE=25ms; voxel size 3x3x3mm; Matrix Size=64x64x42; 150 volumes; 3 to 5 runs), single-volume high-resolution EPI (TR=6000ms; TE=30ms; voxel size 2x2x3mm; Matrix Size=96x96x42) and neuromelanin-sensitive MRI TSE (TR=600ms; TE=14ms; voxel size 0.43x0.43x6mm; Matrix Size=416x512x5) images. The fMRI data were processed using FSL16 with preprocessing pipeline shown in Fig. 2(a) and inter-modality registration as in Fig. 2(b)17, 18. MR-compatible EyeLink 1000 Plus in Long Range Mount was used for pupillometry, with pupil diameter preprocessed as in 19.LC BOLD activity extraction was evaluated by correlating LC BOLD signal to trial-to-trial variability of baseline pupil diameter (PDB) and pupillary response (PR) (see Fig. 3(a)). Correlation analyses were carried out using a general linear model (GLM), with PDB and PR as the explanatory variables, and LC BOLD as the response variable. On the group level, we used a one sample t-test to determine if parameter estimates were significantly different than zero. As shown in Fig. 3(b), BOLD activity extracted from core-LC with our method has a higher correlation with trial-to-trial variability of PDB (t = -3.499; p < 0.003) compared to activity extracted with an atlas-based method (t = -2.378; p < 0.029) or a local maximum-based method (t = 1.476; p > 0.157).
Discussions and Conclusions
We developed a method that uses both subject-specific TSE images and a predefined atlas to automatically localize and extract BOLD activity from the LC. Using correlation to pupil dynamics as a metric, we compared our method to competing approaches. We found that core-LC BOLD activity extracted with our method had a stronger and more significant correlation with trial-to-trial variability of baseline pupil diameter. Given the substantial interest in how the LC modulates cortical brain dynamics to affect human cognition, we believe our approach would have utility for those interesting in relating LC BOLD to cortical dynamics and behavior.Acknowledgements
This work was supported by an Army Research Laboratory Cooperative Agreement W911NF-10-2-0022 and a Vannevar Bush Faculty Fellowship from the US Department of Defense (N00014-20-1-2027).References
1. Aston-Jones G, Cohen JD. An integrative theory of locus coeruleus-norepinephrine function: adaptive gain and optimal performance. Annu. Rev. Neurosci.. 2005 Jul 21;28:403-50.
2. Minzenberg MJ, Watrous AJ, Yoon JH, Ursu S, Carter CS. Modafinil shifts human locus coeruleus to low-tonic, high-phasic activity during functional MRI. Science. 2008 Dec 12;322(5908):1700-2.
3. Gilam G, Lin T, Fruchter E, et al. Neural indicators of interpersonal anger as cause and consequence of combat training stress symptoms. Psychological medicine. 2017;47(9):1561.
4. Hubbard C S, Labus J S, Bueller J, et al. Corticotropin-releasing factor receptor 1 antagonist alters regional activation and effective connectivity in an emotional–arousal circuit during expectation of abdominal pain. Journal of Neuroscience. 2011;31(35):12491-12500.
5. Morey R A, Dunsmoor J E, Haswell C C, et al. Fear learning circuitry is biased toward generalization of fear associations in posttraumatic stress disorder. Translational psychiatry. 2015;5(12): e700-e700.
6. Murphy PR, O'Connell RG, O'sullivan M, Robertson IH, Balsters JH. Pupil diameter covaries with BOLD activity in human locus coeruleus. Human brain mapping. 2014 Aug;35(8):4140-54.
7. Astafiev, Serguei V., et al. Comment on “Modafinil shifts human locus coeruleus to low-tonic, high-phasic activity during functional MRI” and “Homeostatic sleep pressure and responses to sustained attention in the suprachiasmatic area”. Science. 2010;309-309.
8. Tona KD, Keuken MC, de Rover M, Lakke E, Forstmann BU, Nieuwenhuis S, van Osch MJ. In vivo visualization of the locus coeruleus in humans: quantifying the test–retest reliability. Brain Structure and Function. 2017 Dec 1;222(9):4203-17.
9. Krebs R M, Park H R P, Bombeke K, et al. Modulation of locus coeruleus activity by novel oddball stimuli. Brain imaging and behavior. 2018; 12(2):577-584.
10. de Gee J W, Colizoli O, Kloosterman N A, et al. Dynamic modulation of decision biases by brainstem arousal systems. Elife. 2017;6:e23232.
11. Gilzenrat MS, Nieuwenhuis S, Jepma M, Cohen JD. Pupil diameter tracks changes in control state predicted by the adaptive gain theory of locus coeruleus function. Cognitive, Affective, & Behavioral Neuroscience. 2010;10(2):252-69.
12. Joshi S, Li Y, Kalwani RM, Gold JI. Relationships between pupil diameter and neuronal activity in the locus coeruleus, colliculi, and cingulate cortex. Neuron. 2016 Jan 6;89(1):221-34.
13. Keren, Noam I., et al. In vivo mapping of the human locus coeruleus. Neuroimage. 2009;1261-1267.
14. Andersson J L R, Jenkinson M, Smith S. Non-linear registration aka Spatial normalisation FMRIB Technial Report TR07JA2. FMRIB Analysis Group of the University of Oxford. 2007;1-22.
15. Sasaki M, Shibata E, Tohyama K, et al. Neuromelanin magnetic resonance imaging of locus ceruleus and substantia nigra in Parkinson's disease. Neuroreport. 2006;17(11):1215-1218.
16. S.M. Smith, M. Jenkinson, M.W. Woolrich, et al. Advances in functional and structural MR image analysis and implementation as FSL. NeuroImage. 2004;23(S1):208-19.
17. Jenkinson, M., Bannister, P., Brady, J. M. and Smith, S. M. Improved Optimisation for the Robust and Accurate Linear Registration and Motion Correction of Brain Images. NeuroImage. 2002;17(2):825-841.
18. Greve D N, Fischl B. Accurate and robust brain image alignment using boundary-based registration. Neuroimage. 2009;48(1):63-72.
19. Urai AE, Braun A, Donner TH. Pupil-linked arousal is driven by decision uncertainty and alters serial choice bias. Nature communications. 2017 Mar 3;8(1):1-1.
Figures