2705
Linearity of the task-evoked negative BOLD response from the Default mode network regions1Biomedical Engineering, Columbia University, New York, NY, United States, 2Radiology, Weill Cornell Medicine, New York, NY, United States
Synopsis
There is emerging evidence that demonstrate spatial and temporal characteristics of the positive BOLD responses, however, the accompanying negative BOLD responses (NBR) are still under investigation. This is surprising since studies investigating NBR started as early as the introduction of the BOLD-fMRI. While there are limited number of studies that have utilized NBR in the normal aging and Alzheimer’s disease, we feel the NBR has not been used to its full capacity in the field. Recently, within the past two years, the number of publications on NBR has increased, making the timing of this research appropriate.
Introduction
The significance of task-evoked negative BOLD response (NBR), often referred to as deactivation, in the Default mode network (DMN) regions is the research focus in many recent studies of both healthy and clinical populations.1-6 The most commonly used method for extracting task-evoked BOLD responses from the fMRI data, general linear modeling (GLM)7, is based on an underlaying assumption that the brain’s hemodynamic mechanism is a linear-time-invariant system. While numerous exiting studies report the linearity of the positive BOLD response (PBR)8-10, studies investigating the linearity of the NBR are rare. Here, we aim to show whether the magnitude of the task-evoked NBR extracted from the DMN regions changes linearly with the increase and/or decrease in duration of the stimulus. Without this validation, interpreting study results employing GLM to extract NBR would be challenging if not impossible.Methods
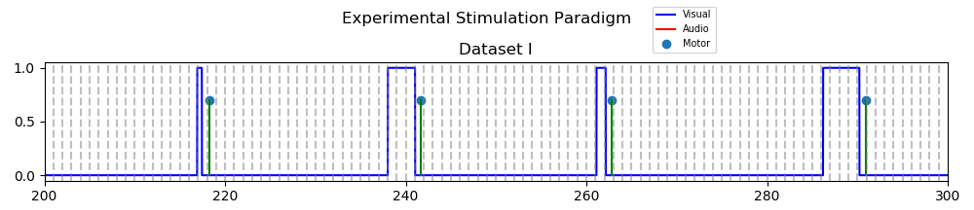
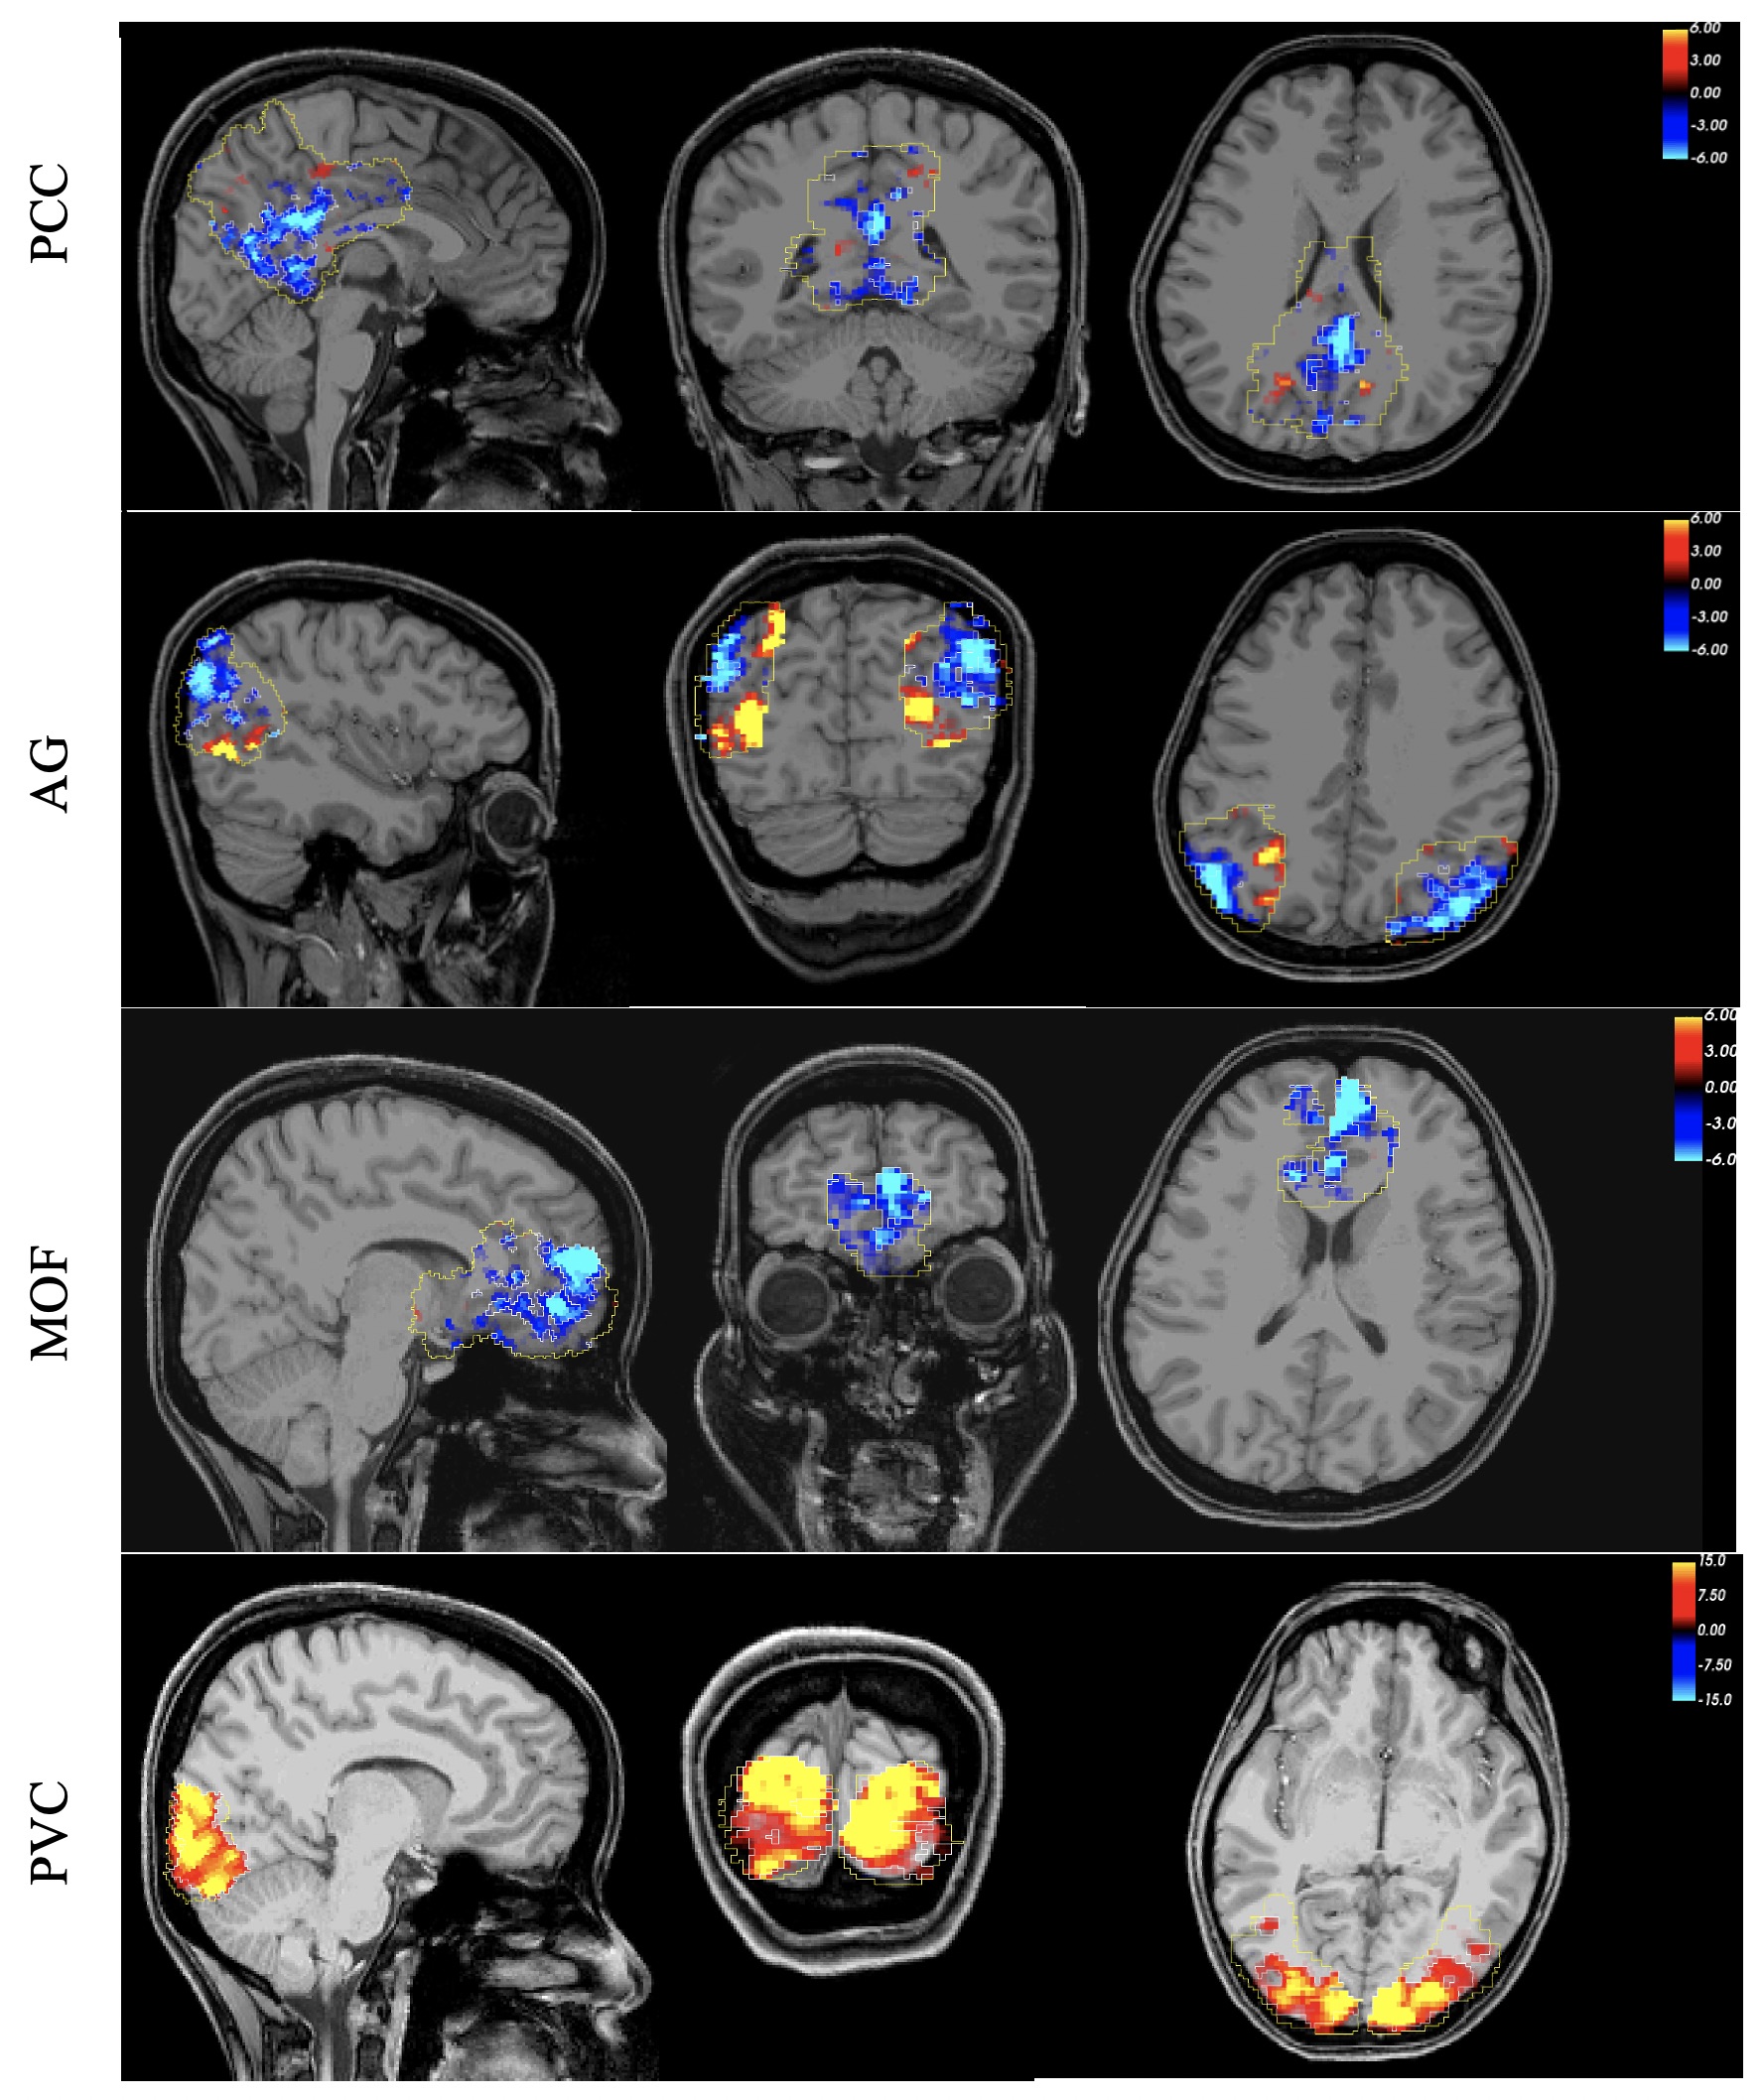
Forty-two healthy and right-handed subjects were scanned using an event-related fMRI paradigm with a circular checkerboard alternating at 6 Hz with 100% contrast. Long Inter-stimulus intervals (sampled uniformly between 18 ~ 26 seconds) were chosen to be able to simply average the fMRI time-series aligned at the onset for each duration and generate a mean time-series of the selected voxels from each region. Event durations were selected randomly from a fixed set {0.5, 1, 2, 3, 4} seconds; but counter-balanced to include exactly five events with each duration adding up to 25 events in total. To ascertain the participant’s engagement in the task, they were asked to press a button twice with their right index figure as soon as each visual stimulus terminated. Figure 1 shows the time-course of the events in this fMRI experiment.All participant’s structural T1-weighted MRI scans were reconstructed using Freesurfer11,12 to get binary masks of the DMN regions and primary visual cortex (PVC); 1) PCC: posterior cingulate, Isthmus cingulate, and precuneus, 2) AG: inferior parietal, and 3) MOF: medial-orbito-frontal, and rostral anterior cingulate, and 4) PVC: lateral occipital.Functional images were preprocessed by FSL5 and inhouse developed techniques. Briefly, a) slice timing correction using an in-house developed method13,14, b) spatial realignment using mcfilrt, c) temporal low-pass (<0.2 Hz) and high-pass (>0.01) filtering, d) spatial smoothing with 5mm Gaussian kernel, e) scrubbing for framewise displacement > 1 mm.15
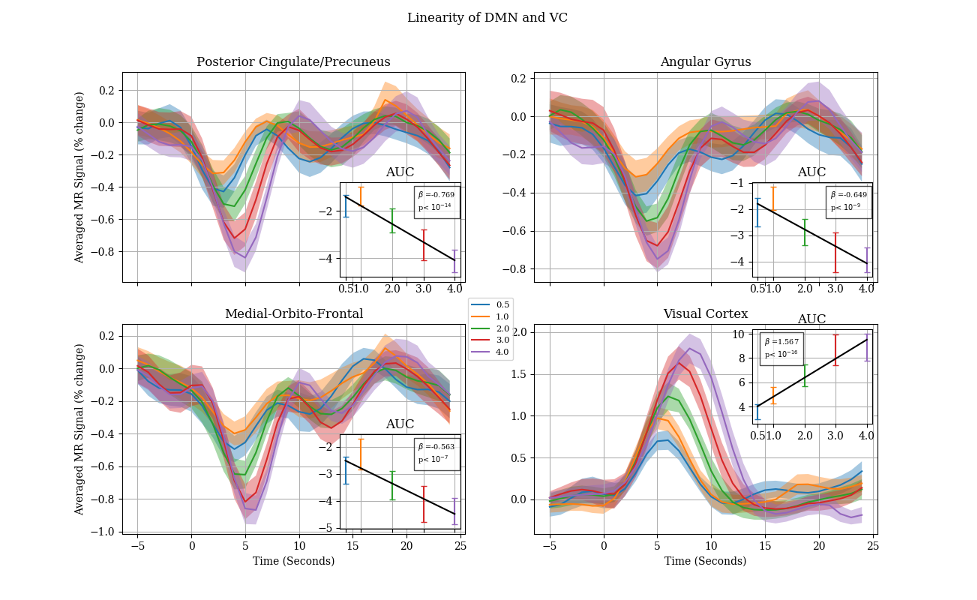
To delineate responsive voxels within each region, we compared the mean amplitude of the fMRI signal prior to the stimulus onset (5 seconds prior) to its amplitude after stimulus onset (10 second after) using Student t-test (t < -4, p>0.001). Once the negatively responsive voxels were determined in each node of the DMN, the 30-second-long segments of fMRI timeseries (from 5 second prior to 25 second after stimuli onset) were extracted for each event and averaged separately for each stimuli duration (0.5, 1, 2, 3, and 4 second). The mean subject-wise time-course were reported as the final response for each stimuli duration along with the 95% confidence interval. Area under the curve (AUC) is calculated for each duration by taking the integral of the signal from 0 to 10 seconds.
Results
Figure 2 shows the typical spatial patterns of NBR and PBR in the DMN regions and PVC. As shown, the responsive voxels can be detected in both positive and negative BOLD regions as expected. Results of linearity analysis are shown in Figure 3, consisting of graphs of averaged temporal dynamic of MR signal for each stimulus duration separately. The shaded area represents the 95% confidence interval. This figure shows that all DMN regions are exhibiting linear behavior in their BOLD response magnitude in almost the same way as it was expected in the visual cortex. Similarly, the PBR in the PVC exhibited a significant linearity between the magnitude of the PBR and duration of the stimuli (β=1.567, p<10-18). Furthermore, NBR also demonstrated a significant linear relationship with regards to stimulus duration for all regions of the DMN (PCC: β=-0.769, p<10-14; AG: β=-0.649, p<10-9; MOF: β=-0.563 p<10-7).Discussion
As it seen in Figure 1, none of the DMN regions shows a significant increase in the magnitude of the NBR for one second stimuli in comparison to the half a second stimuli. This is an intriguing finding since the PBR shows strong linearity between the same stimulus durations. This finding highlights the possibility that neural and/or vascular mechanisms underlying NBR might be different for short (<1 second) versus longer (>1 second) duration stimuli. However, this finding should be taken with a grain of caution, due to the extremely small magnitude of the NBR signal in the shorter ranges of the stimulus duration. Future investigation is required focusing on stimulus durations shorter than one second with a higher signal to noise ration to be able to provide more convincing evidence for the lack of linearity in stimulus for durations shorter than one second.Conclusion
Our results support the hypothesis that the linearity holds for the task-evoked negative BOLD response in the DMN regions at least for stimulus durations lasting longer than 1 second. Since most of the cognitive tasks employed in clinical and research fMRI experiments take longer than one second, we feel confident reporting that the use of GLM for extracting task-evoked NBR in such studies is valid.Acknowledgements
No acknowledgement found.References
1. C. Lustig et al., “Functional deactivations: change with age and dementia of the Alzheimer type.,” Proc. Natl. Acad. Sci. U. S. A., vol. 100, no. 24, pp. 14504–9, 2003.
2. J. Persson, C. Lustig, J. K. Nelson, and P. A. Reuter-Lorenz, “Age differences in deactivation: A link to cognitive control?,” J. Cogn. Neurosci., vol. 19, no. 6, pp. 1021–1032, 2007.
3. J. R. Petrella, S. E. Prince, L. Wang, C. Hellegers, and P. M. Doraiswamy, “Prognostic value of posteromedial cortex deactivation in mild cognitive impairment,” PLoS One, vol. 2, no. 10, 2007.
4. D. P. Kennedy, E. Redcay, and E. Courchesne, “Failing to deactivate: Resting functional abnormalities in autism,” Proc. Natl. Acad. Sci., vol. 103, no. 21, pp. 8275–8280, 2006.
5. R. L. Buckner, J. R. Andrews-Hanna, and D. L. Schacter, “The brain’s default network: Anatomy, function, and relevance to disease,” Ann. N. Y. Acad. Sci., vol. 1124, no. 1, pp. 1–38, Mar. 2008.
6. S. J. Broyd, C. Demanuele, S. Debener, S. K. Helps, C. J. James, and E. J. S. Sonuga-Barke, “Default-mode brain dysfunction in mental disorders: a systematic review.,” Neurosci. Biobehav. Rev., vol. 33, no. 3, pp. 279–96, 2009
7. Richard S.J. Frackowiak, Karl J. Friston, Christopher D. Frith, Raymond J. Dolan, Cathy J. Price, Semir Zeki, John T. Ashburner, William D. Penny, “Analysis of fMRI Time Series: Linear Time-Invariant Models, Event-Related fMRI, and Optimal Experimental Design, Human Brain Function (Second Edition), Pages 793-822, Academic Press, 2004,
8. Boynton, G. M., Engel, S. A., Glover, G. H., & Heeger, D. J. (1996). Linear systems analysis of functional magnetic resonance imaging in human V1. The Journal of Neuroscience, 16 (13) 4207-4221
9. Dale AM, Buckner RL. Selective averaging of rapidly presented individual trials using fMRI. Hum Brain Mapp. 1997;5(5):329-40.
10. Huettel SA, McCarthy G. Evidence for a refractory period in the hemodynamic response to visual stimuli as measured by MRI. Neuroimage. 2000 May;11(5 Pt 1):547-53. doi: 10.1006/nimg.2000.0553. PMID: 10806040.
11. Fischl, B., H Salat, D., Busa, E., Albert, M., Dieterich, M., & Haselgrove, C. (2002). Whole brain segmentation: automated labeling of neuroanatomical structures in the human brain. Neuron, 33, 341–355.
12. Fischl, B., Van Der Kouwe, A., Destrieux, C., Halgren, E., Ségonne, F., Salat, D. H., Busa, E., Seidman, L. J., Goldstein, J., Kennedy, D., Caviness, V., Makris, N., Rosen, B., & Dale, A. M. (2004). Automatically parcellating the human cerebral cortex. Cerebral Cortex, 14(1), 11–22.
13. Parker, D., Liu, X., & Razlighi, Q. R. (2016). Optimal slice timing correction and its interaction with fMRI parameters and artifacts. Medical Image Analysis, 35, 434–445.
14. Parker, D. B., & Razlighi, Q. R. (2019). The benefit of slice timing correction in common fMRI preprocessing pipelines. Frontiers in Neuroscience, 13(JUL).
15. Power, J. D., Barnes, K. a, Snyder, A. Z., Schlaggar, B. L., & Petersen, S. E. (2012). Spurious but systematic correlations in functional connectivity MRI networks arise from subject motion. NeuroImage, 59(3), 2142–2154.
Figures