2702
Multiscale sample entropy analysis of resting-state and task fMRI1Biomedical Engineering, Georgia Institute of Technology, Atlanta, GA, United States
Synopsis
Sample entropy can be used to assess BOLD signal complexity and predictability in resting-state and task fMRI. Task-relevant brain regions tend to display significantly lower entropy than less relevant regions. This trend appears most distinctly in tasks that involve cortical structures, such as a motor task involving the motor cortex, as opposed to tasks that involve subcortical nuclei, such as an emotion task involving the amygdala. Additionally, there is a strong negative correlation between BOLD signal amplitude and entropy that appears only in task-based fMRI, indicating that BOLD signal, as recruited by a task, becomes more predictable as amplitude increases.
Introduction
Blood-oxygenation-level-dependent (BOLD) signal is commonly used as a tool to measure neural activity in both resting- and task-state fMRI. However, typical BOLD signal analysis only provides information as to the presence and amplitude of activation at any point in time, not the complexity of the underlying signal. Quantifying the complexity of signal for different regions and networks in the brain would allow for insight into the characteristics of different brain states. However, in order to examine signal complexity, new analytical techniques must be used.Within biological signals, entropy, or disorderliness in a system, indicates how predictable a signal is1. This lends itself to complexity analysis of fMRI, where entropy has been used in analysis of both resting-state and basic task-state fMRI1,2. Sample entropy (SampEn) is a particular technique for calculation of entropy that relies on fewer time points than typical entropy calculations, allowing for more accurate values for shorter time series (such as fMRI scans, which typically have no more than 1,000 time points)3. In order to develop a greater understanding of the complexity of brain signal during both task- and resting-state fMRI, we calculated SampEn across several tasks and resting-state scans to determine correlation between BOLD signal amplitude and entropy. Our preliminary findings indicate a negative correlation between BOLD signal amplitude and entropy, with brain regions more salient to a task having significantly low entropy as compared to brain regions not involved in a task.
Methods
We examined the SampEn of a resting-state and seven task scans for 412 subjects, as retrieved from the Human Connectome Project4. Two runs were acquired for each task within each subject, with TR = 720 ms and TE = 33.1 ms. The task topics included emotion, language, sensorimotor, gambling/risk-taking, relational processing, social processing, combination working memory/category-specific representation, and rest. Once retrieved, the scans were global-signal regressed. Within each task, fMRI volumes were divided into 246 parcels based on the Brainnetome Atlas parcellation method, allowing for parcel-wise analysis rather than voxel-wise analysis5.Within each task and resting-state scan, the SampEn of each individual parcel within each subject was calculated using MATLAB, with a combination of home-designed code and code from MATLAB File Exchange6. Then, SampEn was averaged across all subjects to yield one value of entropy for each parcel within each task. The z-score of each parcel was calculated, and parcels with a z-score magnitude higher than 1.96 (p < 0.05) were noted as having significantly high or low entropy.
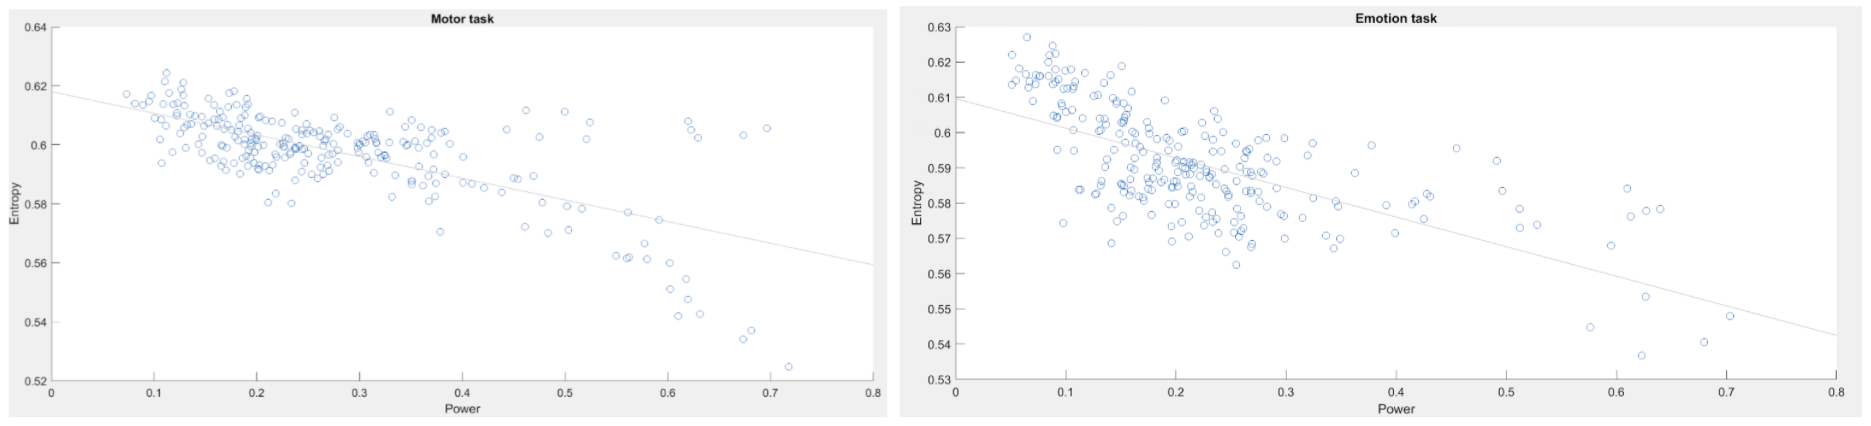
Additionally, the BOLD signal power for each parcel was calculated, with the time series standard deviation serving as an indication of relative amplitude/power. For each task, parcel power vs. entropy was examined to determine correlation.
Results and Discussion
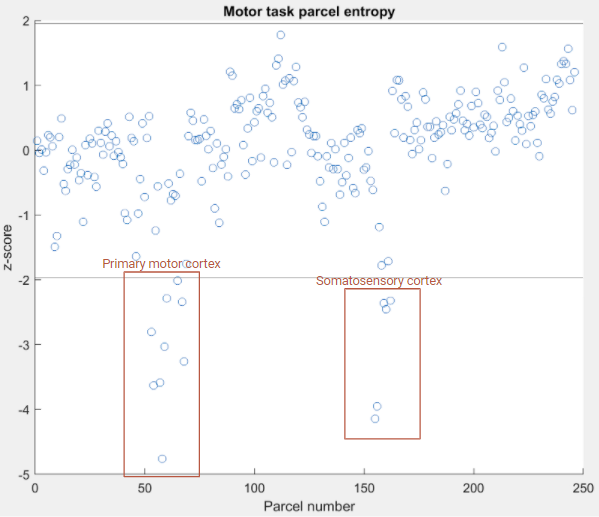
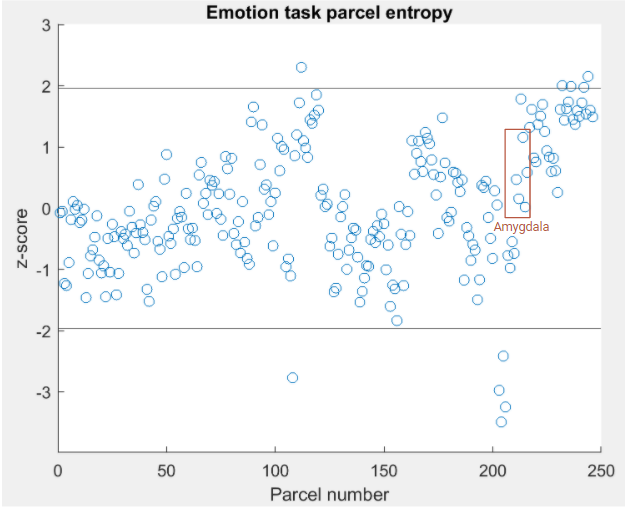
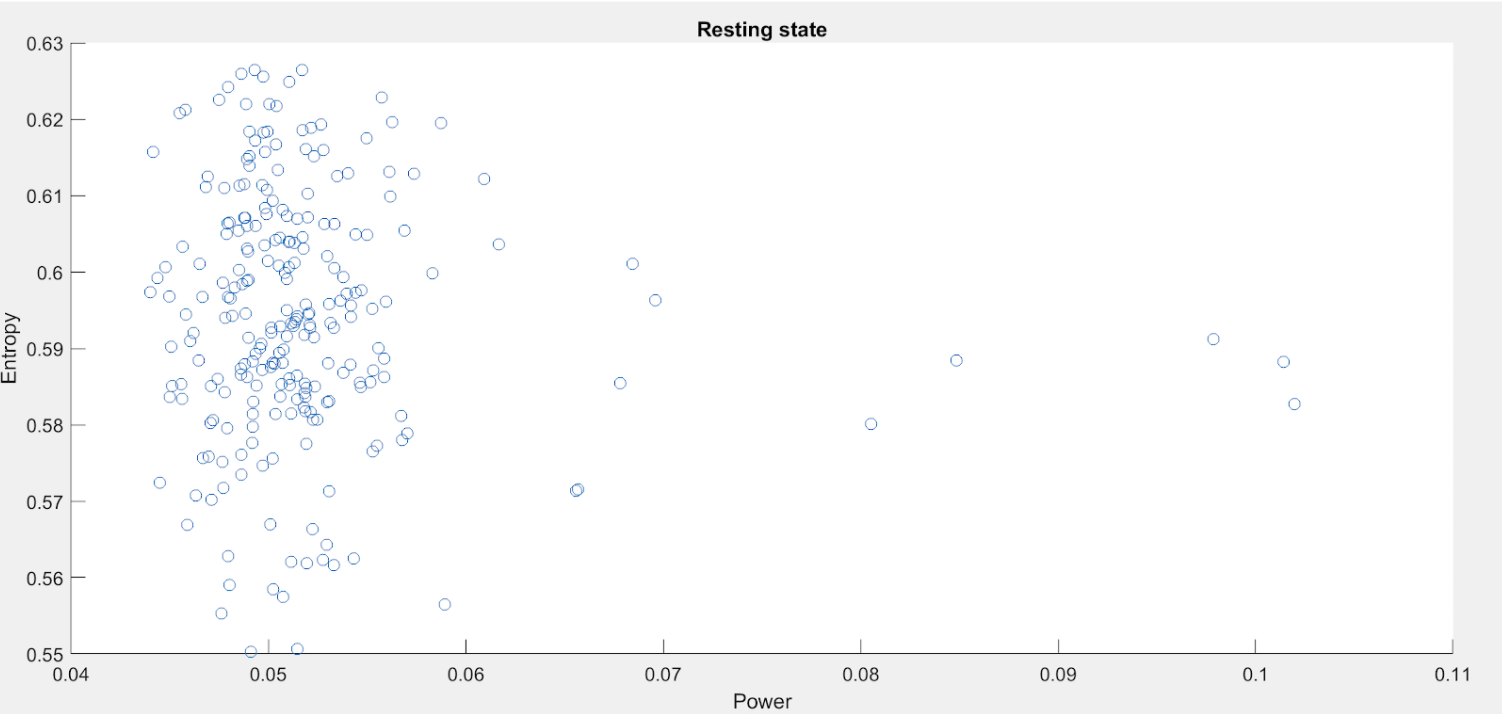
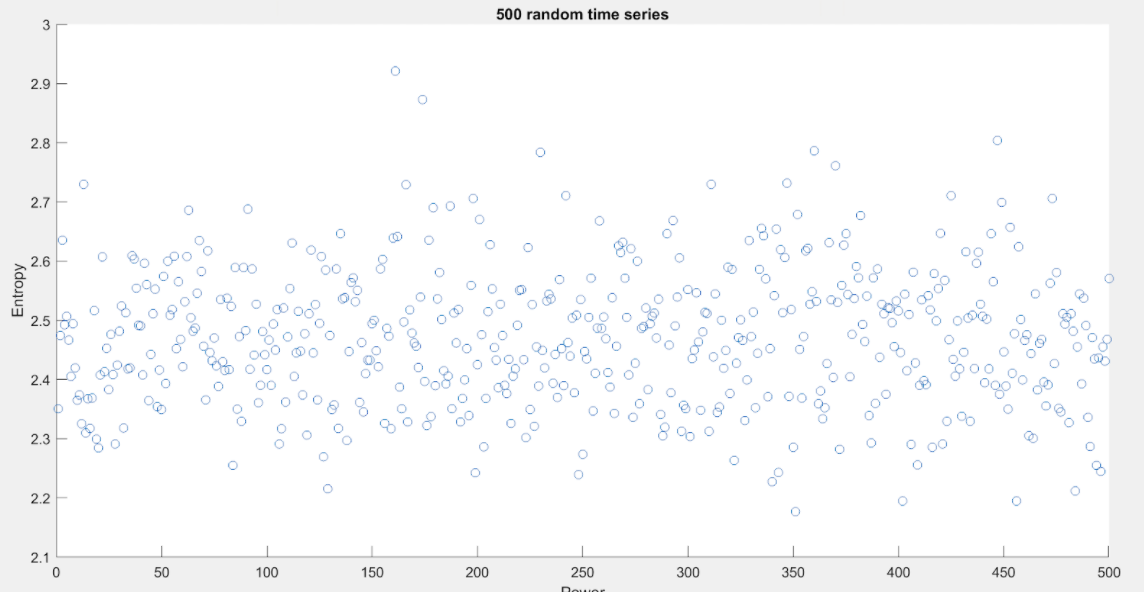
For most tasks, parcels that corresponded to brain regions that were relevant to the task had significantly low entropy as compared to regions that were less relevant to that task, as determined by predicted areas of activation found in literature. This finding was stronger in tasks where areas of activation were expected to be cortical regions, such as the sensorimotor task (where primary motor and sensory cortices were expected to be salient7) (Fig. 1), as opposed to tasks where areas of interest were subcortical regions, such as the emotion task (where amygdala activation was expected7) (Fig. 2).Additionally, for all task scans, there was a strong negative correlation between BOLD signal amplitude and entropy for all parcels (Fig. 3). This correlation did not appear in the resting-state scan (Fig. 4) or in a series of 500 randomly-generated datasets (Fig. 5), each of which consisted of a series of 500 random numbers generated by MATLAB and each multiplied by an integer factor between one and 500. The length was chosen to be comparable to the length of a task-state fMRI scan.
The indication of significantly low entropy for regions of interest across several task-based fMRI scans indicates that brain regions recruited for a task tend to have a signal that is more predictable than brain regions that are less relevant to that task. There was also a strong negative correlation between the amplitude of BOLD signal in a brain region and the entropy of that region. Because of the complete lack of correlation between amplitude and entropy in the resting-state scan and the set of randomly-generated time series, this suggests that the correlation between amplitude and entropy in task-state data is not a feature of SampEn; rather, it is an inherent feature of task-state fMRI.
Conclusion
We explored sample entropy as a methodology for analyzing BOLD signal complexity in task- and resting-state fMRI. For most tasks, brain regions that were relevant to the task at hand displayed significantly low levels of entropy as compared to the baseline; this finding was more prevalent in brain regions where cortical activation was expected, as compared to subcortical nuclei activation. Additionally, for all task-state fMRI, there was a strong negative correlation between BOLD signal amplitude and entropy. This correlation was not present in the resting-state scan or a set of random data generated to mimic time series of differing amplitudes. This suggests that the correlation between amplitude and entropy is a feature inherent to task-state fMRI.Acknowledgements
This work was supported by the National Science Foundation BCS INSPIRE 1533260, National Institutes of Health R01NS078095 and 1R01MH111416-01. Data were provided by the Human Connectome Project, WU-Minn Consortium (Principal Investigators: David Van Essen and Kamil Ugurbil; 1U54MH091657) funded by the 16 NIH Institutes and Centers that support the NIH Blueprint for Neuroscience Research; and by the McDonnell Center for Systems Neuroscience at Washington University.References
1. Nezafati, M; Temmar, H; Keilholz, SD. (2020). Functional MRI signal complexity analysis using sample entropy. Frontiers in Neuroscience, 14(700). doi:10.3389/fnins.2020.00700
2. Wang, Z; Li, Y; Childress, AR; Detre, JA. (2014). Brain entropy mapping using fMRI. PLoS ONE 9(3); e89948. doi:10.1371/journal.pone.0089948
3. Richman, JS; Moorman JR. (2000). Physiological time-series analysis using approximate entropy and sample entropy. Am J Physiol Heart Circ Physiol, 278(6); H2039-49. doi:10.1152/ajpheart.2000.278.6.H2039
4. VanEssen, DC; Ugurbil, K; Auerbach, E; Barch, D; Behrens, TEJ; Bucholz, R; ... Yacoub, E. (2012). The Human Connectome Project: A data acquisition perspective. NeuroImage, 62(4), 2222–2231. doi:10.1016/j.neuroimage.2012.02.018
5. Fan, L; Li, H; Zhuo, J; Zhang, Y; Wang, J; Chen, L; … Jiang, T. (2016). The Human Brainnetome Atlas: A new brain atlas based on connectional architecture. Cerebral Cortex, 26(8); 3508-3526. doi:10.1093/cercor/bhw157
6. John Malik (2020). Multiscale Sample Entropy (https://www.mathworks.com/matlabcentral/fileexchange/62706-multiscale-sample-entropy), MATLAB Central File Exchange. Retrieved December 12, 2020.
7. Drobyshevsky, A; Baumann, S; Schneider, W. (2006). A rapid fMRI task battery mapping of visual, motor, cognitive, and emotional function. Neuroimage, 31(2); 732-44. doi:10.1016/j.neuroimage.2005.12.016
Figures