2699
Biologically-driven cerebellar neural mass model for improving BOLD signal simulations1Department of Brain and Behavioral Sciences, University of Pavia, Pavia, Italy, 2NMR Research Unit, Queen Square MS Centre, Department of Neuroinflammation, UCL Queen Square Institute of Neurology, Faculty of Brain Sciences, University College London (UCL), London, United Kingdom, 3Brain Connectivity Centre Research Department, IRCCS Mondino Foundation, Pavia, Italy
Synopsis
Whole-brain activity can be simulated as a collection of BOLD signals by solving mathematical models representing neuronal circuitry organization of different brain regions. The cerebellum strongly contributes to the whole-brain dynamics. We present the formalism for a mean-field model reproducing cerebellar physiological properties, which model-core is the transfer function transforming neurons spiking-patterns into time-continuous global activity. Combined with other models integrated in simulators, like DCM (Dynamic Causal Modeling) and TVB (The Virtual Brain), our cerebellar network will allow to investigate neuronal functions at the origin of macroscopic hemodynamic properties captured by BOLD.
Introduction
Simulation of brain activity is a fast-growing neuroscience field thanks to its potential research and clinical applications. The brain is characterized by several interconnected networks that differently contribute to generate its global dynamic activity; therefore, simulating such dynamics is a challenge that has to be addressed at different scales. MRI represents the macroscale level providing subject-specific empirical functional and structural information. This whole-brain activity can be simulated as a collection of Blood Oxygenation Level Dependent (BOLD) signals by solving mathematical models representing the neuronal circuitry organization of different brain regions. These models are often only inspired by the biophysical substrates of different brain regions, rather than being reconstructed to match experimentally recorded signals. Data-driven realistic multiscale brain models are therefore currently being developed to increase regional fidelity and lead to more accurate simulations of whole-brain dynamics. Current tools to assess brain dynamics use mean-field and neural mass models that are repeated equally through grey matter regions. Initial attempts to differentiate such models have been proposed for cortical regions and subcortical regions, e.g. in Dynamic Causal Modeling (DCM)1,2, but not for cerebellar regions. The cerebellar circuit organization is peculiar and markedly differs from that of the cerebral cortex. Furthermore, the cerebellum contains about 50% of all brain neurons, is deeply interconnected with the rest of the brain and remarkably contributes to generate whole-brain dynamics3. Indeed, resting state and task-dependent fMRI studies confirm that the cerebellum is functionally connected to the cerebral cortex both at rest and during task executions4–6. Here we present a model of the cerebellum specifically tailored to reproduce its biological and physiological properties using the mean-field formalism, which models the activity of a network as a statistical summary of a biologically realistic spiking network activity7,8.Methods
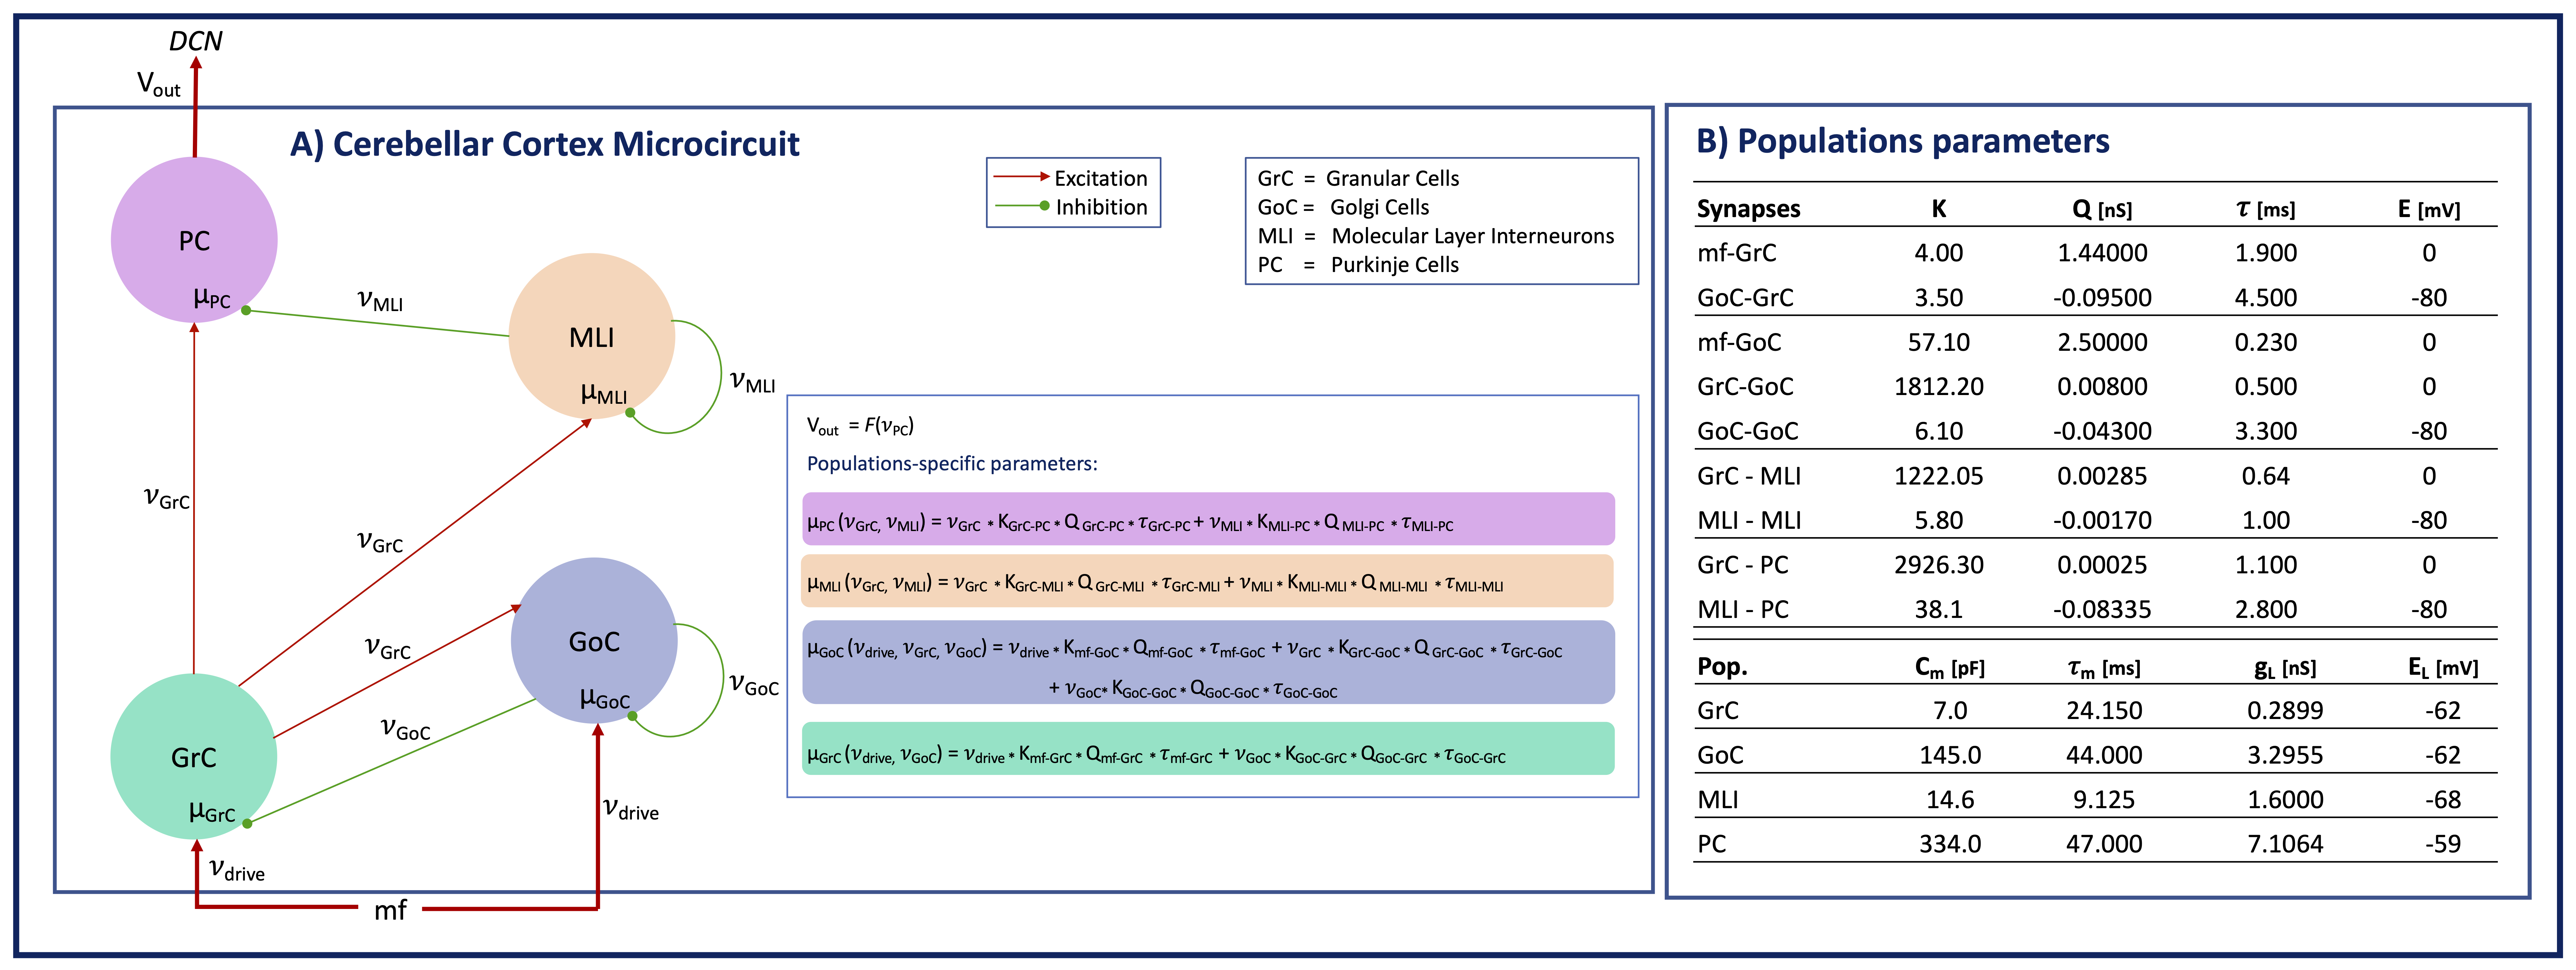
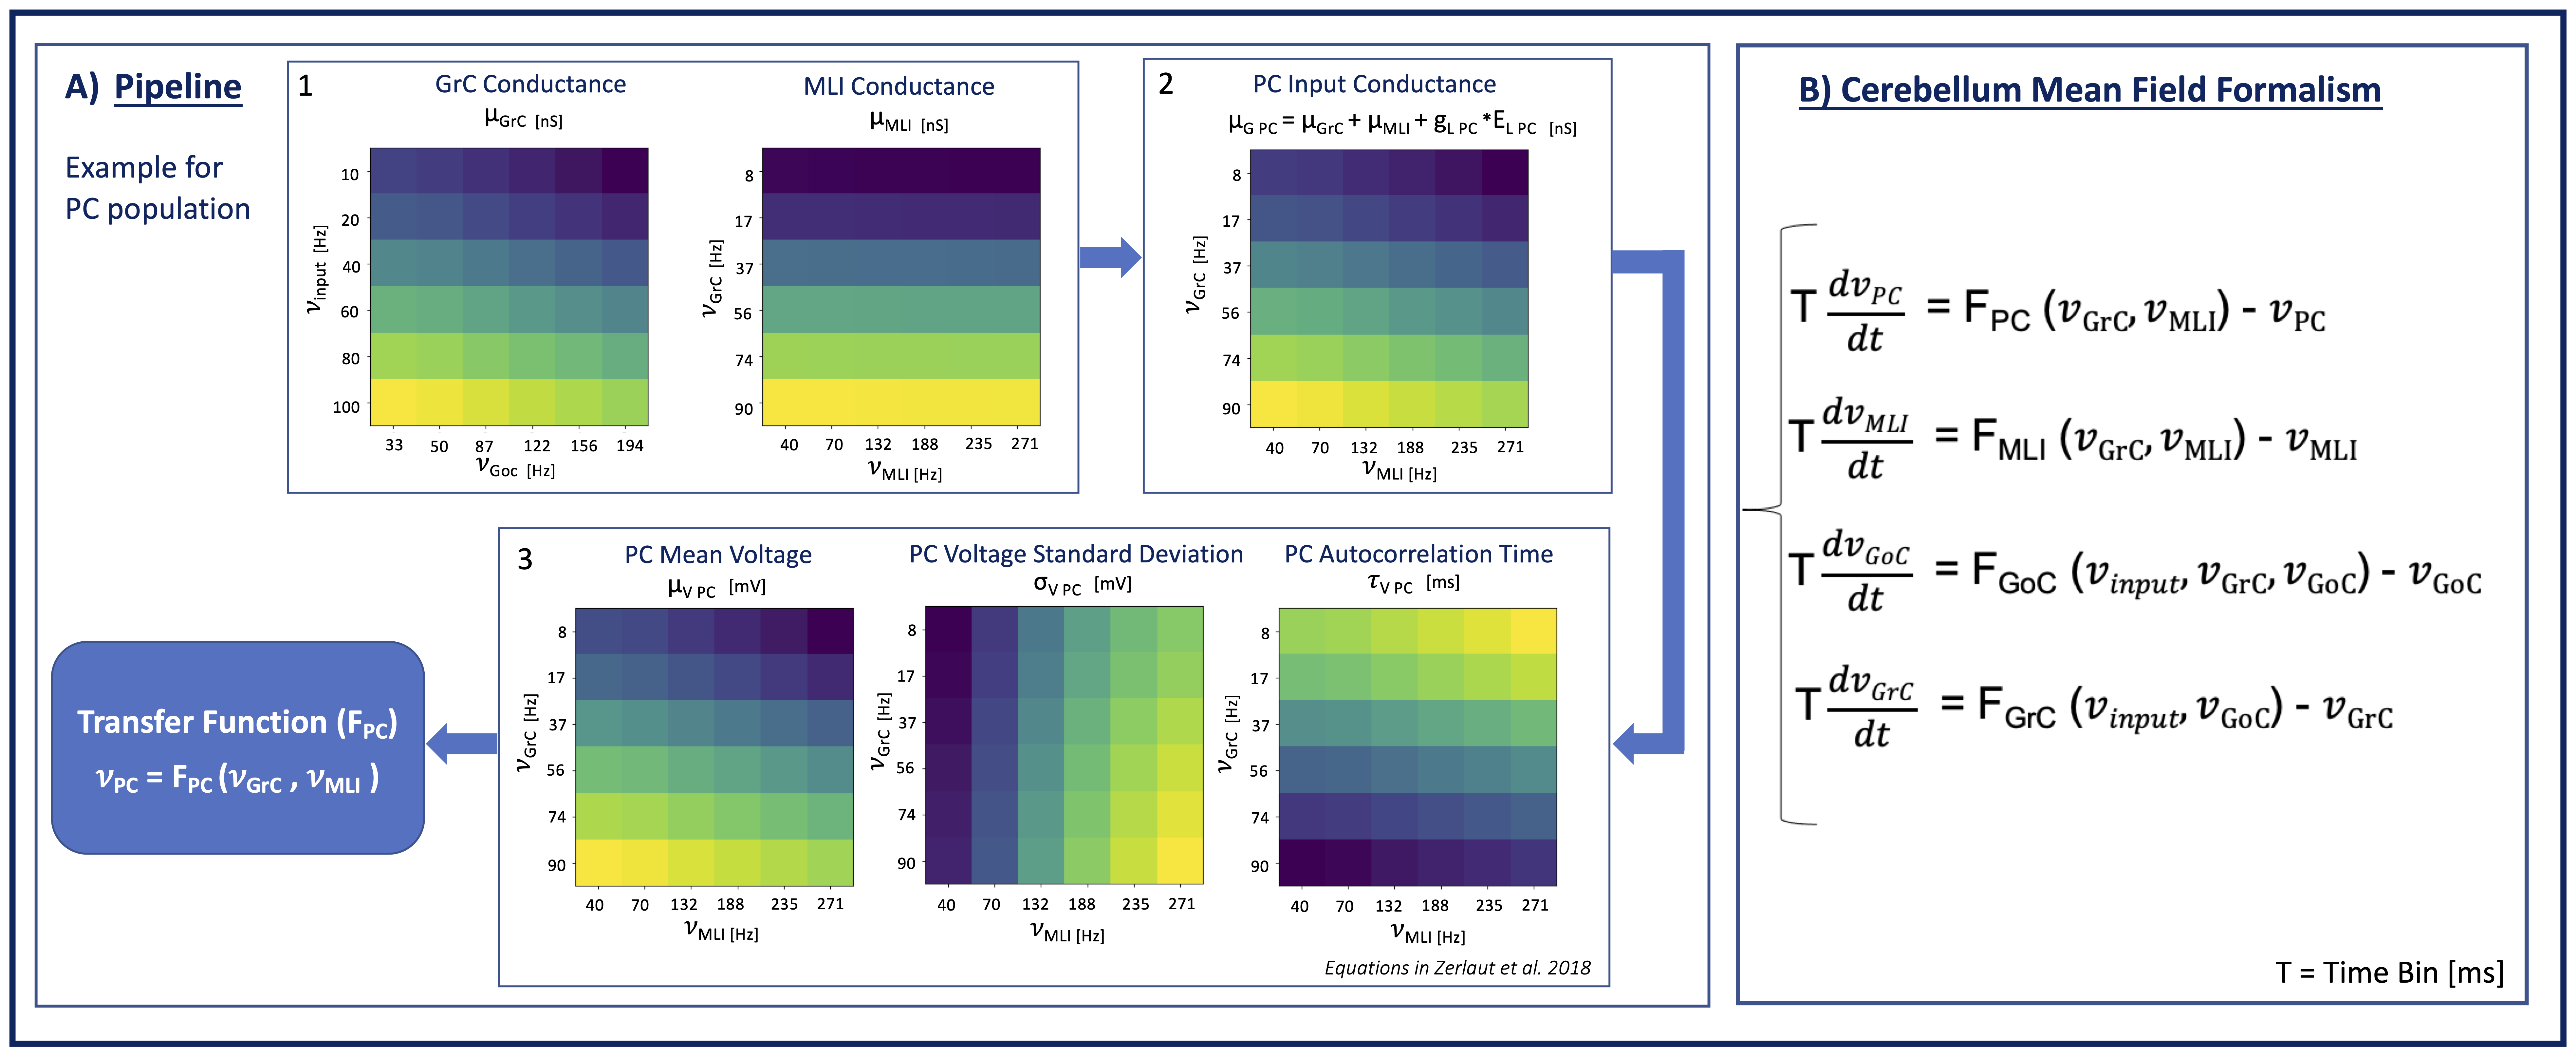
The design of the cerebellar mean-field model starts from an accurate and extensive knowledge of cerebellar anatomy and physiology. The model includes the main neuronal populations of the cerebellar cortex, i.e. Granular Cells (GrC), Golgi Cells (GoC), Molecular Layer Interneurons (MLI) and Purkinje Cells (PC), and their connections. Connections between these neuronal populations include excitatory, inhibitory or self-inhibitory synapses (Figure1). Furthermore, we account for the multi-layer organization of the cerebellar cortex, where GrC and PC layers are the input and output layers, respectively9. GrCs and GoCs receive, through mossy fibers (mf), external synaptic inputs (𝜈input) coming from other brain areas9. Population-specific firing frequencies and synaptic connection parameters, estimated from scaffold model approaches10,11 are used to calculate the conductance for each cell population and are considered the reference for following simulations of brain activity. A Transfer Function (F) mathematical formalism7 is used to transform population-specific spiking patterns into a time-continuous global activity. This approach is inspired to that already validated for the implementation of mean-field models of isocortical circuits made of excitatory and inhibitory neurons12–14. Here, the mean-field F formalism accounts also for the physiological diversification of cerebellar neuronal populations and for their topological organization. Six different stationary 𝜈input (10,20,40,60,80,100 Hz) are used to generate reference spiking activity and for fitting the Fs.Results
Figure 1 shows the model structure and the conductance equation for each population of cells with the explicit dependencies from the synaptic parameters K, Q and 𝜏 (K = connections probability*cells numbers, Q = quantal synaptic conductance and 𝜏 = synaptic time decay; values in Figure 1B). Figure 2A shows our pipeline to compute F for PC. Each color-map shows the behavior of parameters used for F fitting for either excitatory (𝜈GrC) and inhibitory input activity (𝜈MLI) to PC. The pipeline is extended to other populations. The final cerebellar mean-field formalism is reported in Figure 2B.Discussion and Conclusion
This work aims, for the first time, to implement a model of cerebellar mean-field able to reproduce its populations dynamics. With other region-specific models, already integrated in the DCM formalism, it paves the way for investigating neuronal microcircuit functions at the origin of macroscopic hemodynamic properties as captured by the BOLD signal. The strength of our model is the bottom-up approach. The output activity depends on the microcircuit structure and on detailed models of neurons synapsis15,16, all validated in existing computational networks. Compared to existing mean-field models, our cerebellar network is built up considering specific structural and functional interactions of neuronal populations in the cerebellum. Our preliminary simulations show a realistic trend of populations conductance, which is translated into a realistic behavior of membrane fluctuation properties (μV, σV, 𝜏V). Here we propose the first cerebellar mean field model, realistically built from physiological knowledge of neuronal populations and synapsis. Future steps will integrate our model into DCM11,20 to investigate the cerebellum impact on simulated BOLD signal in cerebellar-related pathologies like ataxia and autism. Once an interconnected set of cerebellar modules are built and validated, they will be mapped on brain atlases and integrated in brain dynamic simulators, such as The Virtual Brain (TVB)17,18, in order to exploit the long-range human connectome. Our recent work19 performed simulations of brain activity including the cerebro-cerebellar loop, demonstrating the importance of the cerebellum in whole brain dynamics, without a dedicated mean-field. It will be very important to compare results with those generated with the newly developed realistic cerebellar mean-field model.Acknowledgements
This research received funding by H2020 Research and Innovation Action Grants Human Brain Project 785907 and 945539 (SGA2 and SGA3) and by the MNL Project “Local Neuronal Microcircuits” of the Centro Fermi (Rome, Italy) to ED and FP. CGWK receives funding from the UK MS Society (#77), Wings for Life (#169111), Horizon2020 (CDS-QUAMRI, #634541), BRC (#BRC704/CAP/CGW)
References
1. Friston KJ, Harrison L, Penny W. Dynamic causal modelling. Neuroimage 2003;19(4):1273–1302. DOI: 10.1016/s1053-8119(03)00202-7
2. Van Wijk BCM, Cagnan H, Litvak V, et al. Generic dynamic causal modelling: An illustrative application to Parkinson’s disease. Neuroimage 2018;181(January):818–830. Available from: https://doi.org/10.1016/j.neuroimage.2018.08.039.
3. D’Angelo E. Physiology of the cerebellum. 1st ed. Elsevier B.V.; 2018. Available from: http://dx.doi.org/10.1016/B978-0-444-63956-1.00006-0.
4. Buckner RL. The cerebellum and cognitive function: 25 years of insight from anatomy and neuroimaging. Neuron 2013;80(3):807–815. DOI: 10.1016/j.neuron.2013.10.044
5. Castellazzi G, Bruno SD, Toosy AT, et al. Prominent Changes in Cerebro-Cerebellar Functional Connectivity During Continuous Cognitive Processing. Front. Cell. Neurosci. 2018;12:331. Available from: https://www.frontiersin.org/article/10.3389/fncel.2018.00331.
6. Casiraghi L, Alahmadi AAS, Monteverdi A, et al. I See Your Effort: Force-Related BOLD Effects in an Extended Action Execution–Observation Network Involving the Cerebellum. Cereb. Cortex 2019;29(3):1351–1368. Available from: https://doi.org/10.1093/cercor/bhy322
7. Boustani S El, Destexhe A. A master equation formalism for macroscopic modeling of asynchronous irregular activity states. Neural Comput. 2009;21(1):46–100. DOI: 10.1162/neco.2009.02-08-710
8. Di Volo M, Romagnoni A, Capone C, Destexhe A. Biologically Realistic Mena-Field Models of Conductance-Based Networks of Spiking Neurons with Adaptation. Neural 2019;31:653–680.
9. Gandolfi D, Pozzi P, Tognolina M, et al. The spatiotemporal organization of cerebellar network activity resolved by two-photon imaging of multiple single neurons. Front. Behav. Neurosci. 2014;8(Apr):1–16. Available from: https://doi.org/10.3389/fncel.2014.00092
10. Casali S, Marenzi E, Medini C, et al. Reconstruction and simulation of a scaffold model of the cerebellar network. Front. Neuroinform. 2019;13(May):1–19. Available from: https://doi.org/10.3389/fninf.2019.00037
11. De Schepper R, Al E. The Brain Scaffold Builder, a package for structural and functional modelling of brain circuits: the cerebellar use case. In preparation.
12. Kuhn A, Aertsen A, Rotter S. Neuronal Integration of Synaptic Input in the Fluctuation-Driven Regime. J. Neurosci. 2004;24(10):2345–2356. Available from: https://doi.org/10.1523/JNEUROSCI.3349-03.2004
13. Zerlaut Y, Chemla S, Chavane F, Destexhe A. Modeling mesoscopic cortical dynamics using a mean-field model of conductance-based networks of adaptive exponential integrate-and-fire neurons. J. Comput. Neurosci. 2018;44(1):45–61. DOI: 10.1007/s10827-017-0668-2
14. Zerlaut Y, Destexhe A. Enhanced Responsiveness and Low-Level Awareness in Stochastic Network States. Neuron 2017;94(5):1002–1009. Available from: http://dx.doi.org/10.1016/j.neuron.2017.04.001.
15. Geminiani A, Casellato C, D’Angelo E, Pedrocchi A. Complex electroresponsive dynamics in olivocerebellar neurons represented with extended-generalized leaky integrate and fire models. Front. Comput. Neurosci. 2019;13(June):1–12. Available from: https://doi.org/10.3389/fncom.2019.00035
16. Geminiani A, Casellato C, Locatelli F, et al. Complex dynamics in simplified neuronal models: Reproducing golgi cell electroresponsiveness. Front. Neuroinform. 2018;12(December):1–19. Available from: https://doi.org/10.3389/fninf.2018.00088
17. Sanz-Leon P, Knock SA, Woodman MM, et al. The virtual brain: A simulator of primate brain network dynamics. Front. Neuroinform. 2013;7(May). Available from: https://doi.org/10.3389/fninf.2013.00010
18. Sanz-Leon P, Knock SA, Spiegler A, Jirsa VK. Mathematical framework for large-scale brain network modeling in The Virtual Brain. Neuroimage 2015;111:385–430. Available from: http://dx.doi.org/10.1016/j.neuroimage.2015.01.002.
19. Palesi F, Lorenzi RM, Casellato C, et al. The Importance of Cerebellar Connectivity on Simulated Brain Dynamics. Front. Cell. Neurosci. 2020;14(July):1–11. Available from: https://doi.org/10.3389/fncel.2020.00240
Figures