2697
Improving task fMRI reliability at brain regions of high‐susceptibility using a multi-band PSF-mapping-based reverse-gradient approach1Department of Radiology, Mayo Clinic, Rochester, MN, United States, 2Department of Physiology, College of Medicine, Hanyang University, Seoul, Korea, Republic of, 3Department of Radiologic Technology, Faculty of Associated Medical Sciences, Chiang Mai University, Chiang Mai, Thailand, 4Mayo Clinic Graduate School of Biomedical Sciences, Mayo Clinic, Rochester, MN, United States
Synopsis
Interleaved reverse-gradient fMRI (RG-fMRI) with a PSF mapping-based distortion correction scheme has the potential to minimize the loss of signal in regions of rapid susceptibility change. Recently, multi-band imaging was combined to improve the temporal resolution for RG-fMRI, and the initial feasibility was evaluated in human. In this work, breath-holding task-fMRI was performed with the proposed scheme to demonstrate the effectiveness in improving fMRI reliability for each individual and the entire group, especially in high susceptibility brain regions.
Introduction
A PSF-mapping-based reverse-gradient (PSF-RG) approach can minimize susceptibility-induced artifacts by correcting geometric distortion in a pair of echo-planar-imaging (EPI) data with opposite phase-encoding (PE) gradient polarities and combining them. The efficiency was previously demonstrated in pig’s brain for fMRI during deep-brain-stimulation.1 Initial feasibility for whole-brain human fMRI was tested after adopting multi-band imaging to improve the temporal resolution.2 In this work, breath-holding task-based fMRI was performed in healthy volunteers with the proposed acquisition and correction scheme. fMRI reliability improvements were evaluated for both each individual and at the group level, especially in brain regions of high susceptibility.Methods
After informed consent, breath-holding functional MRI (fMRI) was performed in six healthy volunteers using a 32-channel coil (Nova Medical, USA) on a compact 3T scanner with high-performance gradients (700 T/ms/s, 80 mT/m),3-5 with negligible peripheral nerve stimulation.6 The block paradigm consisted of 5 rest (20 s) and breath-holding (20 s) cycles and ended with a rest period. The PE polarity in each EPI repetition was altered in an interleaved order for the reverse gradient fMRI (RG-fMRI). The imaging protocols were: TR/TE = 1000/30 ms, no partial Fourier, multi-band factor = 6, 79 slices, 2 mm isotropic resolution. Before RG-fMRI scan, a PSF mapping scan with the reverse PE polarity1,7 was performed for distortion calibration with identical imaging parameters as the fMRI, except for TR/TE = 934/24.4 ms. The scan time for fMRI and calibration were 3 minutes 50 seconds and 34 seconds, respectively. Additionally, an anatomical T1 image was obtained with the following parameters: TR/TE/TI = 6/2.5/900 ms, flip angle = 8°, and 1 mm isotropic resolution. After the PSF-based EPI distortion correction,1,7 three different variants of the EPI series including: the distortion-corrected forward and reverse EPIs (DF and DR), and the weighted combination of the distortion-corrected EPI pair (DW) were generated. Co-registration between the functional and the anatomical images with rigid body transform using AFNI software8 was conducted. Segmentation and parcellation of anatomical images were performed using FreeSurfer.9 For the surface-based group comparison, each cortical boundary derived by FreeSurfer was used to convert functional data onto a 3D standard-mesh cortical surface model.10,11 General linear model (GLM)-based blood oxygenation level-dependent (BOLD) contrasts were estimated in each individual and for the entire group. To evaluate the improvements associated with the proposed human task-fMRI studies, the image intensity and functional contrasts in the regions with strong susceptibility artifacts were compared visually and quantitatively across the three different variants of the EPI series. Two-way ANOVA was applied to compare three different variants of the EPI series. To clearly demonstrate the improvements in local BOLD contrasts arising from the improved signal redistribution rather than the increased image SNR due to image combination, signal percentage changes were calculated which were not dominated by SNR.1Results and Discussion
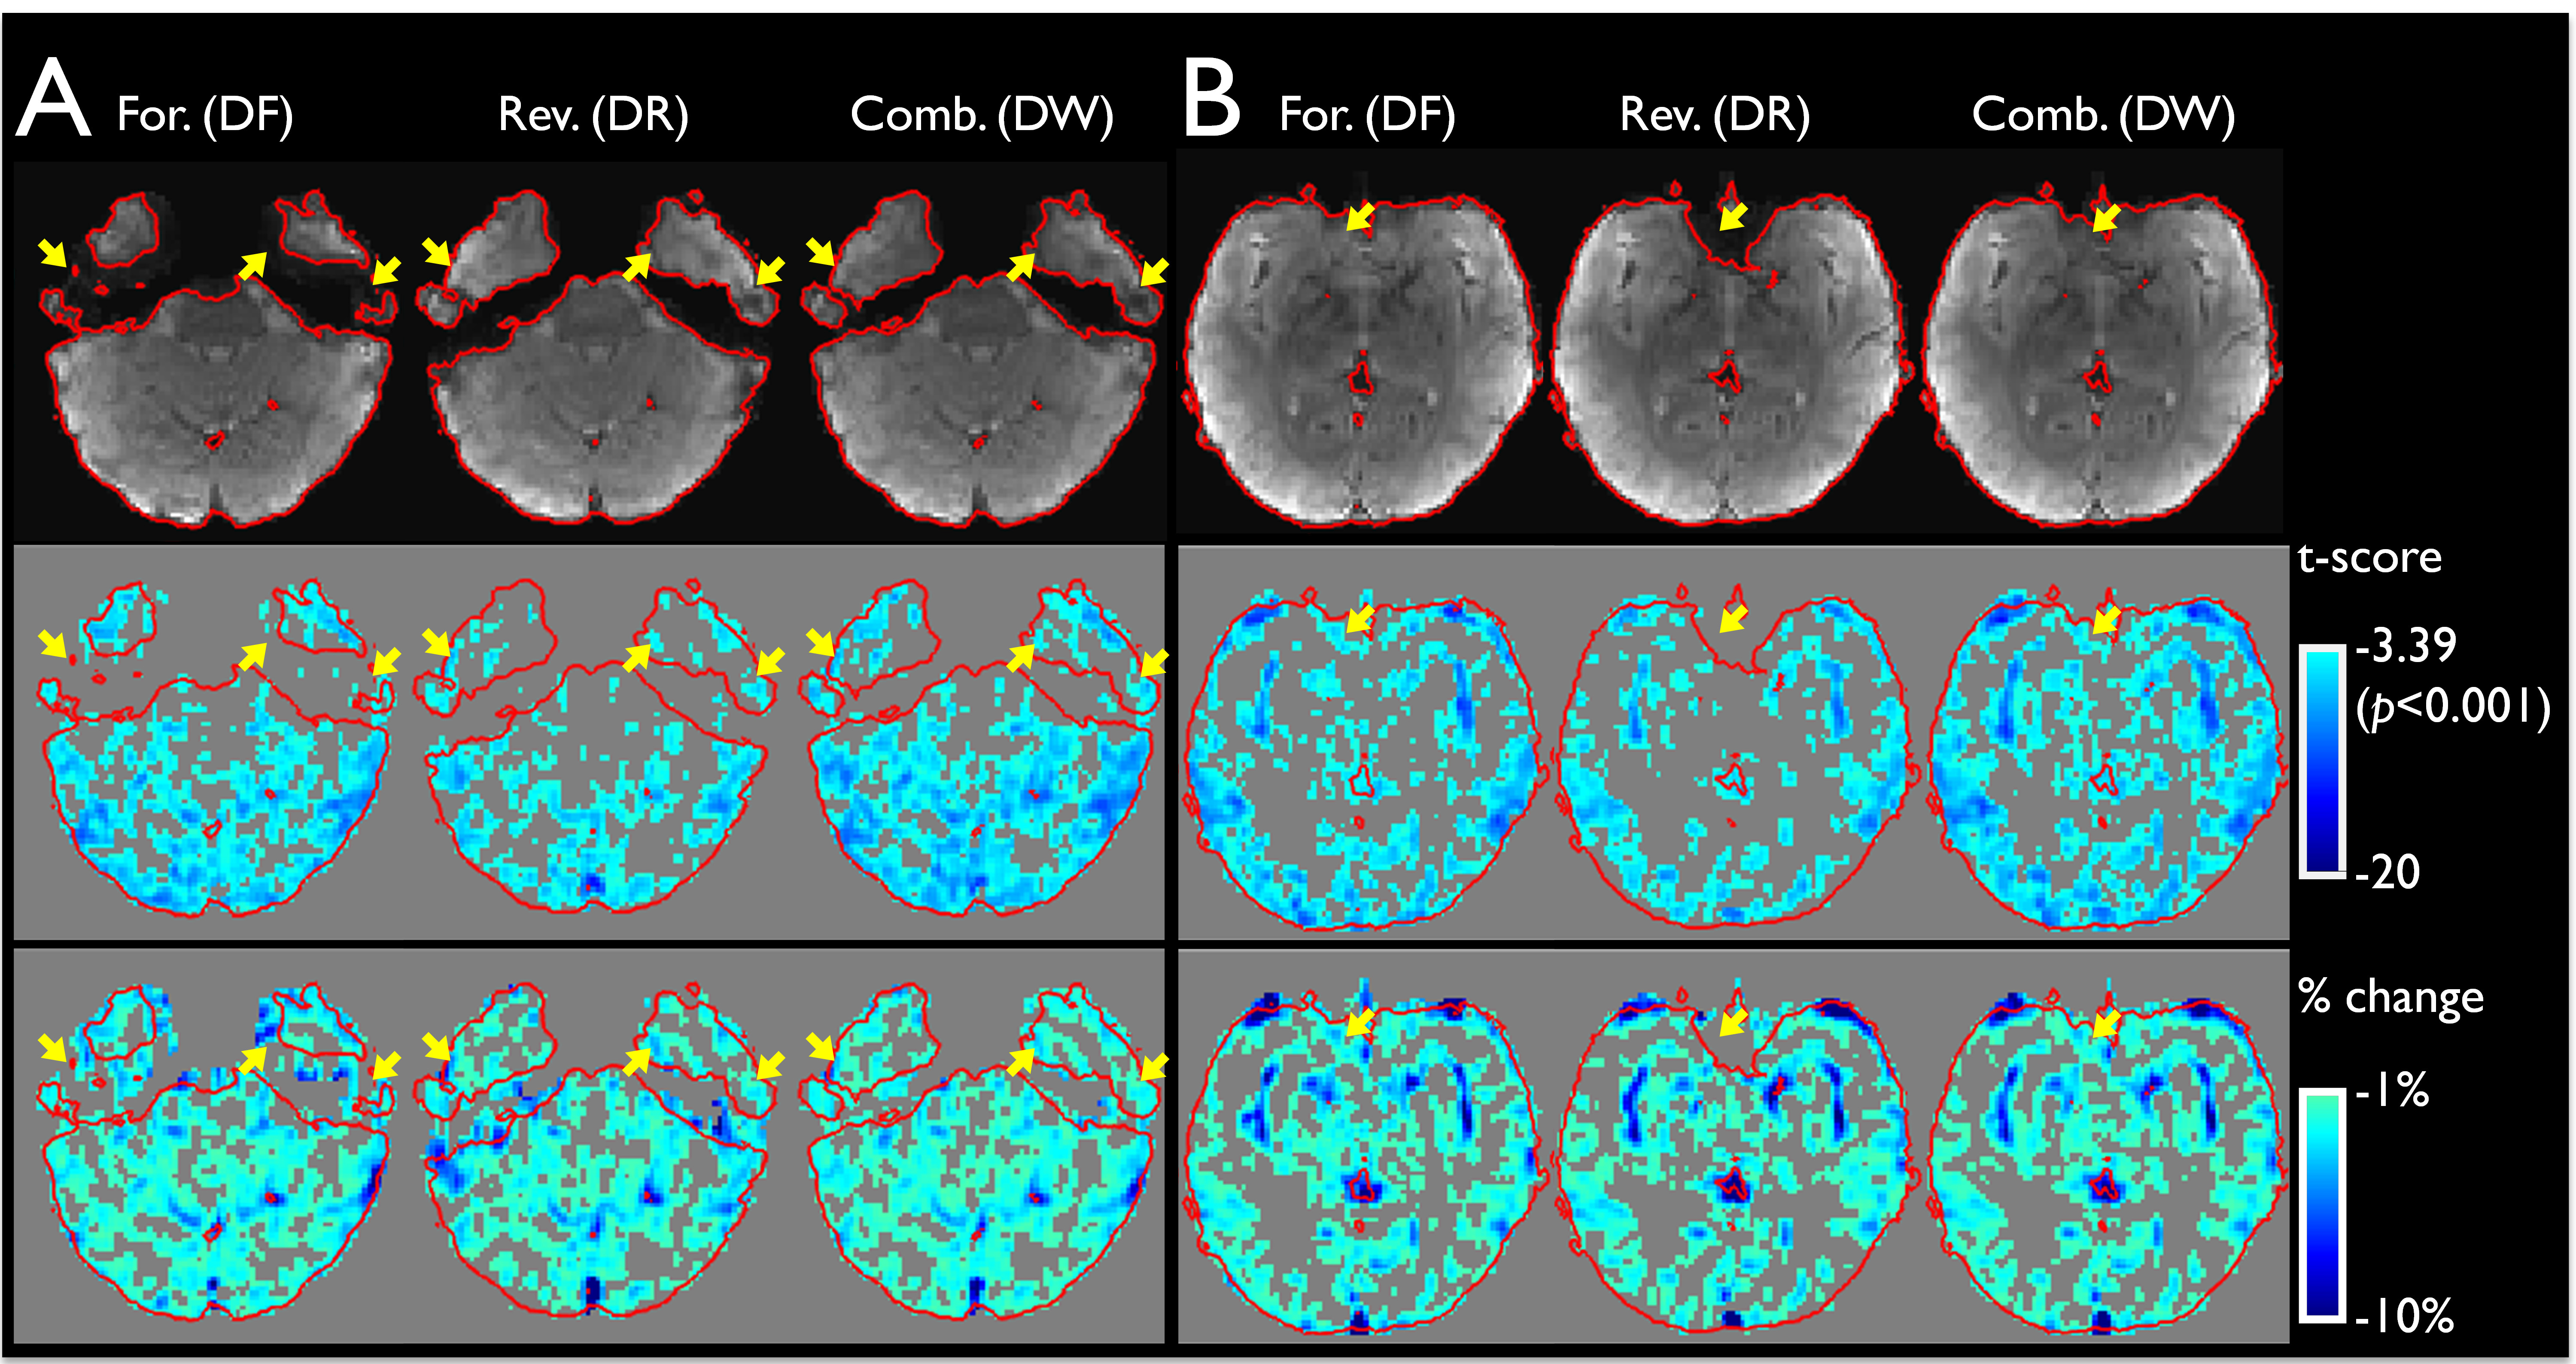
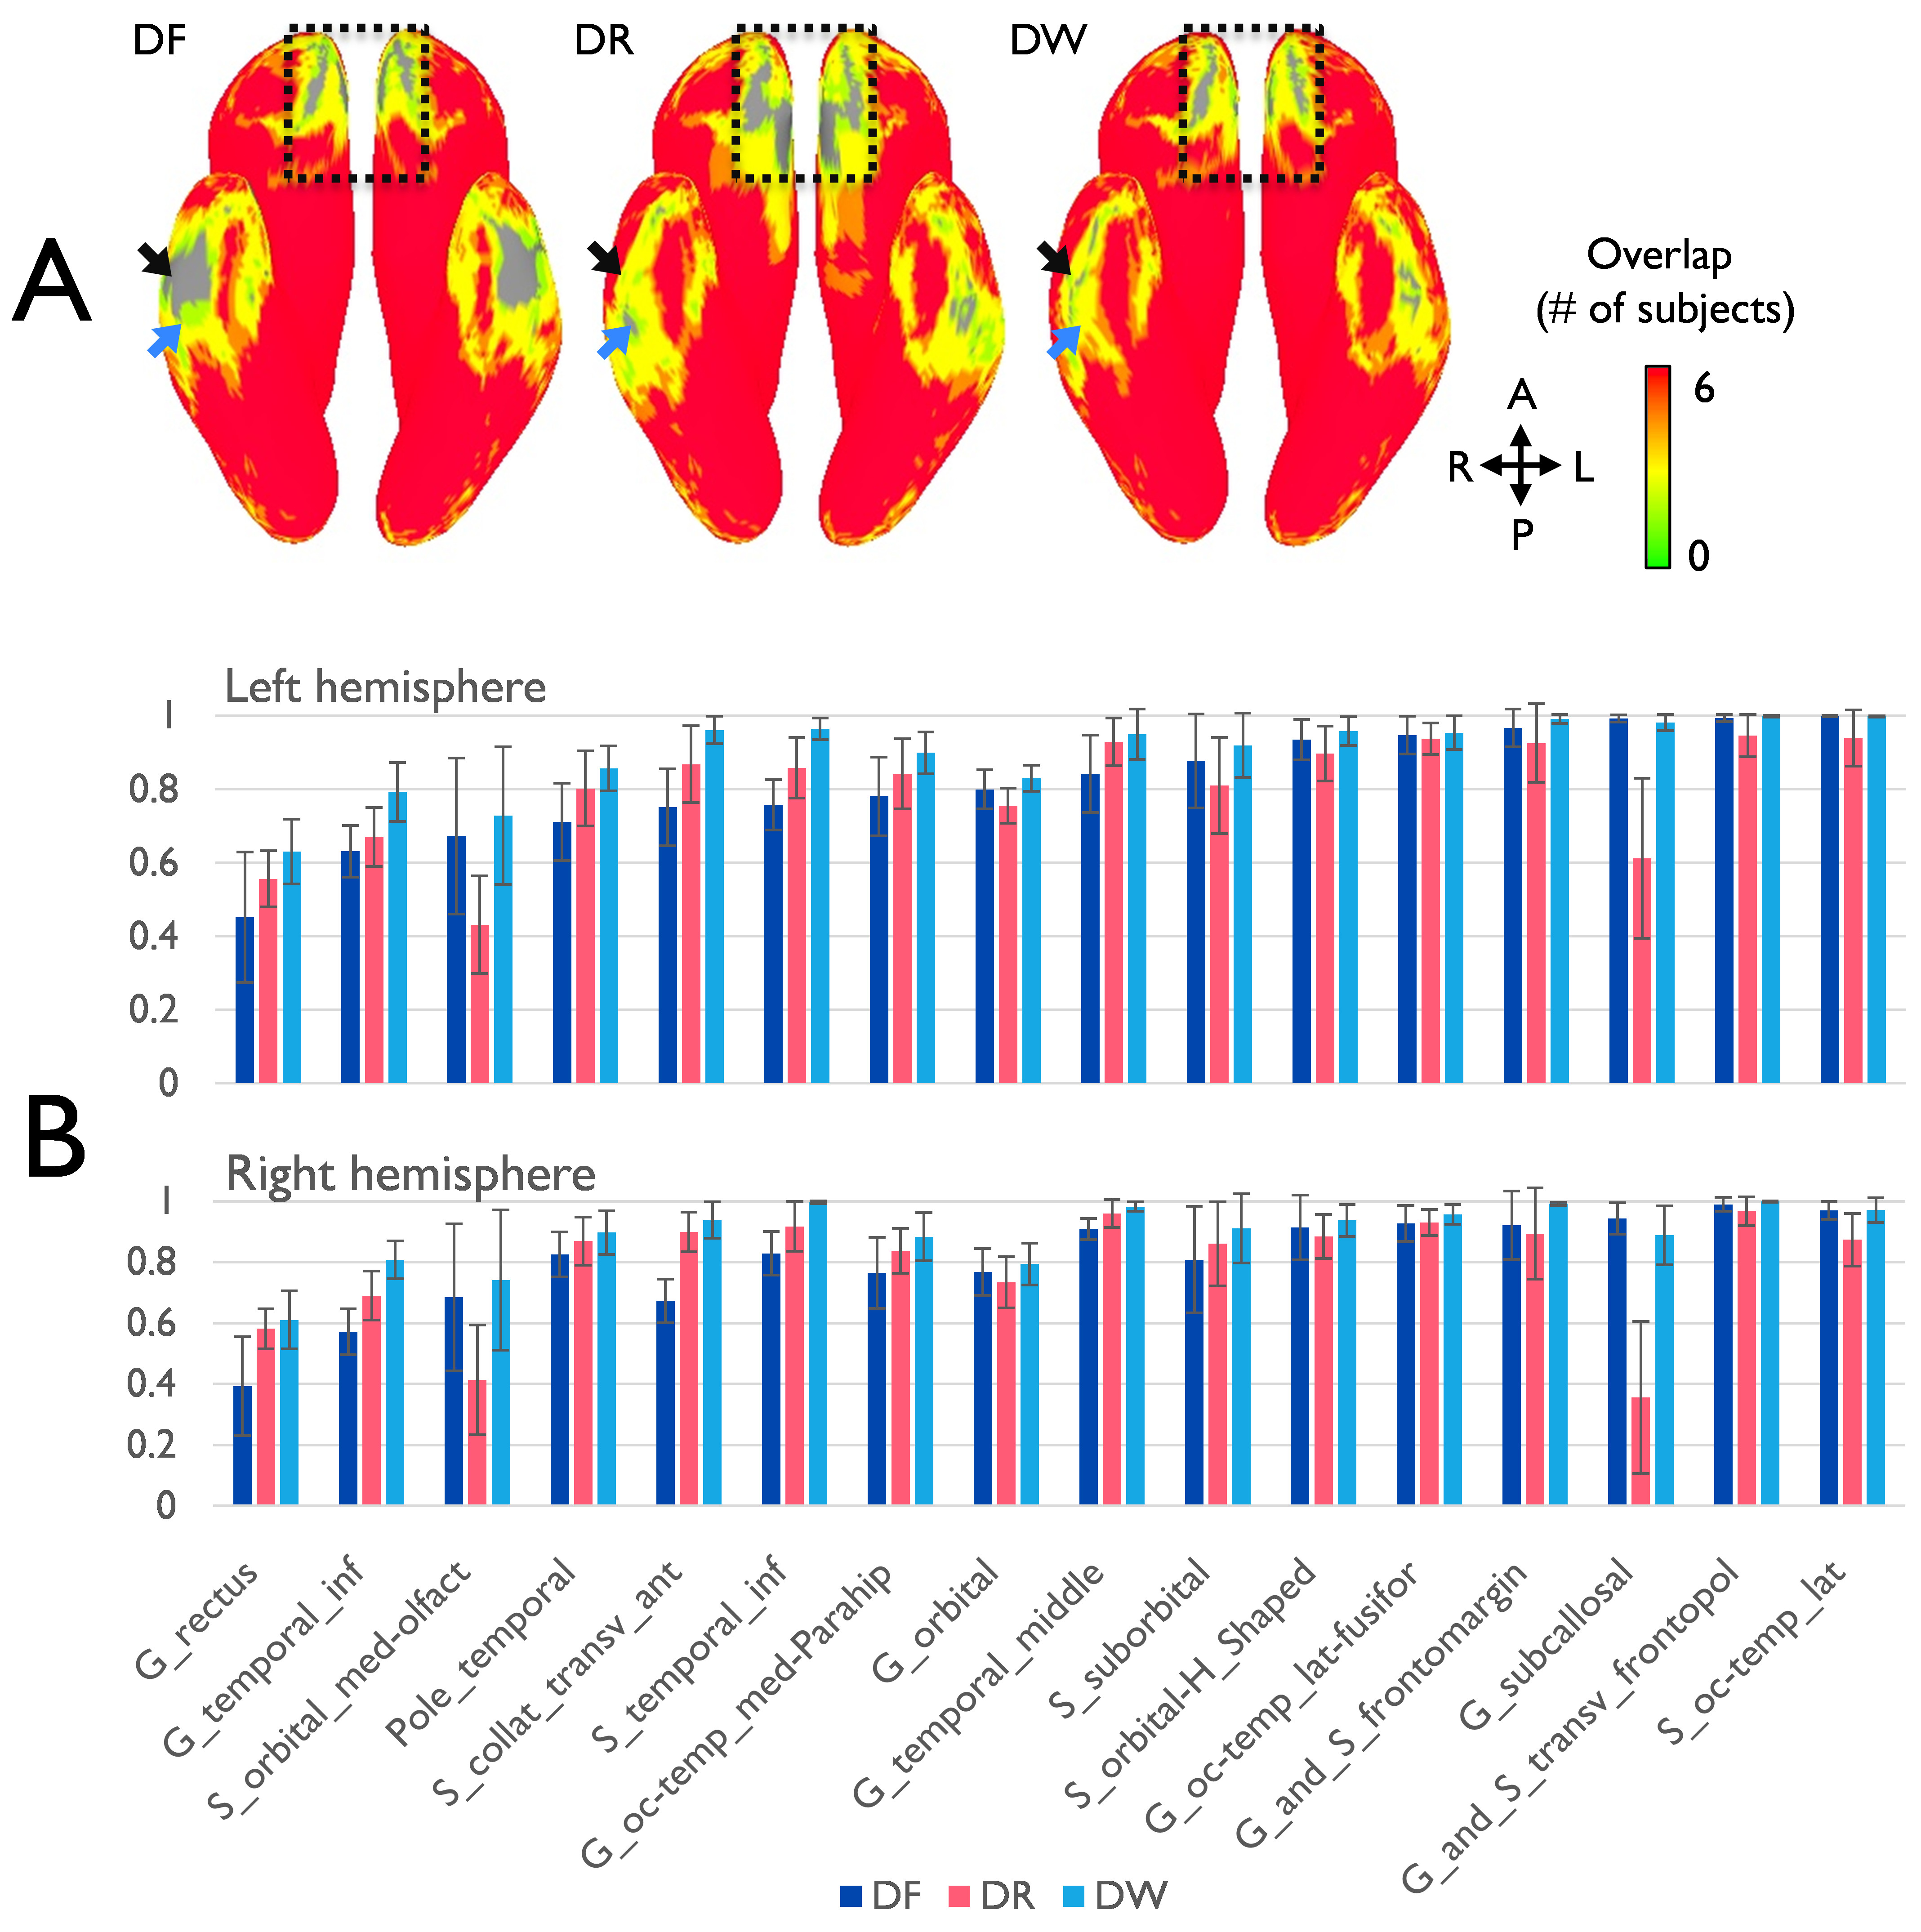
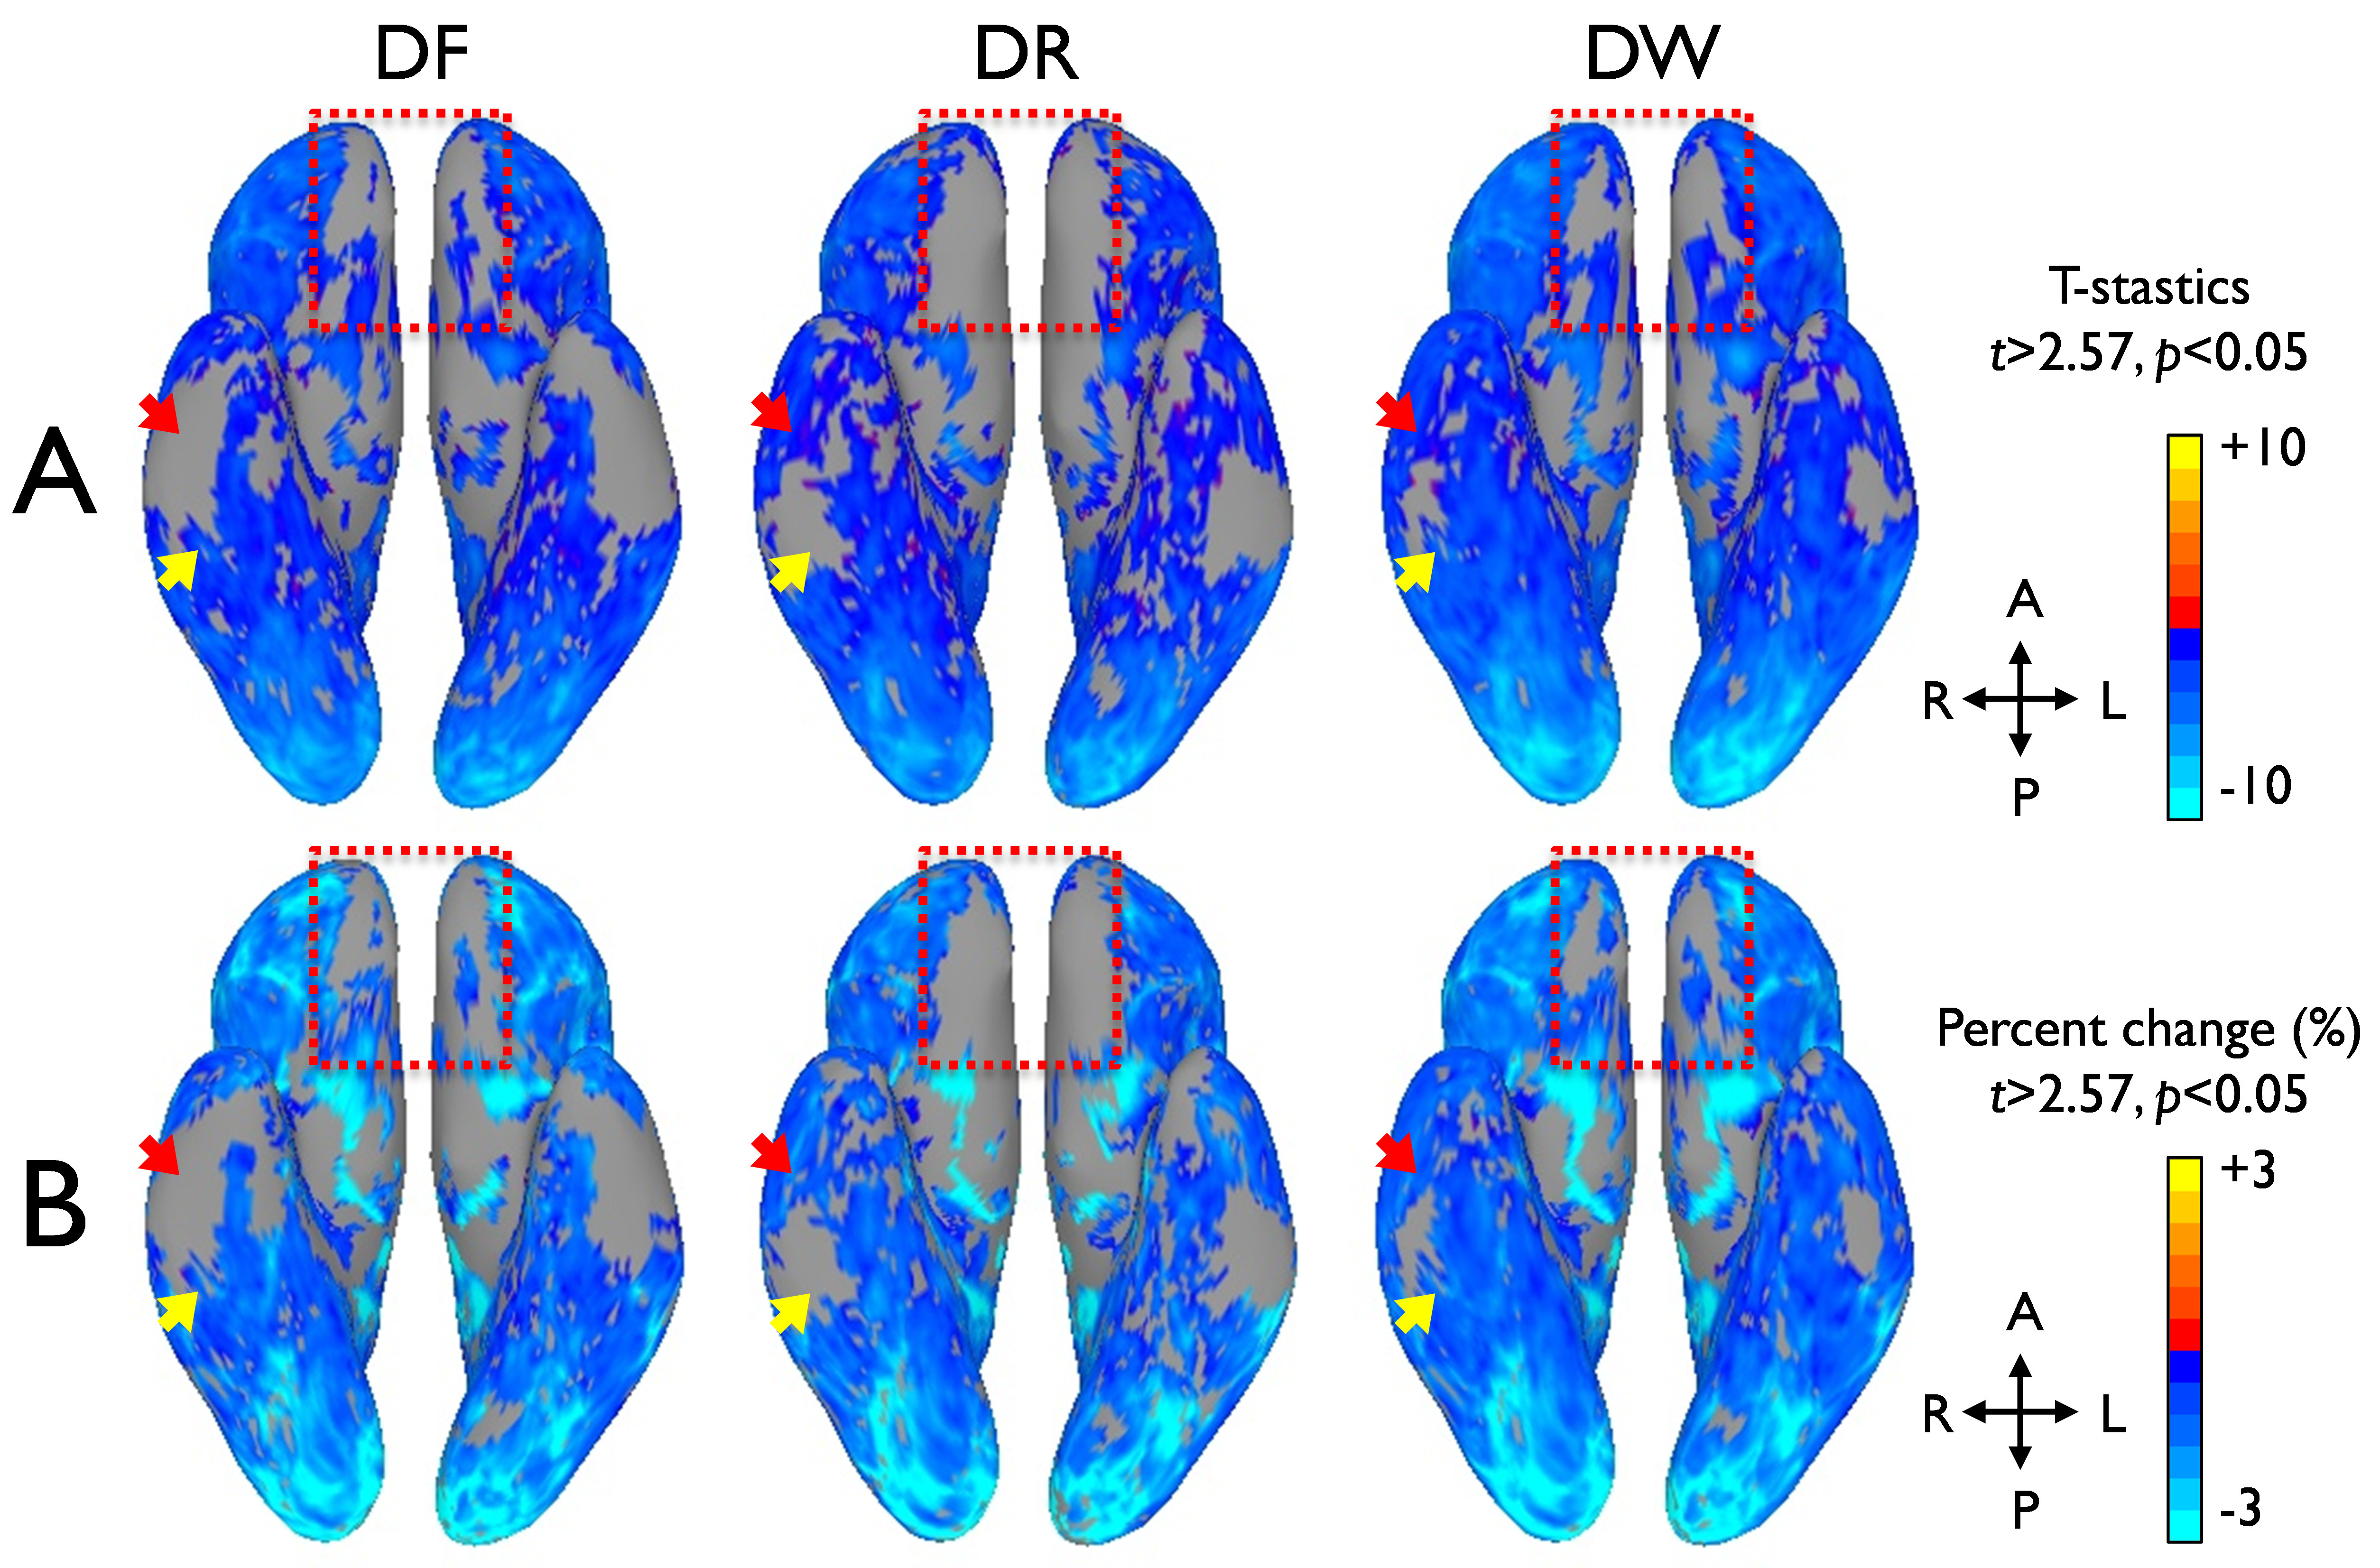
With multi-band imaging, the effective temporal resolution of the RG-fMRI was 2s which can efficiently capture the BOLD signal change over time. As shown in the distortion-corrected images (Fig. 1), the susceptibility-induced signal dropout was clearly different between the forward and reverse EPIs in regions of temporal and frontal lobes and varied across the slices within the subject, which resulted in mismatched activation maps in the affected areas (arrows in Fig. 1). When compared to the EPI pair, more apparent signal dropouts appeared in temporal and frontal lobes, respectively in the forward and the reverse images (Fig. 1) and the similar result was observed in the group coverage-ratio map (Fig. 2A). Even with strong signal dropout of the EPI pair in the regions of temporal lobes, signal loss was significantly reduced in the combined data as the signal dropout patterns are different for the forward and the reverse EPI (arrows in Fig. 2A). This improved both the global group coverage ratio and regional coverage ratio (Fig. 2B). In group level analysis, the GLM-based fMRI t-score map of the DW data is visually more robust than the t-score maps derived from either the forward or reversion EPI data (Fig. 3a). In addition, the overall activation pattern of the t-score maps is very similar to the signal change percentage map which is relatively independent from the image SNR (Fig. 3b). Therefore, it was demonstrated that the improvements in local areas of the group activation map were mainly due to the signal distortion correction, rather than the SNR improvement in the combination of the EPI pair.Conclusion
This study demonstrates that the multi-band PSF-based RG approach can be beneficial to improve the fMRI reliability in both individual and group data analysis, especially in high susceptibility brain regions. Therefore, the proposed approach represents a viable method for investigating the brain functional mechanisms in the temporal and frontal areas which have not been intensively explored yet due to conventional EPI limitation.Acknowledgements
This work was supported by NIH U01 EB024450 and NHI U01 EB026979. The authors would like to thank Jennifer Myers and Erin Gray for their help in collecting the data.References
1. In MH, Cho S, Shu Y, Min HK, Bernstein MA, Speck O, Lee KH, Jo HJ. Correction of metal-induced susceptibility artifacts for functional MRI during deep brain stimulation. NeuroImage 2017;158:26-36.
2. In MH, Kang D, Jo HJ, Yarach Y, Meyer NK, Trzasko JD, Gray EM, Huston J, Bernstein MA, Shu Y. Initial feasibility of a multi-band PSF-mapping based, reverse-gradient approach with geometric distortion correction for whole-brain fMRI. 28th scientific meeting of ISMRM 2020:p. 1218.
3. Foo TKF, Laskaris E, Vermilyea M, Xu M, Thompson P, Conte G, Van Epps C, Immer C, Lee SK, Tan ET, Graziani D, Mathieu JB, Hardy CJ, Schenck JF, Fiveland E, Stautner W, Ricci J, Piel J, Park K, Hua Y, Bai Y, Kagan A, Stanley D, Weavers PT, Gray E, Shu Y, Frick MA, Campeau NG, Trzasko J, Huston J, 3rd, Bernstein MA. Lightweight, compact, and high-performance 3T MR system for imaging the brain and extremities. Magn Reson Med 2018;80(5):2232-2245.
4. Lee SK, Mathieu JB, Graziani D, Piel J, Budesheim E, Fiveland E, Hardy CJ, Tan ET, Amm B, Foo TKF. Peripheral nerve stimulation characteristics of an asymmetric head‐only gradient coil compatible with a high‐channel‐count receiver array. Magnetic resonance in medicine 2016;76(6):1939-1950.
5. Weavers PT, Shu Y, Tao S, Huston J, Lee SK, Graziani D, Mathieu JB, Trzasko JD, Foo TKF, Bernstein MA. Compact three‐tesla magnetic resonance imager with high‐performance gradients passes ACR image quality and acoustic noise tests. Medical physics 2016;43(3):1259-1264.
6. In MH, Shu Y, Trzasko JD, Yarach U, Kang D, Gray EM, Huston J, Bernstein MA. Reducing PNS with minimal performance penalties via simple pulse sequence modifications on a high-performance compact 3T scanner. Physics in Medicine & Biology 2020;65(15):15NT02.
7. In MH, Posnansky O, Beall EB, Lowe MJ, Speck O. Distortion correction in EPI using an extended PSF method with a reversed phase gradient approach. PLoS ONE 2015;10(2):e0116320.
8. Cox RW. AFNI: software for analysis and visualization of functional magnetic resonance neuroimages. Comput Biomed Res 1996;29(3):162-173.
9. Reuter M, Schmansky NJ, Rosas HD, Fischl B. Within-subject template estimation for unbiased longitudinal image analysis. Neuroimage 2012;61(4):1402-1418.
10. Kang D, Jo HJ, In MH, Y Uten, Meyer NK, Bardwell Speltz LJ, Gray EM, Trzasko JD, Huston J III, Bernstein MA, Y Shu. The benefit of high-performance gradient on echo planar imaging for BOLD-based resting-state functional MRI. Physics in Medicine & Biology 2020.
11. Saad ZS, Reynolds RC, Argall B, Japee S, Cox RW. SUMA: an interface for surface-based intra-and inter-subject analysis with AFNI. 2004. IEEE. p 1510-1513.
Figures