2696
The influence of undersampling scheme and labeling approach on functional arterial spin labeling with single-shot 3D GRASE readout at 3T1Faculty of Psychology and Neuroscience, Maastricht University, Maastricht, Netherlands, 2Siemens Healthineers, Erlangen, Germany, 3Techna Institute & Koerner Scientist in MR Imaging, Joint Department of Medical Imaging and Krembil Brain Institute, Toronto, ON, Canada
Synopsis
Arterial spin labeling (ASL) fMRI is beneficial, but suffers from low temporal signal-to-noise ratio (tSNR). We compared GRAPPA- and CAIPI-accelerated optimized short-TR single-shot 3D GRASE PASL and PCASL approaches at 3T. The CAIPI acceleration approach results in equally good or better results than the GRAPPA technique. Despite having higher perfusion tSNR, PCASL did not lead to significantly higher activation z-scores than PASL, reflecting the influence of larger number of samples for the latter. In conclusion, the higher (perfusion) tSNR efficiency of PCASL does not always guarantee outperformance and the best ASL fMRI approach will depend on the specific experimental parameters.
Introduction
Arterial spin labeling (ASL)1 can offer superior spatial specificity2 than BOLD fMRI. However, ASL fMRI suffers from low signal-to-noise ratio (SNR), limiting the achievable spatial resolution or demanding long scanning durations. The longer labeling duration of pseudo-continuos ASL (PCASL) offers higher SNR perfusion maps at the cost of decreased temporal resolution. Therefore, PCASL has been the method of choice for resting perfusion measurements in health and disease3. In comparison, pulsed ASL (PASL) allows shorter post-labeling delays (PLD) and TRs, but has a limited bolus length and therefore lower SNR. Since both the temporal SNR (tSNR) and number of TRs in a run influence the fMRI statistics, we compared an optimized short-TR single-shot 3D GRASE4 PASL approach to its PCASL counterpart at 3T. In order to achieve single-shot whole-brain 3D GRASE acquisition, k-space undersampling was utilized5,6. Therefore, we also evaluated the benefit of using the 2D CAIPI7 sampling approach versus the regular GRAPPA8 technique to achieve the required acceleration.Methods
Prototype PCASL/PASL background-suppressed 3D GRASE sequences supporting 2D GRAPPA acceleration with or without CAIPI shifts were implemented on a MAGNETOM Prisma 3T (Siemens) with a 64-channel head coil. The CAIPI shifts were realized by modulating the EPI readout with Δkz-blips. Experiments were performed on 6 healthy volunteers (3 male) after obtaining informed consent. An angiogram was used to position the labeling plane, and a subject-specific grey-matter (GM) mask was generated from a T1-weighted MPRAGE scan using Freesurfer. ASL parameters were: 3mm isotropic resolution, 32 slices, single-shot 3D GRASE readout (GRAPPA 2x2, CAIPI shift=z1 or no shift), optimized background suppression9, labeling duration/PLD/TR = 1500/1580/4120ms (PCASL) & 700/1800/2200ms (PASL). Four 9-minute functional runs (each labeling paired with each undersampling scheme) were acquired in pseudo-randomized order during a combined hemifield flickering checkerboard and unilateral finger-tapping task that lasted for 23s, interleaved with 40s rest periods. The data were motion-corrected and coregistered with SPM8 before statistical analysis without spatial smoothing in FSL FEAT. Perfusion and control tSNR maps and perfusion and control tSNR efficiencies (normalized with √TR) were obtained according to Li et al. 201510.Results
Figure 1 shows the PASL and PCASL 3D GRASE images (A,B) and control tSNR maps (C,D) acquired with the CAIPI approach from one subject demonstrating the image quality and coverage. The control tSNR values follow closely the basic image contrast in both cases, i.e. they are largest where the image intensity is highest.Figure 2 displays the corresponding perfusion tSNR maps (A,B) and functional activation maps overlaid on the mean GRASE images (C,D) from the same subject. PCASL results in higher perfusion tSNR than PASL over a large portion of the brain. Comparable results were observed in the remaining subjects. It is important to note that PASL demonstrates high perfusion tSNR in some CSF voxels, which underlines the importance of accurate grey matter segmentation to obtain correct results.
Figure 3 presents the mean and standard deviation of the grey matter control tSNR (A) and perfusion tSNR (B) efficiencies across subjects. The PCASL variants have significantly higher control tSNR efficiencies than the PASL ones. There were no statistically significant differences between the acceleration approaches when they were compared within a labeling scheme. In comparison, despite the higher perfusion tSNR efficiencies with CAIPI and with PCASL, there were no statistically significant differences between the perfusion tSNR efficiencies across labeling schemes and acceleration approaches.
Table 1 summarizes the individual and mean values in grey matter across subjects for all ASL variants compared, for the perfusion and control tSNR efficiencies, the perfusion-weighted volume and the mean z-scores for the statistically-thresholded baseline perfusion and perfusion activation maps. PCASL leads to a larger significantly perfused volume than PASL, however the mean z-scores across approaches are similar with those using CAIPI slightly outperforming.
Discussion
For the PASL labeling scheme, no increase of image artifacts with GRAPPA compared to CAIPI was observed on the individual subject level. In comparison, a higher artifact load and lower control tSNR (efficiency) was present in the GRAPPA acquisitions compared to the CAIPI scans in the PCASL case. The differences in control and perfusion tSNR (efficiencies) between GRAPPA and CAIPI for the PASL scheme are small, leading to insignificant differences in perfusion-weighted volumes and mean perfusion activation z-scores, apart from the mean perfusion-weighted z-score. For the PCASL labeling scheme, the perfusion tSNR efficiency improvement due to CAIPI is larger, but it also results only in significantly higher mean perfusion-weighted z-score.PCASL variants have higher control and perfusion tSNR efficiency than PASL ones leading to a larger perfusion-weighted volume. However, the perfusion-weighted volumes and perfusion activation z-scores for PASL are higher than those for PCASL, reflecting the benefit of the additional temporal samples. It should be noted that the minimum TR of the PCASL variant might be further reduced if the background suppression pulses applied are distributed throughout the whole TR.
In conclusion, the CAIPI sampling approach results in as good as or better results than the regularly sampled GRAPPA technique. Further, the higher (perfusion) tSNR efficiency of PCASL does not always guarantee outperformance and the best ASL fMRI approach will depend on the specific experimental parameters.
Acknowledgements
BAP is partially funded by the NWO VIDI grant 16.Vidi.178.052 and by the National Institute for Health grant (R01MH/111444) (PI David Feinberg).References
1 Detre et al. MRM 1992
2 Silva et al. JCBFM 2000
3 Alsop et al. MRM 2015
4 Oshio and Feinberg. MRM 1991
5 Boland et al. MRM 2018
6 Ivanov et al. Proc. ISMRM 2017
7 Breuer et al. MRM 2006
8 Griswold et al. MRM 2002
9 Vidorreta et al. NMR Biomed 2014
10 Li et al. Neuroimage 2015
Figures
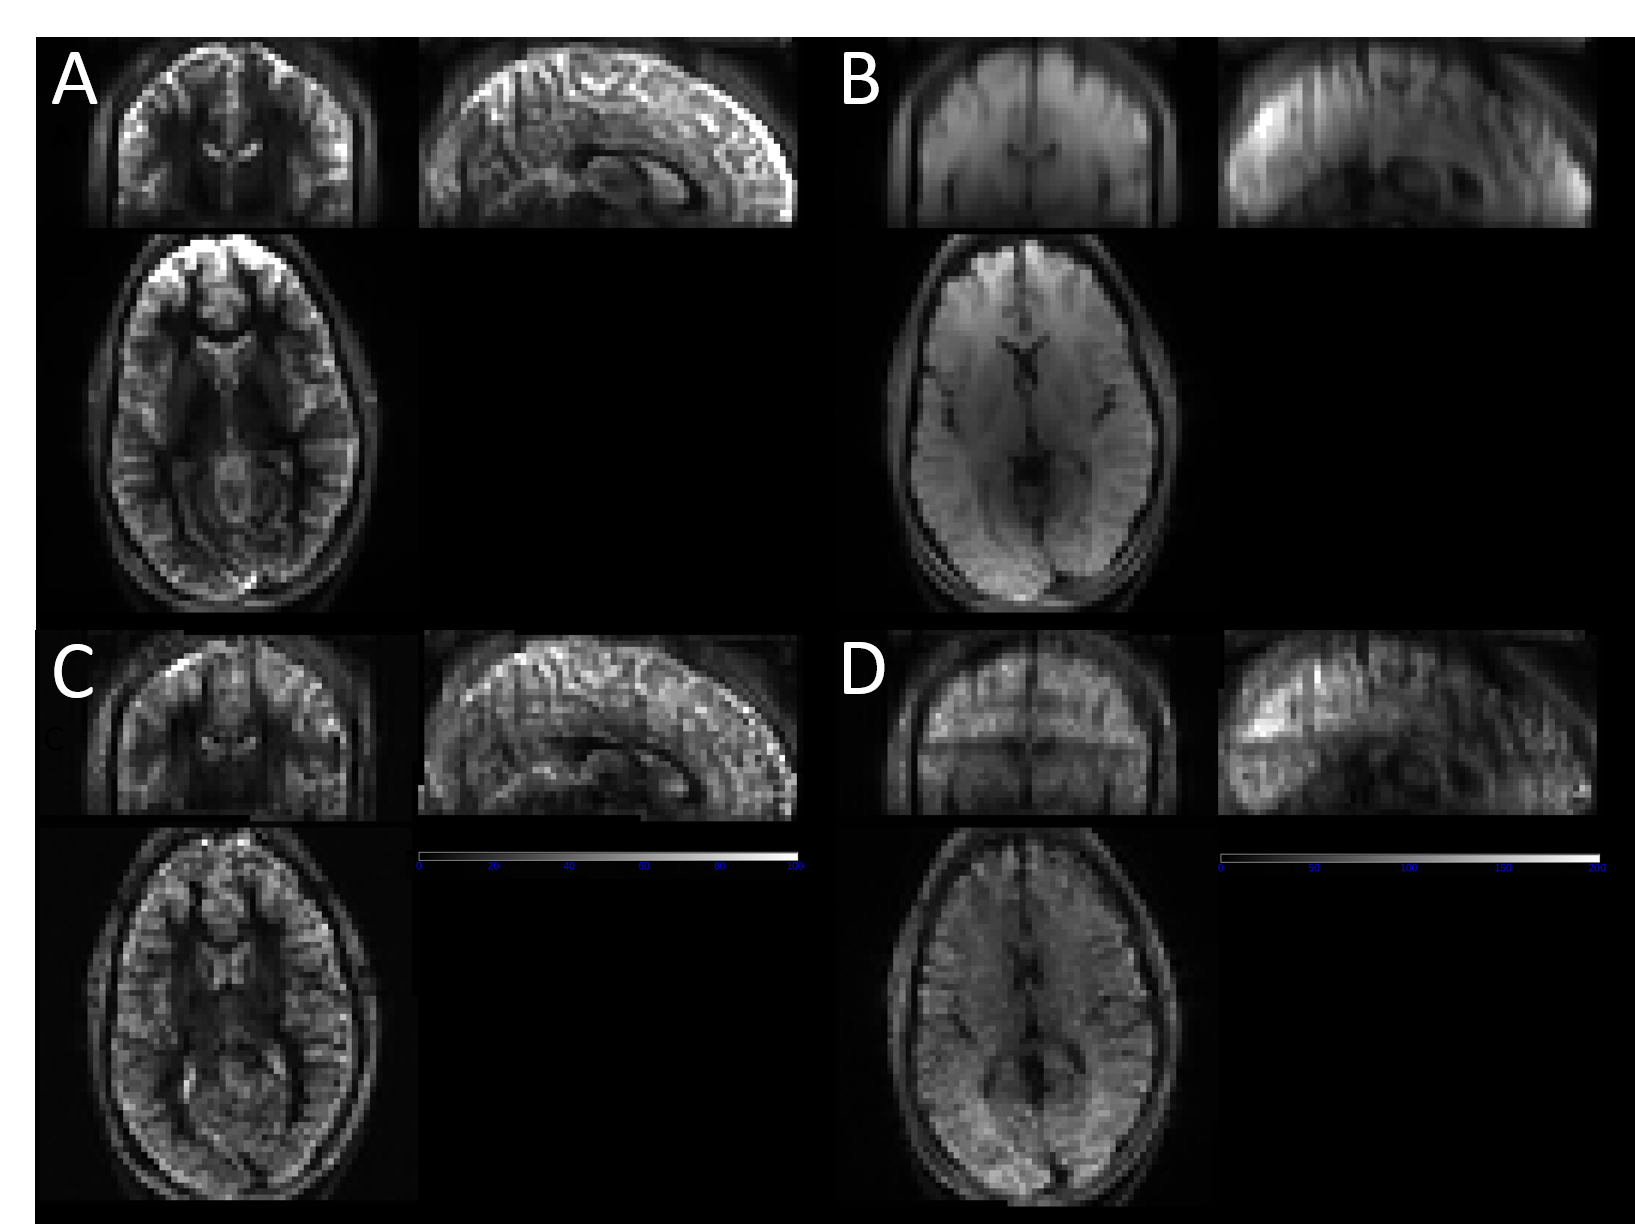
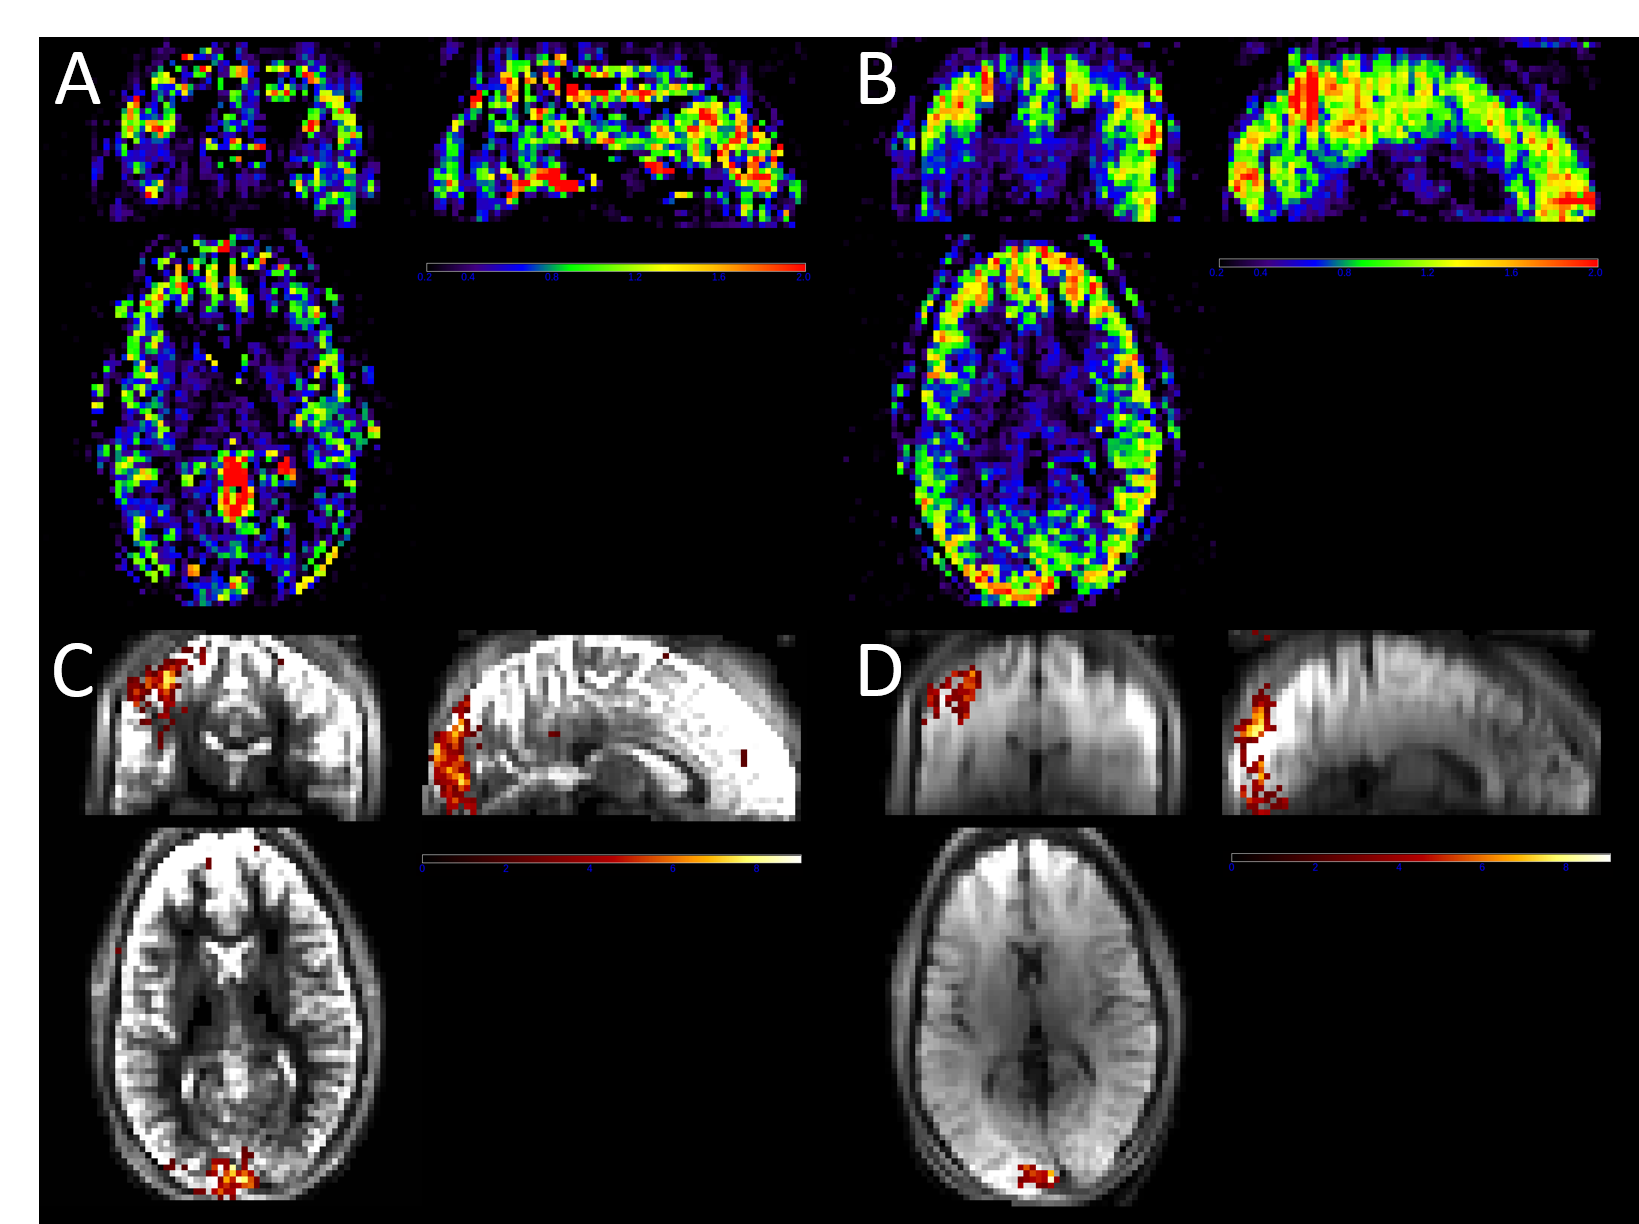
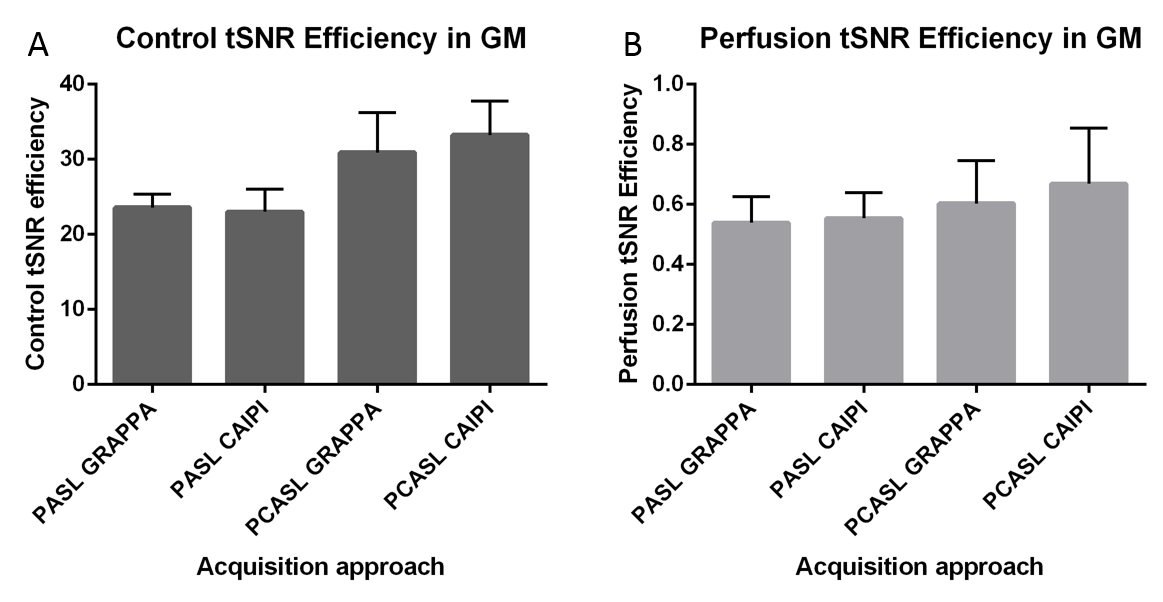
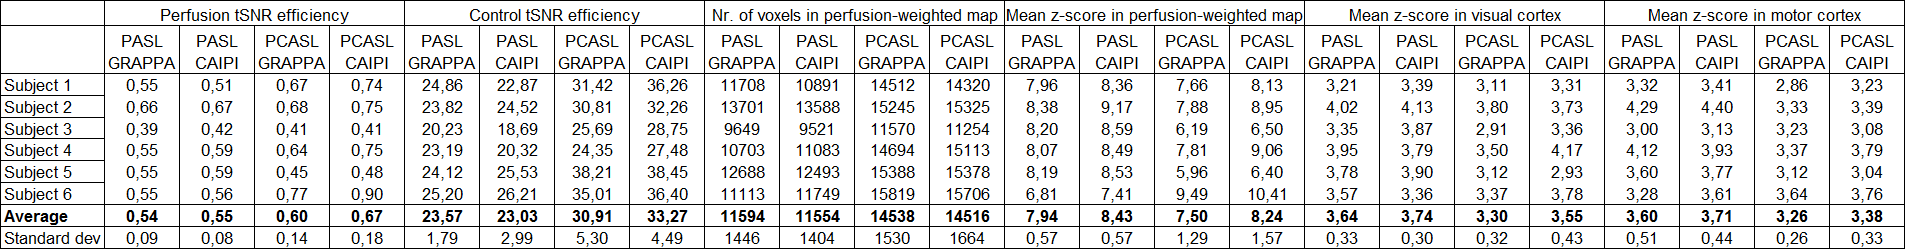
Table 1: Individual and group mean values in grey matter across subjects for all ASL variants compared for the perfusion and control tSNR efficiencies, the perfusion-weighted volume and the mean z-scores for the statistically-thresholded baseline perfusion and perfusion activation maps.