2695
Evaluation of spin-echo generalized Slice Dithered Enhanced Resolution (gSLIDER) for high-resolution fMRI at 3T.
Alexander JS Beckett1,2, Salvatore Torrisi1,2, Kawin Setsompop3, David A Feinberg1,2, and An T Vu4,5
1Helen Wills Neuroscience Institute, University of California, Berkeley, CA, United States, 2Advanced MRI Technologies, Sebastopol, CA, United States, 3Radiological Sciences Laboratory, Stanford University, Stanford, CA, United States, 4Radiology, University of California, San Francisco, CA, United States, 5San Francisco Veteran Affairs Health Care System, San Francisco, CA, United States
1Helen Wills Neuroscience Institute, University of California, Berkeley, CA, United States, 2Advanced MRI Technologies, Sebastopol, CA, United States, 3Radiological Sciences Laboratory, Stanford University, Stanford, CA, United States, 4Radiology, University of California, San Francisco, CA, United States, 5San Francisco Veteran Affairs Health Care System, San Francisco, CA, United States
Synopsis
We demonstrate the use of generalized Slice Dithered Enhanced Resolution (gSLIDER) for high-resolution spin-echo (SE) fMRI. Activations were comparable to standard SE fMRI at varying levels of regularization, demonstrating the suitability of this method for high-resolution fMRI.
Introduction
Submillimeter functional imaging using spin-echo (SE) based contrasts at high-field have demonstrated the ability to resolve neural architecture at the level of columns and layers1,2. Given that there are comparatively few 7T scanners in the human research setting, there is strong motivation to further develop techniques to enable sub-millimeter functional imaging at lower field strengths. However, lower field strengths are limited in both sensitivity and specificity to microvascular sources of BOLD activations. To address these limitations, we propose the development of SE based generalized Slice Dithered Enhanced Resolution (gSLIDER) fMRI, which reduces large vein bias and static B0 signal dropout while more than doubling SNR efficiency. The original gradient echo (GE) based SLIDER technique3,4 had thick slices whose positions were dithered. In contrast, gSLIDER utilizes a phase-dithered encoding to provide a highly independent basis, maintaining high SNR after deblurring/thin-slice reconstruction. This results in greater than x2 SNR compared to traditional high-resolution 2D EPI5. Thus far, gSLIDER has only been applied to diffusion weighted MRI and the present experiments evaluate its fMRI application.Methods
Data were acquired on a healthy volunteer on a Siemens 3T Skyra (VE11) using a 32ch head array. The subject viewed a visual hemifield localizer stimulus (30s and 6 repeats per hemifield) during each scan. Imaging parameters for the 1mm gSlider/SE scans were: Inplane FOV = 220x220 mm; Matrix = 220x220; PF = 6/8; GRAPPA 3; TE = 69 ms; TR = 10s (2s per dithered volume); Slice Thickness = 1mm (Slab Thickness = 5mm); Flip angle = 90/180; PE direction= AP; 128 axial slices (130 slices for SE data). For the inplane 1.3mm gSlider scans all parameters were identical except: Matrix = 170x170 and TE = 51 ms / 69ms.For gSlider data, five thin-slab volumes were acquired, each five times the thickness of the final slice resolution and with a different slice phase (Figure 1). These were combined using Tikhonov regularization to create high-resolution images. A larger regularization parameter (λ) results in greater residual blurring but reduced noise. Super-resolution gSlider data was assessed at 3 levels of regularization (λ = 0, 0.4, 1).
To assess each method for fMRI, motion correction in MATLAB was performed, the 2nd and 3rd TRs of each stimulus block were averaged (the 1st TR was discarded to avoid the influence of transition periods), a T-test was performed for left versus right hemifield stimulation, and results were cluster thresholded. T-values and tSNR values were plotted for each scan based on a visual cortex ROI calculated from a separate high CNR gradient echo (GE) EPI scan.
Results
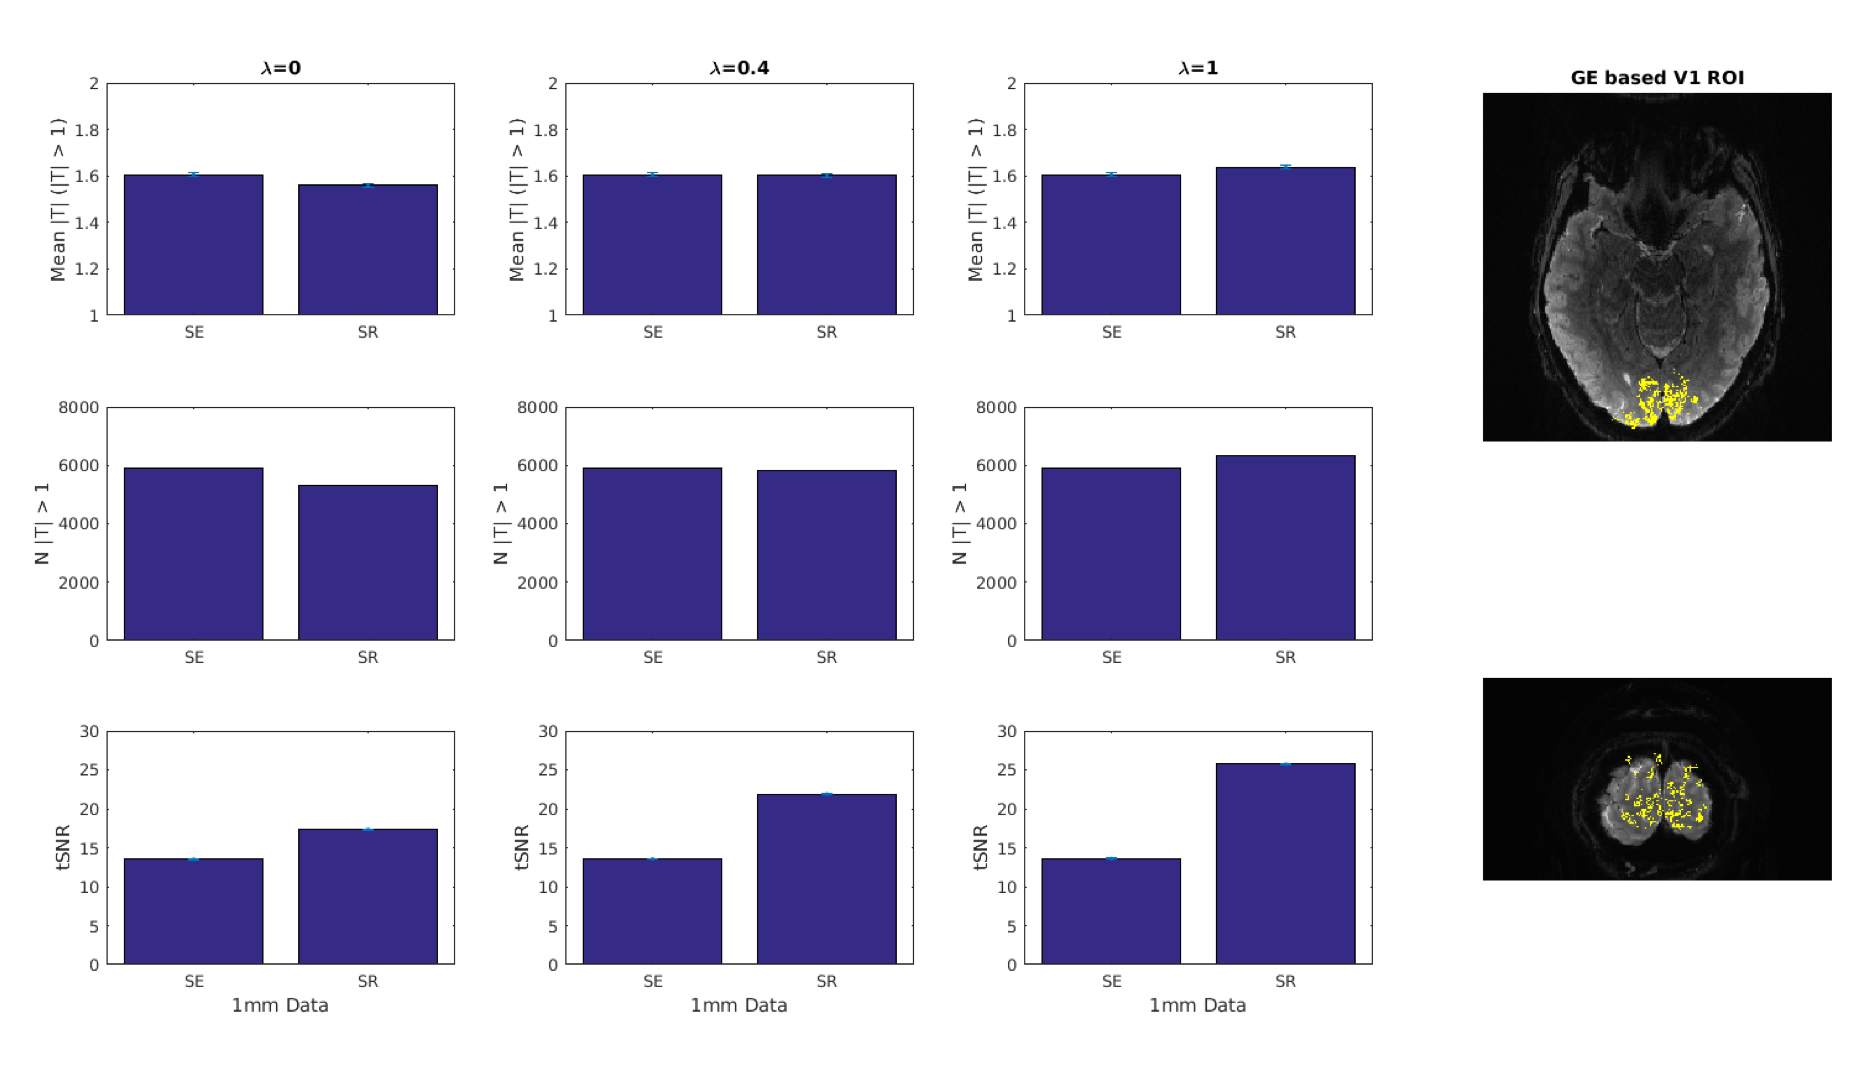
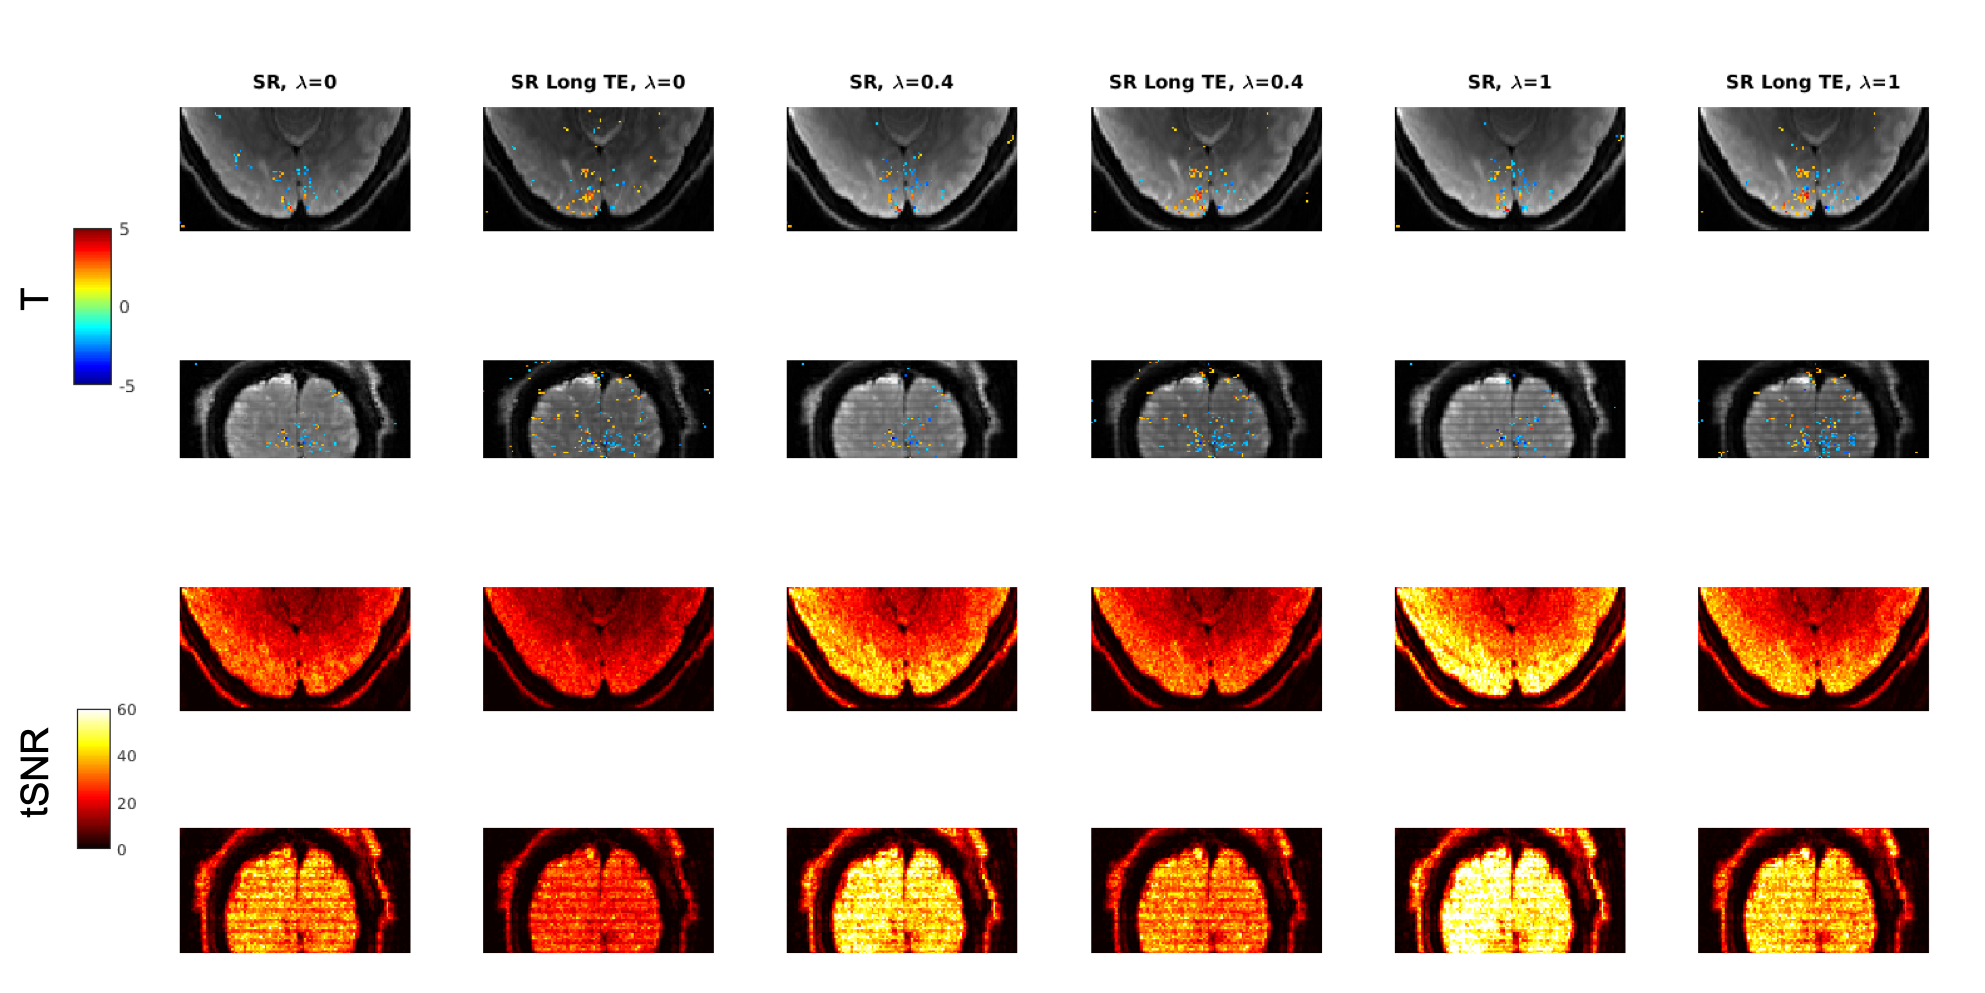
Figure 2 shows the thresholded activation maps for the 1mm SE data, and the 1mm gSlider data at different regularizations. Figure 3 shows the average above threshold T-values and voxel counts, along with tSNR, for the visual cortex ROI. High-resolution gSlider data shows higher tSNR values than SE data, and higher activations with higher regularization.Figure 4 shows the thresholded activation maps for the 1.3 mm gSlider data for a short and long TEs. Figure 5 shows the above threshold T-values and voxel counts, along with tSNR, for the visual cortex ROI. The data with long TE shows lower tSNR but higher activations than the short TE data, for all regularization values used.
Discussion
Comparing the high-resolution 1mm data, gSlider showed higher tSNR values in the visual cortex ROI compared to the SE data (Figure 3). However, the results in terms of activations (T-values) were less clear. The mean T-value and counts of above threshold voxels depended on the level of regularization used, and only showed greater activation for the highest regularization used (λ=1). While using higher λ leads to reduced noise, it will also lead to increased through-slice blurring in the final images5. Using a regularization value that had previously shown a good balance between noise suppression and maintaining a narrow through-slice PSF (λ=0.4) showed comparable activations with the SE data.Studies have suggested that a TE much shorter than the tissue T2 may show benefits for SE fMRI6. However, we found that while the data with a longer TE had lower tSNR, the mean T-values and voxel counts were higher, perhaps due to our higher spatial resolution.
It may be the case that improvements in BOLD CNR for gSlider versus standard acquisitions do not become fully apparent until a thermal noise dominated, submillimeter regime is reached. In addition, while fMRI is a dynamic signal, dMRI is a static signal based on averaging a series of images, and it may be that this implementation of gSlider is more effective for static than dynamic contrasts. A variation of gSlider that includes only two slices per slab rather than five also showed comparable fMRI results to a more standard SE acquisition7.
Conclusion
The implementation of 1 mm isotropic gSlider used here, with 5 slices per slab, does not appear to show the same advantages for fMRI as it has shown previously for dMRI5. A recent development of gSlider that collects two adjacent slices simultaneously7 showed promising results, so it may be that additional configurations of gSlider may show good results for high-resolution SE fMRI at 3T.Acknowledgements
NIH BRAIN Initiative R01 EB028670
UCSF REAC Award
References
1. Yacoub et al, Neuroimage, 2007 2. De Martino et al, PLoS, 2013 3. Vu et al, Neuroimage, 2018 4. Feinberg et al, Neuroimage, 2018 5. Setsompop, Mag Res Medicine, 2018 6. Ragot & Chen, Magn Reson Imaging, 2019 7. Han et al, Mag Res Medicine, 2020
Figures
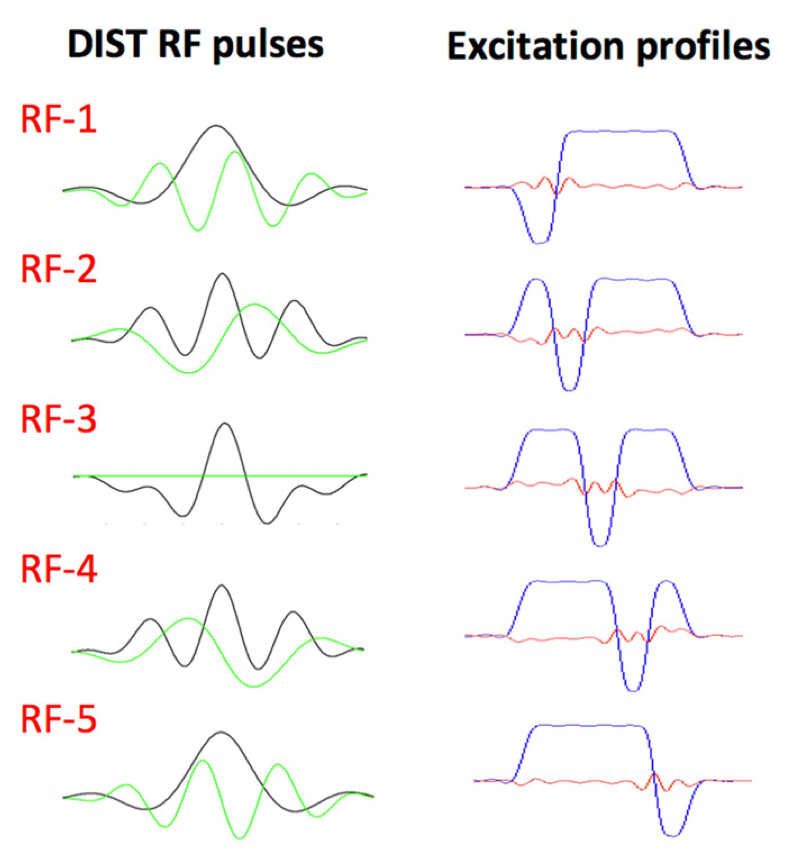
5×-gSlider with ‘slice-phase dither’ encoding to provide highly independent basis, while maintaining high image-SNR in each individual slab acquisition. The DIST RF pulses are shown in the left column, with real and imaginary parts shown in black and green respectively. The corresponding slab profiles are shown in the middle column, each with a π phase dithering applied to a different sub-slice.
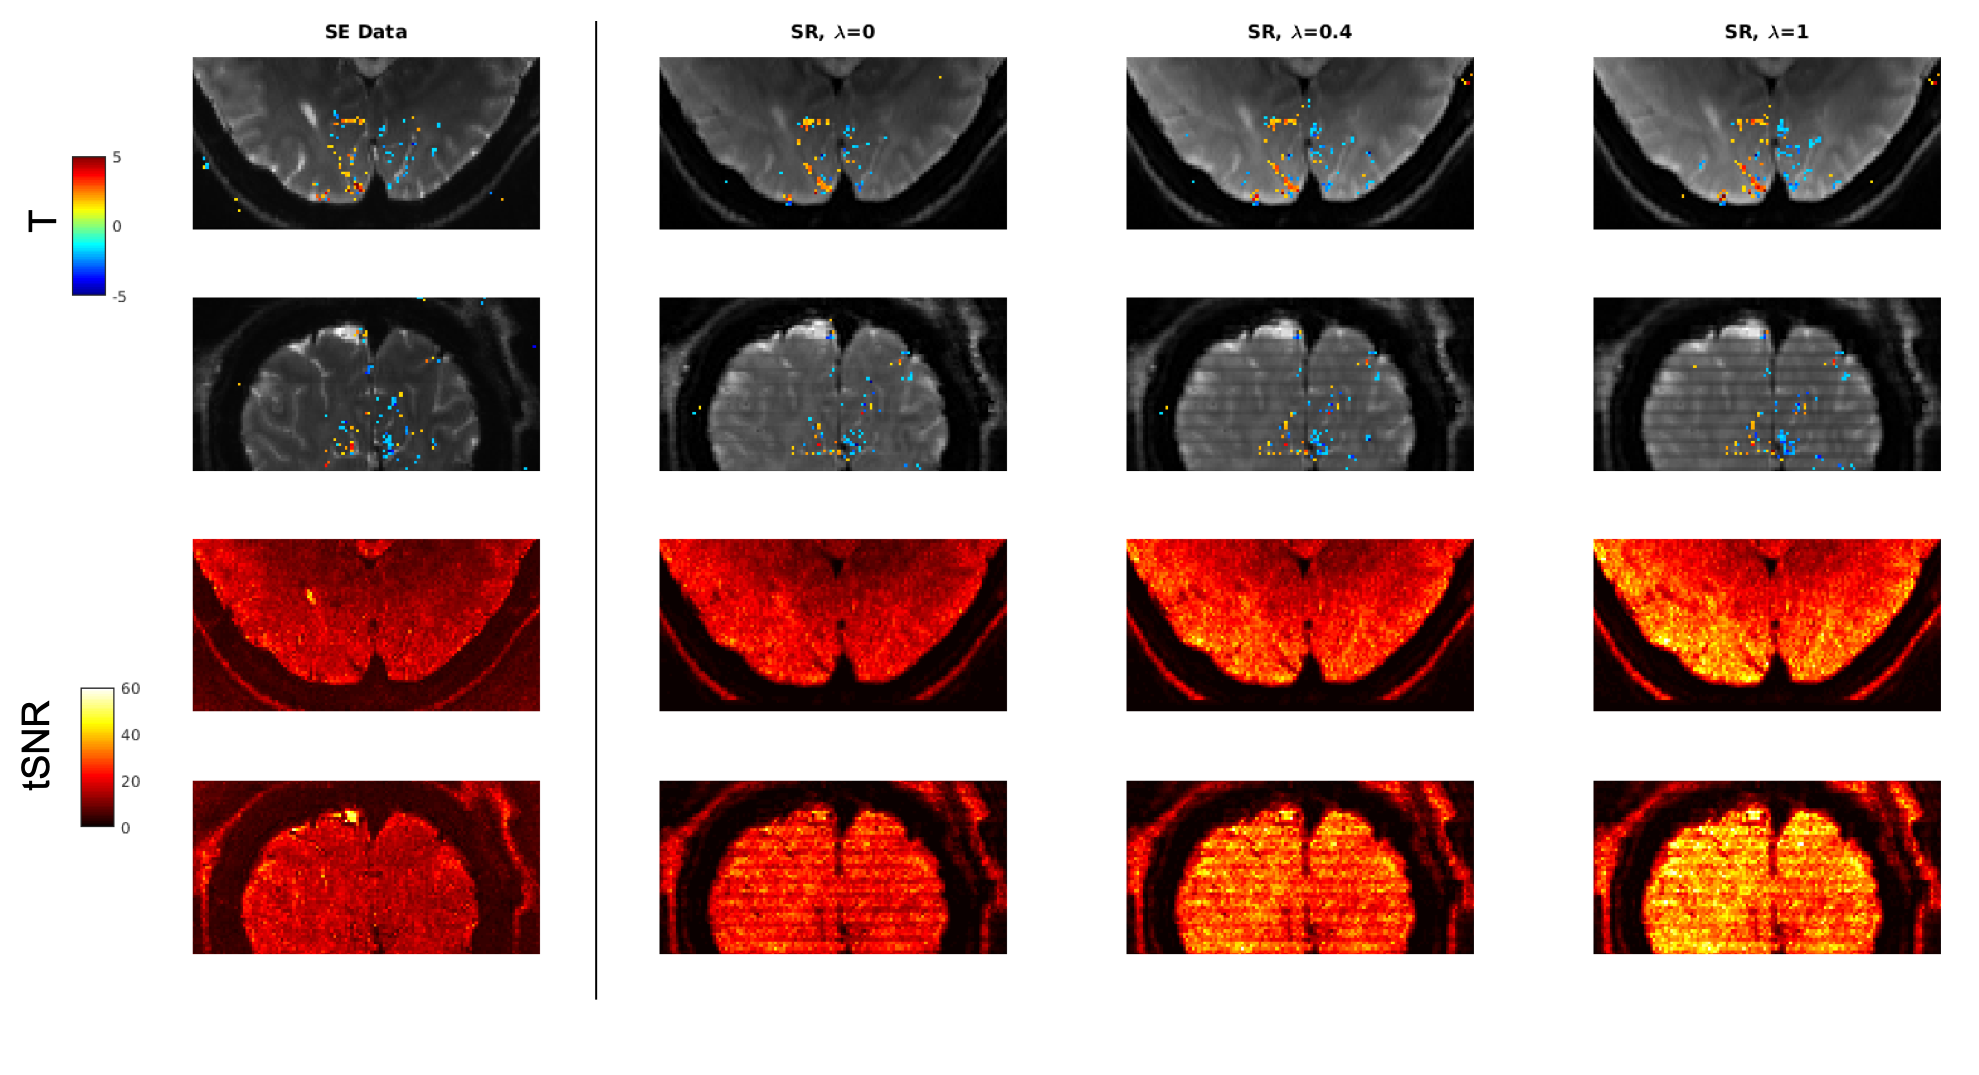
Figure 2 – Activation maps for 1mm Spin Echo (SE) and gSlider Super Resolution (SR) data with different levels of regularization (Lambda).
Figure
3 – Mean T values above threshold, voxels above threshold and tSNR for 1mm data
in a visual cortex ROI.
Figure
4 – Activation maps for 1.3mm gSlider
Super Resolution (SR) data with different levels of regularization (Lambda) and
TE.
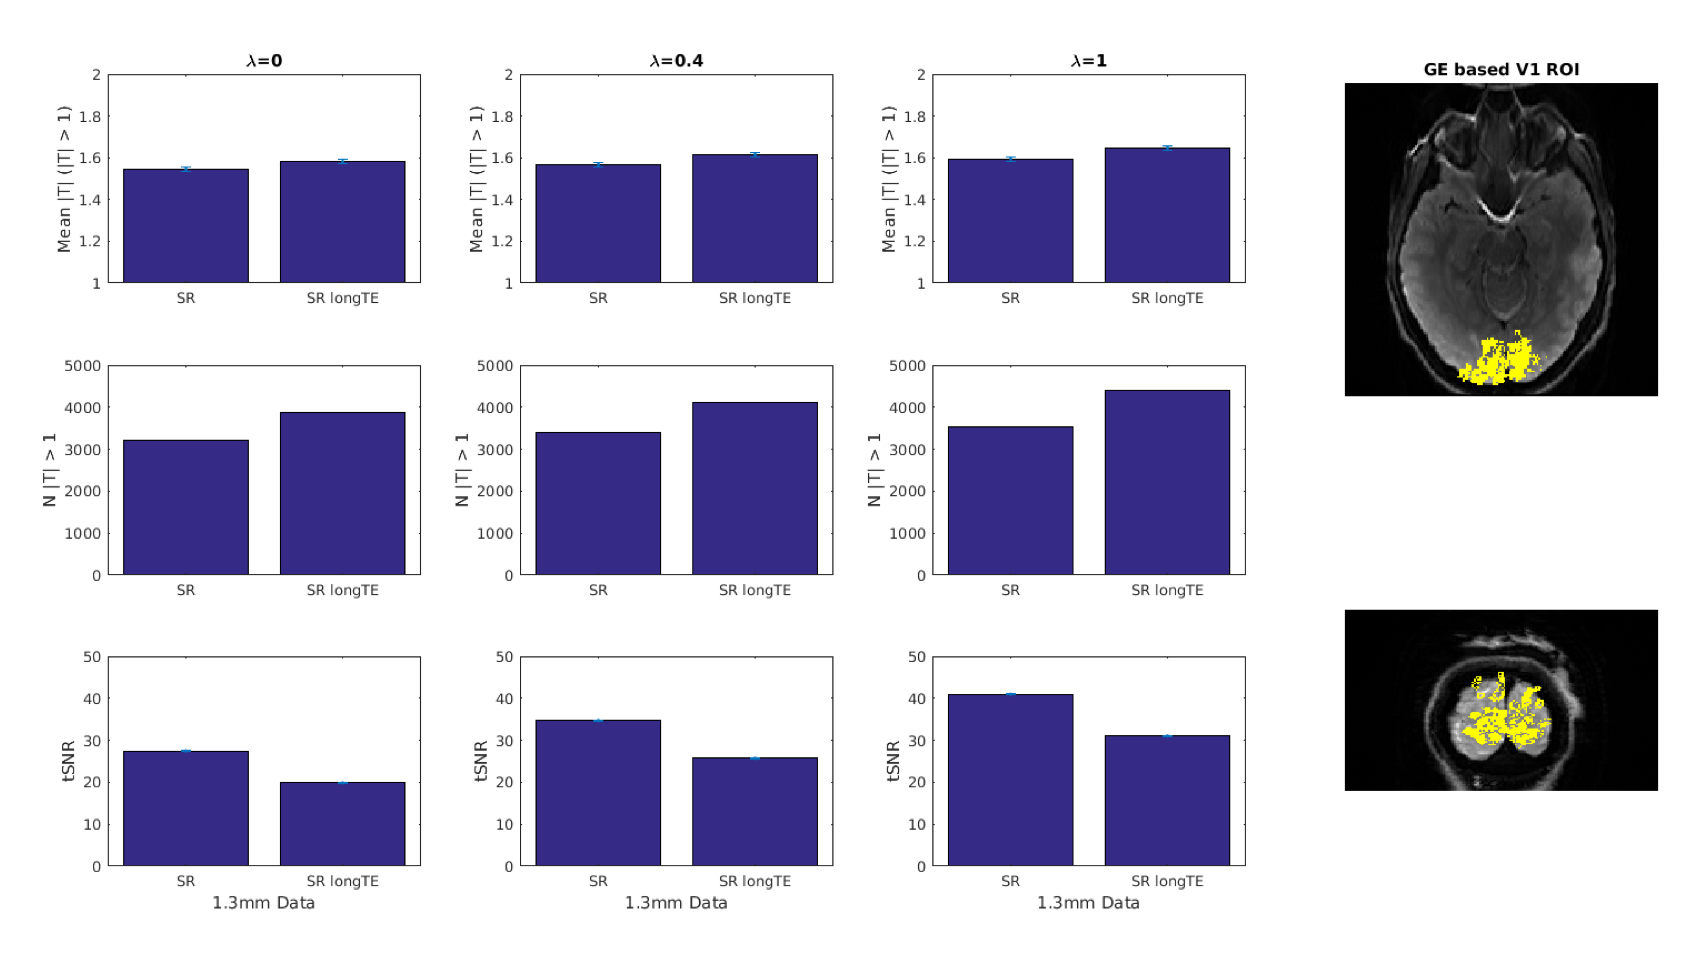
Figure
5 – Mean T values above threshold, voxels above threshold and tSNR for 1.3 mm
data in a visual cortex ROI.