2694
A setup for 3 T submillimeter layer-dependent fMRI weighted toward microvasculature1Center of Integrative Neuroscience, Aarhus University, Århus N, Denmark
Synopsis
The field of layer-dependent fMRI is challenged by draining veins hampering the spatial specificity, and low SNR due to small voxel sizes. Here we present a setup for layer-dependent fMRI that aims to tackle these problems, while being feasible at highly available and clinically approved 3T systems. It relies on recently published post-processing techniques for thermal noise reduction and removal of response components weighted toward macrovasculature. Our initial results suggest sufficient sensitivity for detection of robust layer specific signals. Furthermore, statistical maps are largely free from superficial bias and previously reported double stripe features emerge, indicating strong weighting toward microvasculature.
Introduction
Functional MRI in the submillimeter domain, allows detection of signal changes from individual divisions of cortical layers in the human brain. This is valuable as distinct types of processing are localized to specific cortical layers, thereby potentially enabling researchers to dissociate e.g., feedforward vs. feedback related activation. One of the main obstacles to layer specific fMRI is limited SNR due to small voxel sizes 1, which is usually dealt with by moving to 7T. However, this puts strong constraints on the availability of the method as 7T systems are still relatively rare, and clinically approved ones, even more so. Another concern is superficial bias in observed responses, caused by draining veins, limiting the spatial specificity. This applies in particular to BOLD fMRI based on GE-EPI which remains the most popular sequence due to its superior functional sensitivity 2, but also to single-shot SE-EPI with long readout windows 3. An alternative approach is CBV based fMRI e.g. through VASO 4,5 but the timing of the inversion pulse needed for nulling of the blood introduces constraints on parameter choices and temporal resolution, and the SNR is even more limited than it is for BOLD fMRI. Here we present a layer-fMRI approach at 3T which seeks to effectively tackle both of these problems. It relies on two recently published post processing algorithms namely NORDIC 6, which suppresses thermal noise in fMRI time series, and TDM 7, which strives to create two different hemodynamic response functions, an early supposed to identify signal from capillaries, and a late which better identifies large veins. Finally we take advantage of the fact that changes in capillary blood flow should not affect phase images, since their orientation is random, whereas the opposite is the case for draining veins 8. If our method is successful we should see a significant effect of both the early (capillaries) and late (draining veins) HRF in the magnitude images, but mainly of the late HRF in the phase images.Methods
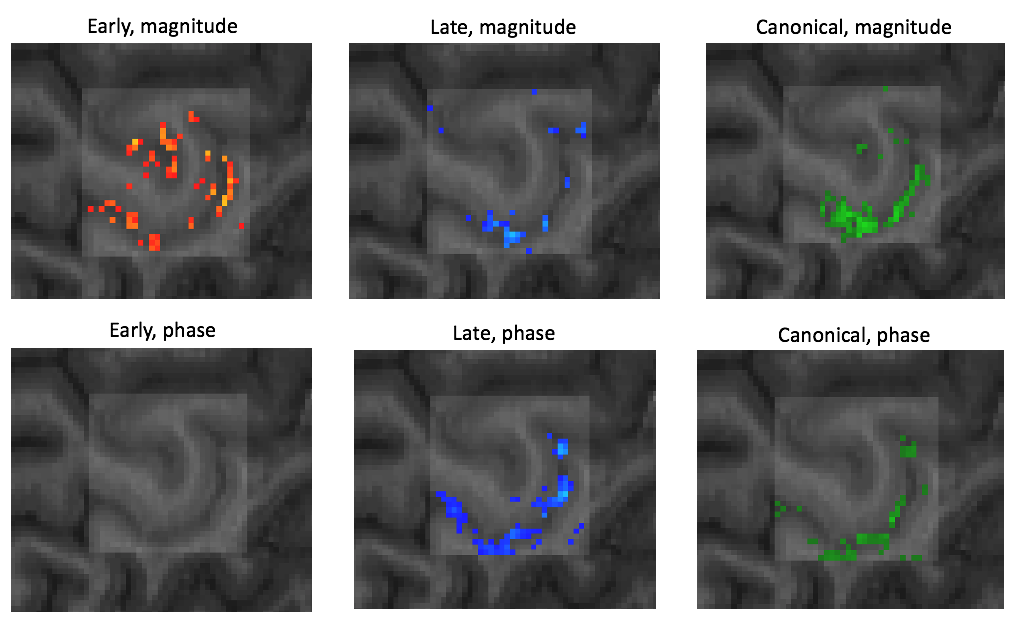
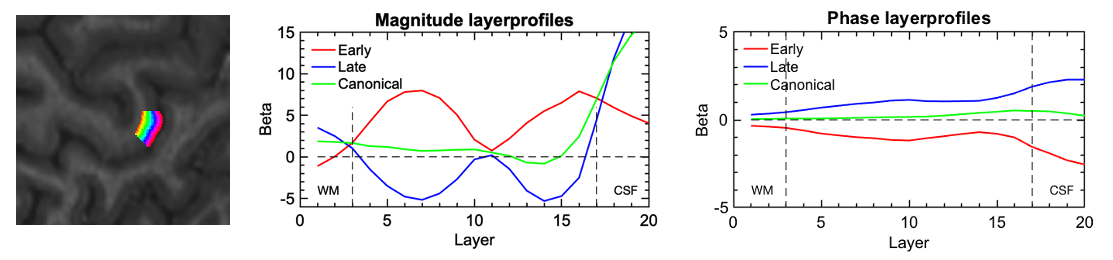
One healthy male subject (age 24), was scanned on a Siemens MAGNETOM Prisma 3T scanner using a standard 32Ch head coil. A 3D GE-EPI sequence (voxel size 820um (isotropic), TR=2201ms) was used for BOLD acquisitions and a SS-SI-VASO sequence 5 with similar resolution and readout strategy was used to acquire a T1-weighted image with high anatomical contrast, and distortions similar to the functional images 9. The paradigm consisted of 2 functional runs with a total duration of ~36 minutes. The subject performed a total of 57, 3xTR long conditions of 2Hz tapping with right index and middle fingers. The tapping conditions were separated by resting conditions with variable durations from (5:15)xTR + [-TR/3, 0, +TR/3], thus effectively sampling the HRF at TR/3 resolution. NORDIC noise reduction was performed on magnitude and phase images, from both sequences. The noise reduced magnitude images were subsequently realigned and resliced, whereas the phase images were converted into real and imaginary parts prior to reslicing using realignment parameters estimated from the magnitude images. These resliced (complex) images were converted back to phase values and unwarped in the temporal direction. We then performed TDM on the realigned magnitude images yielding early and late HRFs, which after convolution with the stimulus onset function were used as main regressors in a standard GLM procedure. Magnitude and phase time series were analysed separately with the same GLMs and contrasts of interest, resulting in 3 statistical parametric maps reflecting early, late and combined responses for both magnitude and phase time series. The maps of early and late responses were thresholded to contain only the 1000 highest t-values from the union of the two maps, thereby providing a qualitative visualisation of the distribution between the two responses across voxels. Mid-WM and mid-CSF boundaries were manually drawn within an M1 ROI covering the index and middle finger representation of the left hand knob. Between these boundaries we computed 20 equidistance layers using LAYNII 10. Parameter estimates (beta) from each GLM, were averaged across voxels within each layer to create profiles representing BOLD amplitude as a function of cortical depth.Results
Results are shown in figures 1-3.Discussion
The two HRF waveforms (Figure 1) extracted from the magnitude images both resemble previously observed HRFs. Their waveforms differed only slightly, with less than a second on the rising edge, and a somewhat larger undershoot for the early response. However, when the early and late HRFs are used simultaneously in the same design matrix, quite different patterns emerge in the corresponding statistical maps (Figure 2). Magnitude images show a significant effect of both early and late HRF responses, with early responses mainly constrained to the cortex, and late responses mainly constrained to the superficial GM and visible larger veins in CSF. In contrast, for the phase images, we exclusively observed a positive effect of the late HRF, and again mainly constrained to the larger veins. Together with a double peaked profile 9 of beta values across cortical depths for the early response (Figure 3), this indicates that layer specific fMRI can be obtained at 3T, using GE-EPI BOLD and comprehensive dataprocessing.Acknowledgements
We would like to thank Rüdiger Stirnberg and Renzo Huber for providing access to the 3D EPI sequence, and Steen Moeller for giving access to the NORDIC software.References
Weldon, Kimberly B., and Cheryl A. Olman. 2021. “Forging a Path to Mesoscopic Imaging Success with Ultra-High Field Functional Magnetic Resonance Imaging.” Philosophical Transactions of the Royal Society B: Biological Sciences 376(1815): 20200040. https://royalsocietypublishing.org/doi/10.1098/rstb.2020.0040.
Stanley, Olivia W et al. 2020. “Effects of Phase Regression on High-Resolution Functional MRI of the Primary Visual Cortex.” NeuroImage: 117631. https://linkinghub.elsevier.com/retrieve/pii/S1053811920311162.
Goense, Jozien B.M., and Nikos K. Logothetis. 2006. “Laminar Specificity in Monkey V1 Using High-Resolution SE-FMRI.” Magnetic Resonance Imaging 24(4): 381–92. https://linkinghub.elsevier.com/retrieve/pii/S0730725X06000506.
Lu, H., Golay, X., Pekar, J. J., & van Zijl, P. C. M. (2003). Functional magnetic resonance imaging based on changes in vascular space occupancy. Magnetic Resonance in Medicine, 50(2), 263–274. http://doi.org/10.1002/mrm.10519
Huber, Laurentius et al. 2014. “Slab-Selective, BOLD-Corrected VASO at 7 Tesla Provides Measures of Cerebral Blood Volume Reactivity with High Signal-to-Noise Ratio.” Magnetic Resonance in Medicine 72(1): 137–48.
Moeller, Steen et al. 2020. “NOise Reduction with DIstribution Corrected (NORDIC) PCA in dMRI with Complex-Valued Parameter-Free Locally Low-Rank Processing.” NeuroImage 226: 117539. https://linkinghub.elsevier.com/retrieve/pii/S1053811920310247.
Kay, Kendrick, Keith W. Jamison, Ru Yuan Zhang, and Kamil Uğurbil. 2020. “A Temporal Decomposition Method for Identifying Venous Effects in Task-Based FMRI.” Nature Methods 17(10): 1033–39.
Menon, Ravi S. 2002. “Postacquisition Suppression of Large-Vessel BOLD Signals in High-Resolution FMRI.” Magnetic Resonance in Medicine 47(1): 1–9.
Huber, Laurentius et al. 2017. “High-Resolution CBV-FMRI Allows Mapping of Laminar Activity and Connectivity of Cortical Input and Output in Human M1.” Neuron 96(6): 1253-1263.e7.
Huber, Laurentius et al. 2020. “LAYNII: A Software Suite for Layer-FMRI.” bioRxiv: 1–20. https://www.biorxiv.org/content/early/2020/06/14/2020.06.12.148080.
Figures
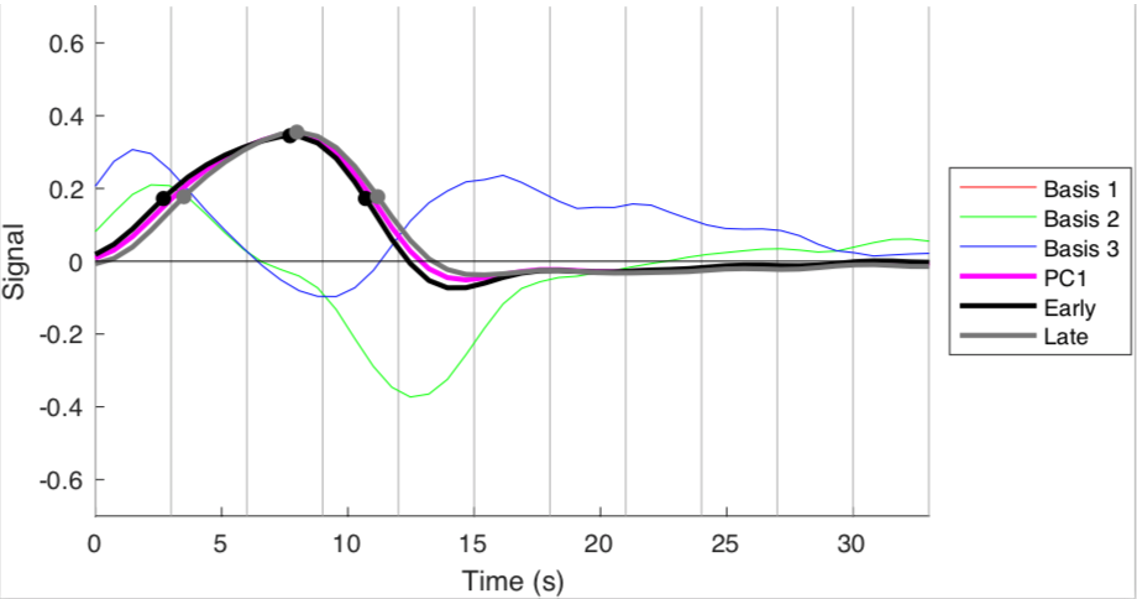
Figure 1: The two waveforms (early and late) extracted from the magnitude images, using the TDM method. The profiles are seen to differ slightly on their rising edge, and at the post stimulus undershoot.