2693
Multi-echo BOLD Index: Figuring out false positive and providing detailed activation patterns in task fMRI1Department of Radiology, Medical Physics, Faculty of Medicine, Medical Center - University of Freiburg, Freiburg, Germany, 2Maastricht Brain Imaging Centre, Faculty of Psychology and Neuroscience, Maastricht University, Maastricht, Netherlands
Synopsis
We introduced a BOLD Index in this abstract. This index can figure out the false positive/non-BOLD voxels from standard fMRI t-test results. It can also provide detailed cortex active patterns. The BOLD Index high value is always marked on gray matter, while, the t-test high value is marked on the CSF or vein in cortex fissure or sulci. T-test answers the question of which voxel is active. The BOLD index tells whether the voxel's response is true BOLD or non-BOLD and how strong.
Introduction
It is clear that fMRI is quite successful in detecting brain activation and brain function related disease during the last past nearly 30 years. However, the false-positive and activation boundary puzzled the scientists in our field quite a lot. In 2009, Bennett1 showed in his famous dead fish experiment that the dead salmon’s brain even became active during photostimulation with standard fMRI analysis. In 2016, Eklund2 showed that the common analysis software (SPM, FSL, AFNI) can result in 70% false-positive using 5% false-positive hypothesis threshold. In the detection of the activation region, no certain threshold conclusion has been reached to decide which threshold to be used, p=0.01 or p=0.05?Methods
Since the standard fMRI uses only one echo data and the analysis is based on the similarity between response and HRF model. And there is no further data to test whether the response is truth response or false. It has been shown that the true BOLD response increases linearly and the false BOLD (non-BOLD) response stays steady as TE increases3-5. In this abstract, we acquired 3 echoes to test the response’s authenticity.Experiment and Data Processing
Experiment
16 healthy volunteers (9 female, 7 male, average age 28.2) were scanned for task fMRI. Subjects were informed to stay still and do the right-hand finger tapping along with visual stimulus. Our task fMRI data were acquired on a 3.0T Siemens MAGNETOM Prismafit scanner (Siemens Healthineers, Erlangen, Germany) equipped with 64-channel Head/Neck coils. The paradigm was a block design shown in Fig. 1. The scan parameters are TR=550ms, TE=[16.00, 33.5, 50.3] ms, slice gap=25%, GRAPPA=2, SMS=4, voxel size=3*3*4 mm3 and FOV=192*192*120mm3. The T1 weighted image was also acquired with the same FOV.
Beside, we also did a smaller voxel scan with the size of 2*2*3 mm3 on 2 volunteers under the same paradigm, with parameters TR=1410ms, TE=[14.0, 40.36, 66.72]ms, GRAPPA=2, SMS=3, FOV=184*184*126mm3.
Data Processing
Motion correction was done on the second echo with mcflirt6 to generate 6 motion parameters and these 6 parameters were applied to the first and third echo. These 3 echo data were smoothed to reduce noise with 6mm FWHM Gaussian kernel on 3*3*4 mm3 data and 4mm FWHM Gaussian kernel on 2*2*3 mm3 data. Nonlinear exponential fitting was done to get the exponential curve $$$S=S_0exp(-TE·R_2^*)$$$. The data point on the exponential curve at TE(2) was used as fMRI data in our study, which is less noisy compared with the original echo2 data Fig. 2. The standard t-test was done on this data.
The task HRF for our experiment is generated from the convolution of stimulus BLOCK and SPM canonical HRF. Through linear regression of task HRF on each echo, we get each echo’s signal response amplitude to HRF. Since the relative response amplitude among echoes is
$$\frac{\Delta S}{S}=\frac{\Delta S_{0}}{S_{0}}-TE\cdot \Delta R_{2}^*$$
In this way, we define our BOLD index
$$BOLD \: Index = \frac{1}{e^{\frac{E_{s0}+res-E_{r2}}{res}}+1}$$
where $$$E_{s0}$$$ represents $$$\left | \frac{\Delta S_{0}}{S_{0}} \right |$$$, $$$E_{r2}$$$ represents $$$\left | TE\cdot \Delta R_{2}^* \right |$$$ and these parameters are shown in Fig. 3. $$$res$$$ is the fitting residual which represents the uncertainty of fitting. $$$E_{s0}$$$, $$$res$$$ are considered non-BOLD signal and $$$E_{r2}$$$ is considered as BOLD signal. The BOLD Index is inspired by Fermi-Dirac distribution which is used to describe the spin-up and spin-down two state system, here we used it to describe BOLD and non-BOLD.
Results
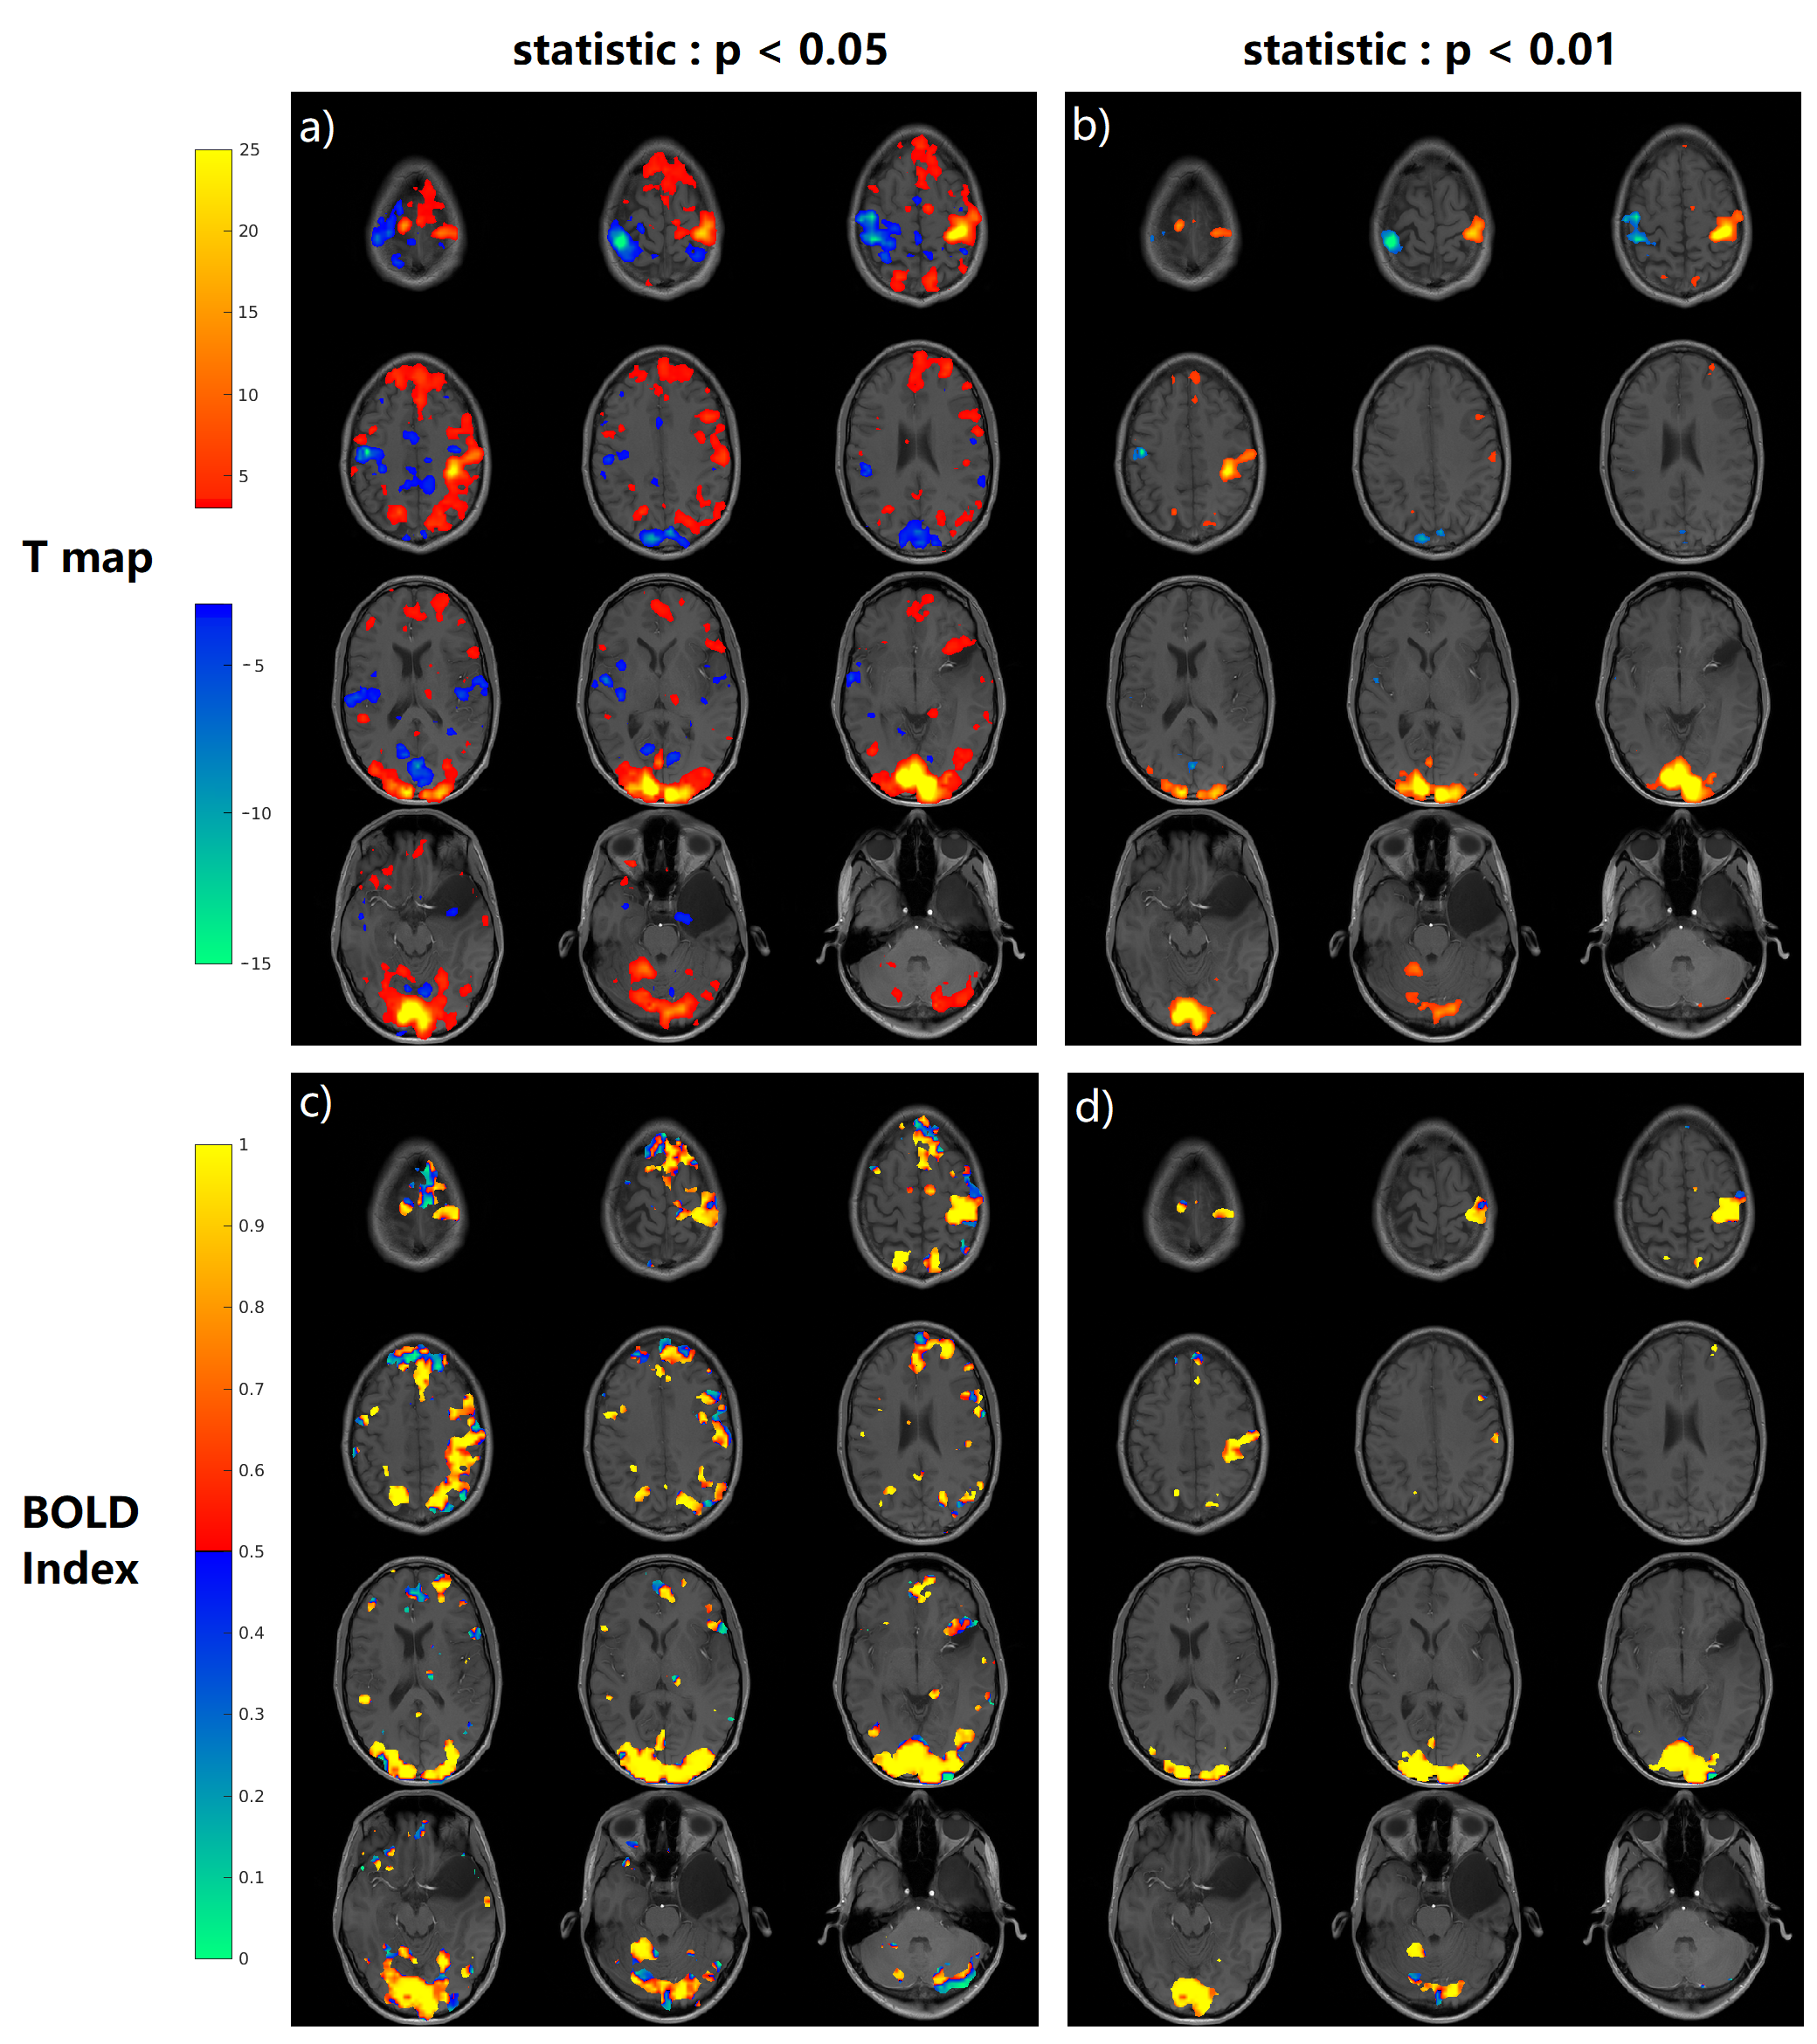
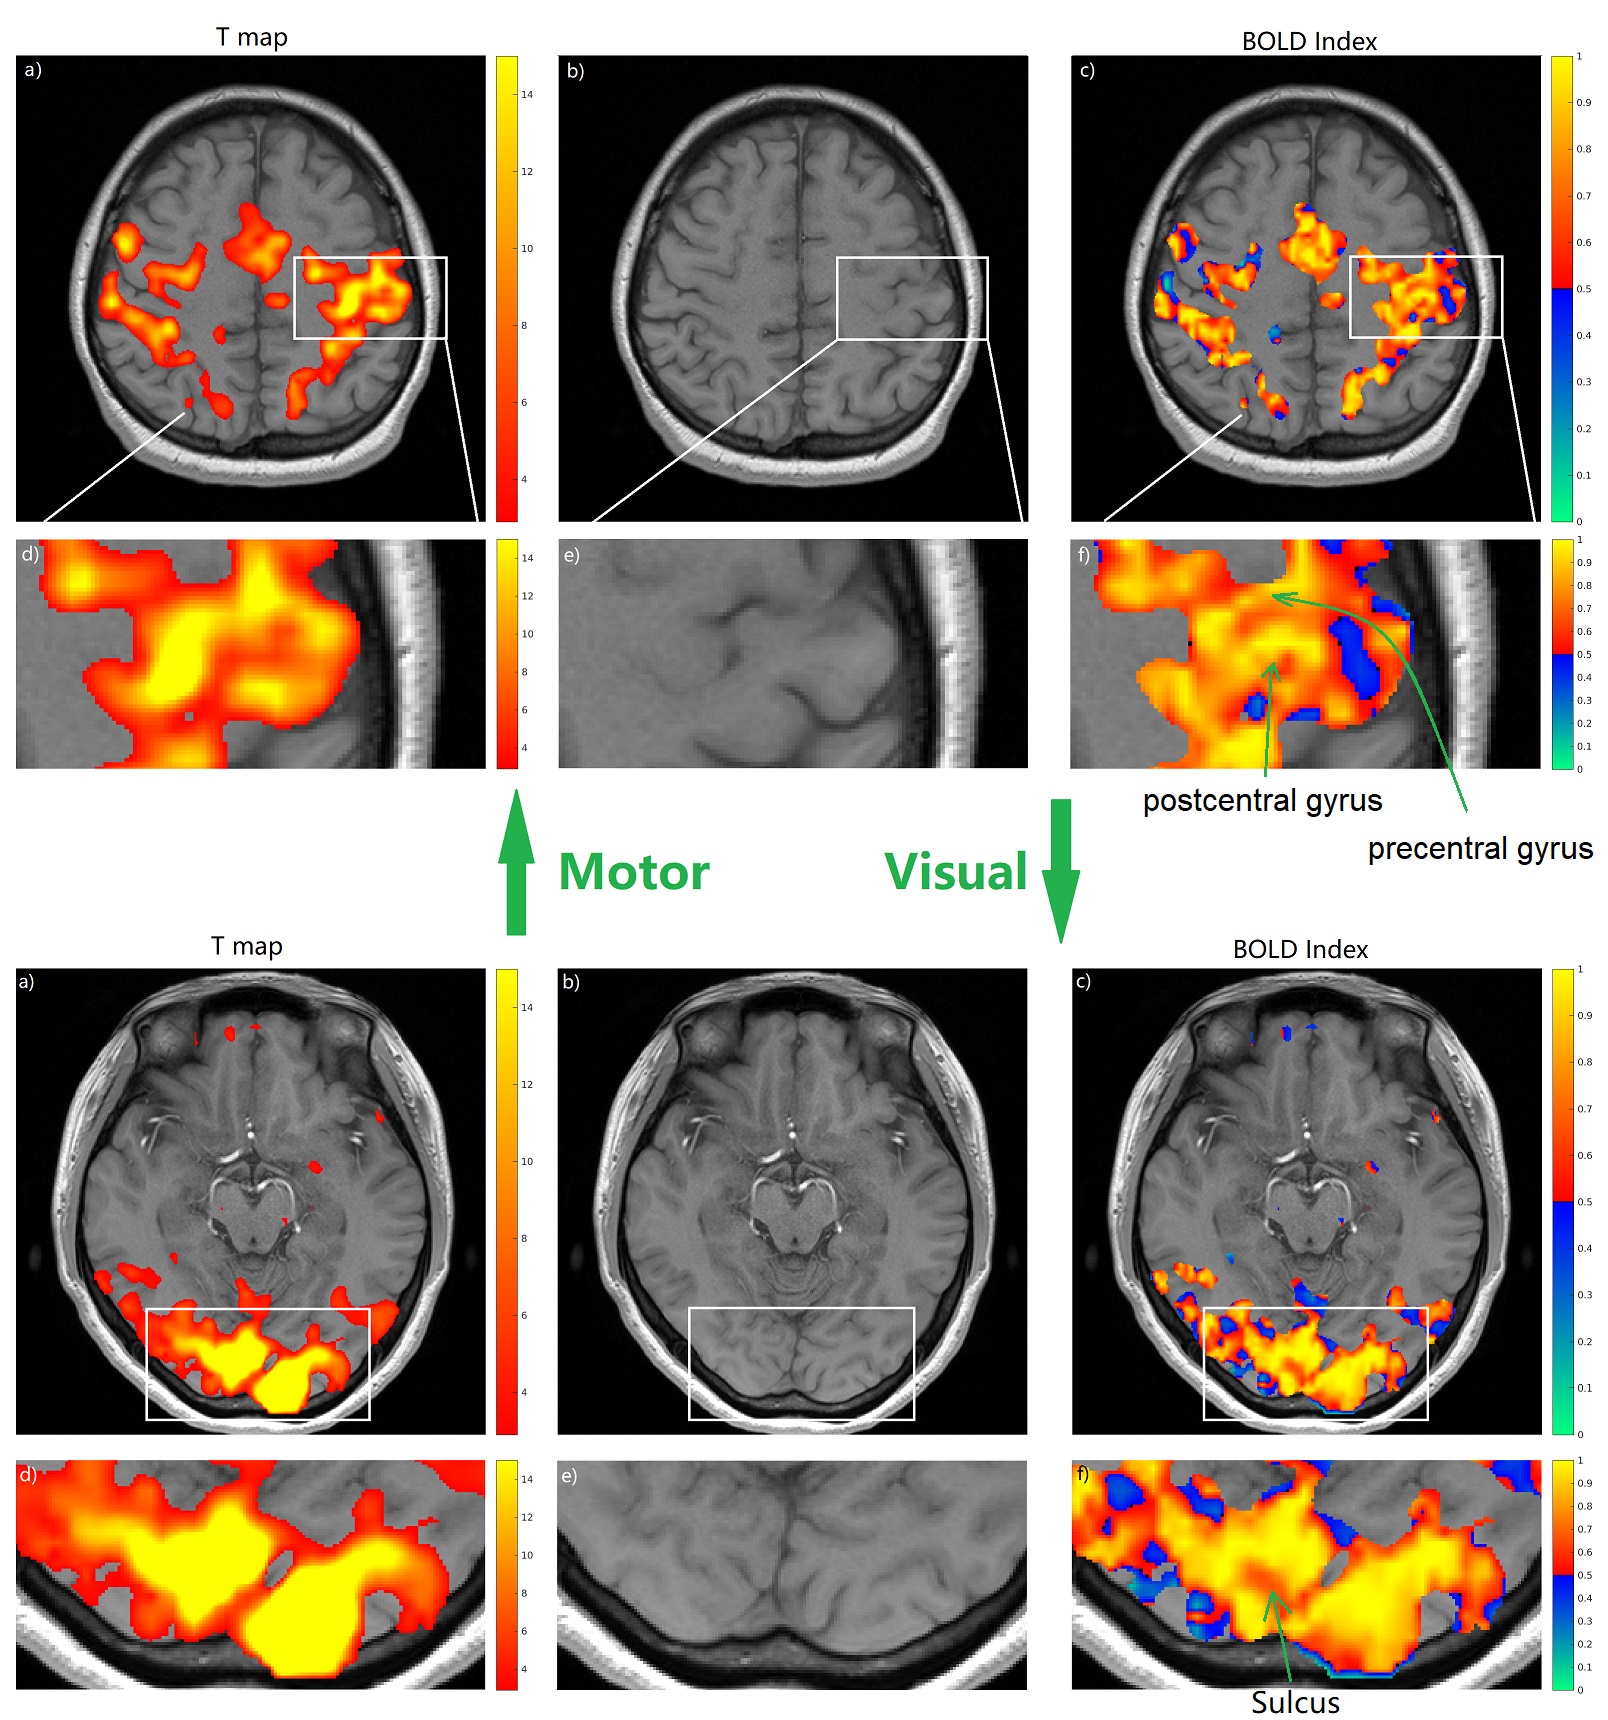
As the results from all the subjects have similar behavior, we take one of the subjects as an example. Fig. 4 is from that subject and it shows that there are more voxels that turn out to be non-BOLD/false positive under p<0.05 t-test compared with p<0.01. And for both thresholds, the false-positive regions are always on the boundary.Fig. 5 shows the BOLD Index on a smaller voxel size 2*2*3 mm3 to suppress the partial volume effect. Fig.5 f) from motor cortex shows that BOLD Index can distinguish precentral gyrus and postcentral gyrus and t-test in d) can’t. Fig. 5 f) for visual cortex shows that BOLD Index can point out the sulci/fissure on the active visual cortex and t-test d) shows a general gross mapping where the sulci/fissure are also considered active.
Discussion
The BOLD Index can identify the false positive voxels within the standard t-test cluster. The p=0.05 threshold contains more false-positive voxels, and these false-positive regions are always located at the boundary. Further, BOLD Index could also be used to locate the true cortex activation patterns which are usually on the gray matter instead of on CSF or vessels in fissure or sulci result from t-test. In 2015 and 2018, Huber7,8 et al also reported similar CSF activation problems in standard fMRI t-test and they used VASO sequence to suppress the signal from CSF and vessels.Conclusion
The BOLD Index could be used in brain function location to provide accurate boundary (getting rid of false-positive and keeping real BOLD signal) and generate detailed cortex activation patterns. And it is better to use a loose threshold like p=0.05 for t-test analysis and then figure out the false positive with BOLD Index to produce an accurate function region, which will help guide the brain surgery in an accurate way.Acknowledgements
This work was supported by the China Scholarship Council (CSC) NO. 201406180073 and Koselleck.References
1. Bennett C, Miller M, Wolford G. Neural correlates of interspecies perspective taking in the post-mortem Atlantic Salmon: An argument for multiple comparisons correction. Neuroimage. 2009 Jul 1;47(Suppl 1):S125.
2. Eklund A, Nichols TE, Knutsson H. Cluster failure: Why fMRI inferences for spatial extent have inflated false-positive rates. Proceedings of the national academy of sciences. 2016 Jul 12;113(28):7900-5.
3. Speck O, Hennig J. Functional Imaging by I0‐and T2*‐parameter mapping using multi‐image EPI. Magnetic resonance in medicine. 1998 Aug;40(2):243-8.
4. Kundu P, Inati SJ, Evans JW, Luh WM, Bandettini PA. Differentiating BOLD and non-BOLD signals in fMRI time series using multi-echo EPI. Neuroimage. 2012 Apr 15;60(3):1759-70.
5. Olafsson V, Kundu P, Wong EC, Bandettini PA, Liu TT. Enhanced identification of BOLD-like components with multi-echo simultaneous multi-slice (MESMS) fMRI and multi-echo ICA. Neuroimage. 2015 May 15;112:43-51.
6. Jenkinson, M., Bannister, P., Brady, J. M. and Smith, S. M. Improved Optimisation for the Robust and Accurate Linear Registration and Motion Correction of Brain Images. NeuroImage, 17(2), 825-841, 2002.
7. Huber L, Goense J, Kennerley AJ, Trampel R, Guidi M, Reimer E, Ivanov D, Neef N, Gauthier CJ, Turner R, Möller HE. Cortical lamina-dependent blood volume changes in human brain at 7 T. Neuroimage. 2015 Feb 15;107:23-33.
8. Huber L, Ivanov D, Handwerker DA, Marrett S, Guidi M, Uludağ K, Bandettini PA, Poser BA. Techniques for blood volume fMRI with VASO: From low-resolution mapping towards sub-millimeter layer-dependent applications. Neuroimage. 2018 Jan 1;164:131-43.
Figures
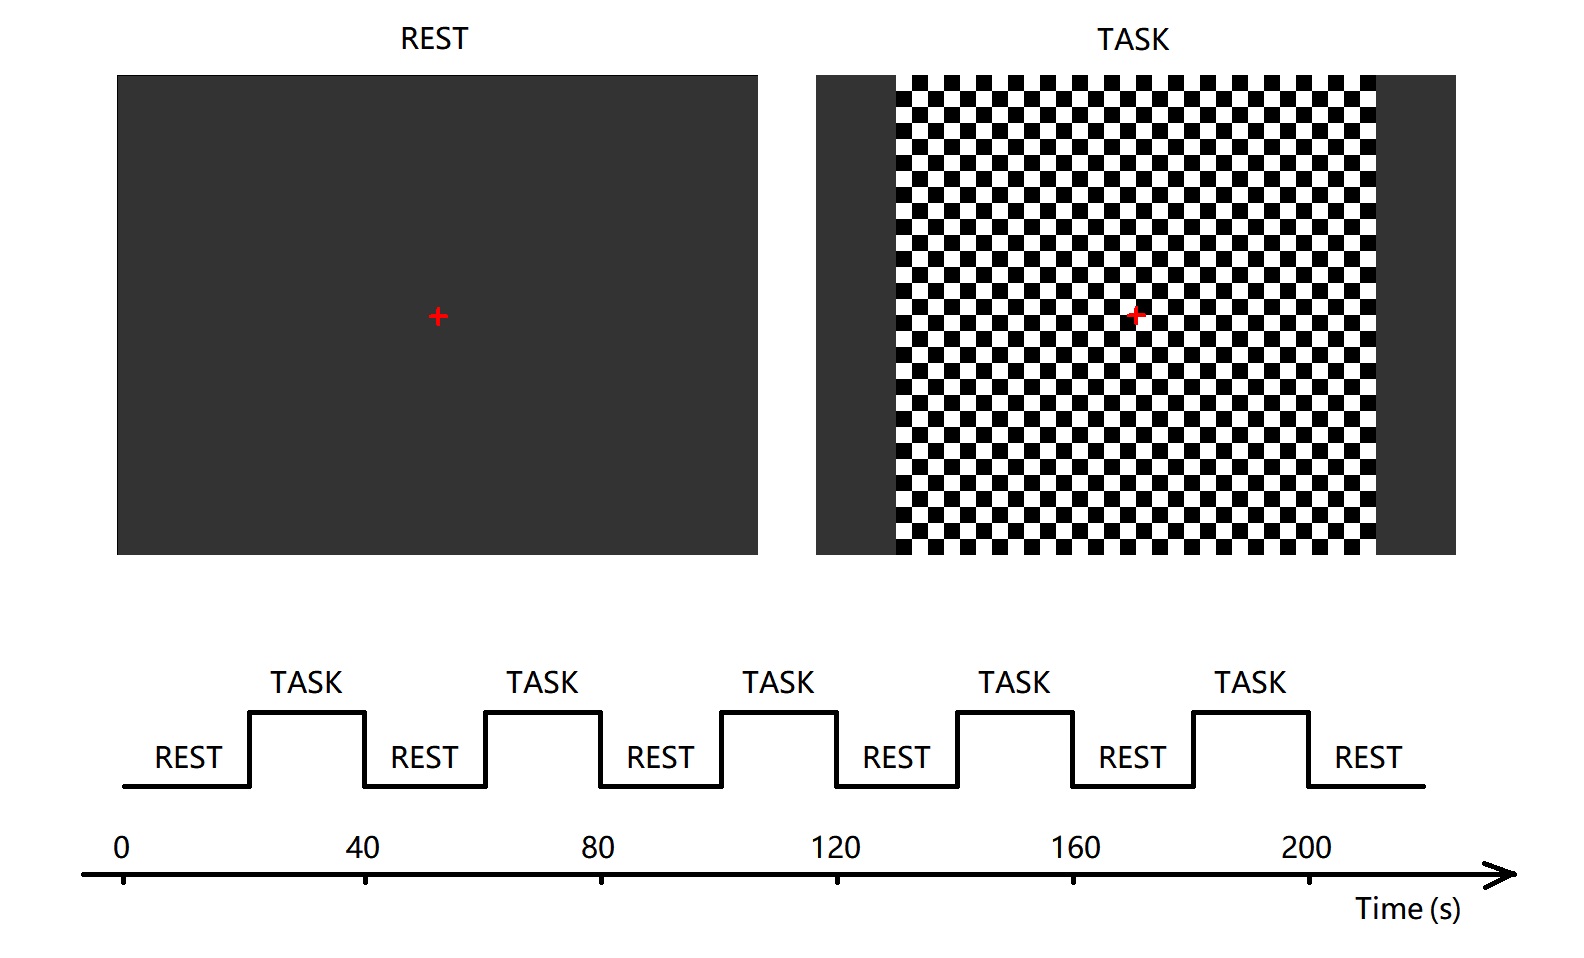
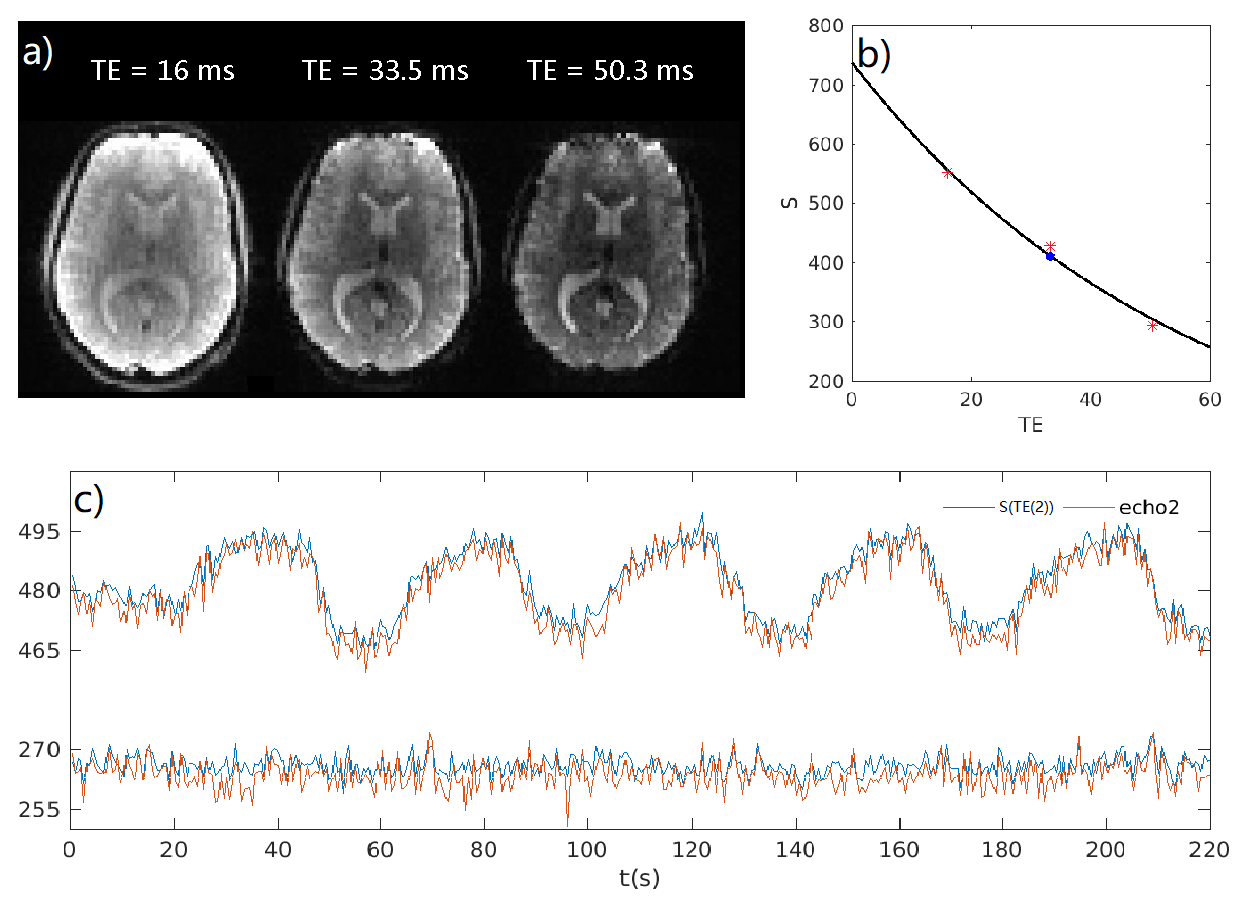
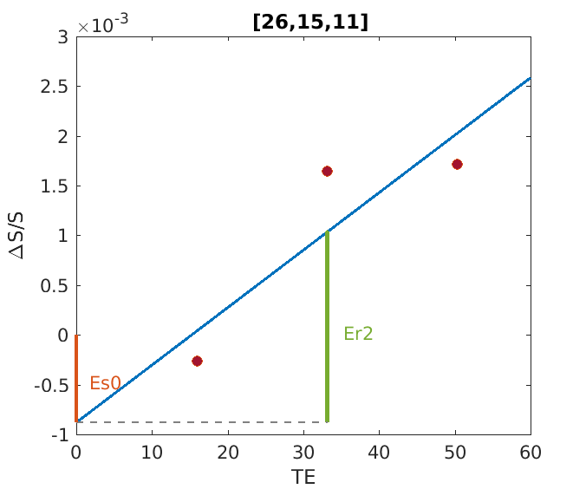
Fig. 3, The relative response amplitude among echoes and their linear fitting. How Es0, Er2 are defined for BOLD Index are also displayed on this figure and the data is from on one subject’s [26, 15, 11] voxel.