2692
An Efficient FMRI Data Reduction Strategy Using Neighborhood Preserving Embedding Algorithm1Biomedical Engineering, Dalian University of Technology, Dalian, China, 2Department of Psychiatry, Harvard Medical School, Boston, MA, United States
Synopsis
In neuroscience research, the group analysis using fMRI data for studying functional brain networks/connectivity in brain faces the challenge about information loss during fMRI data dimensionality reduction for increasing dimensionality. Proposed adapted the NPE (Neighborhood Preserving Embedding) stratagem on fMRI datasets, is an effective data reduction method that shows superior performance on efficient data reduction and sufficient information preservation. Our proposed method can strengthen useful group-sharing information and can avoid the limitation of selecting components based on variance of eigenvectors. Therefore, it has better performance on individual and group level outcomes, as well as improvements on the reliability and reproducibility.
Introduction
A major challenge in the past was the unstable and inconsistent of the results confounding true effects of interest and hinder the understanding of brain functionality and connectivity. In this regard, the key contributing factor is the information loss during fMRI data reduction to identify the vital information within group datasets for such analyses. Effective data reduction method is crucial to ensure the accuracy and stability of the outputs.Methods and Materials
- Simulation Data
Simulation data were comprised by using 6 rest-states brain networks (1) and 6 ground truth time-courses with 284-time points to simulate realistic fMRI signals. Gaussian noise was added for each single time point under the contrast-signal-ratio (CNR) range from 1 to 4 with a step of 0.5. - Real Data
Resting state data from a total of 10 healthy subjects (5 females, age: 30.4±2.2, 5 males, age: 28.8± 2.9) were selected from the Human Connectome Project data repositories having undergone the “minimal preprocessing” procedure (2). For details of the data acquisition parameters see (3). To minimalize the effects of data acquisition and preprocessing, the only additional preprocessing performed was smoothing data with a kernel of FWHM = 8 voxel by FSL (4). - Adapted NPE method
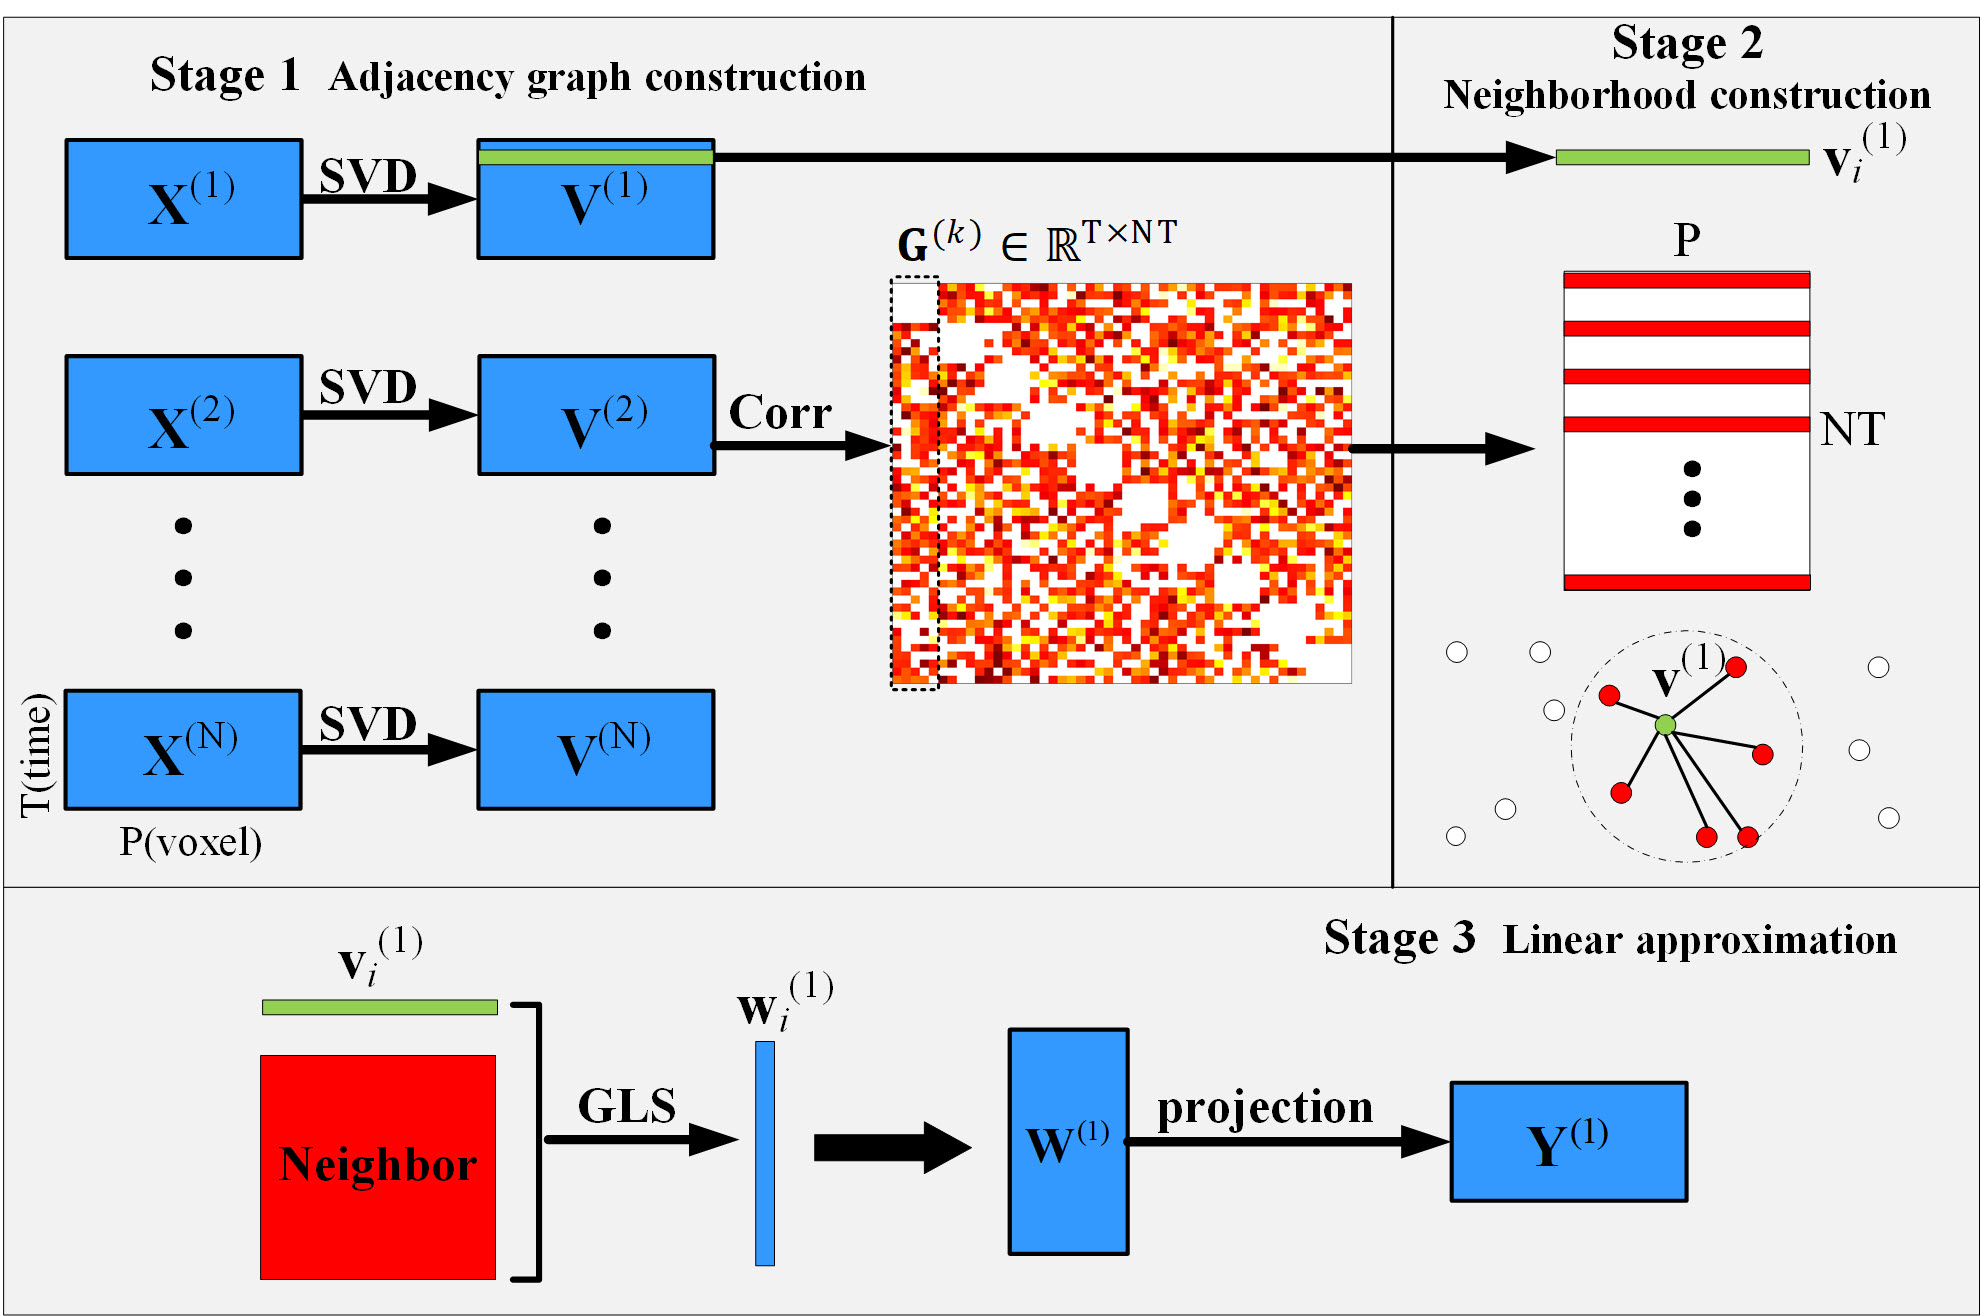
Neighborhood Preserving Embedding, NPE (5), aims to discover the local structure of data manifold to downsize the dimensionality. It constructs the adjacency graph to compute the weights denoted the neighbors. We based on the fundamental idea to using correlation build the neighbors of different subject to identify shared common information between subjects. Considering the redundant information, the correlation weights between one component in single subject and group components will be thresholding to be sparse enough as well as informative. Then the linear approximation is conducted to project the group data into an individual subspace. The graphical illustration of proposed method is shown in Fig. 1.
Results
- Simulation Data
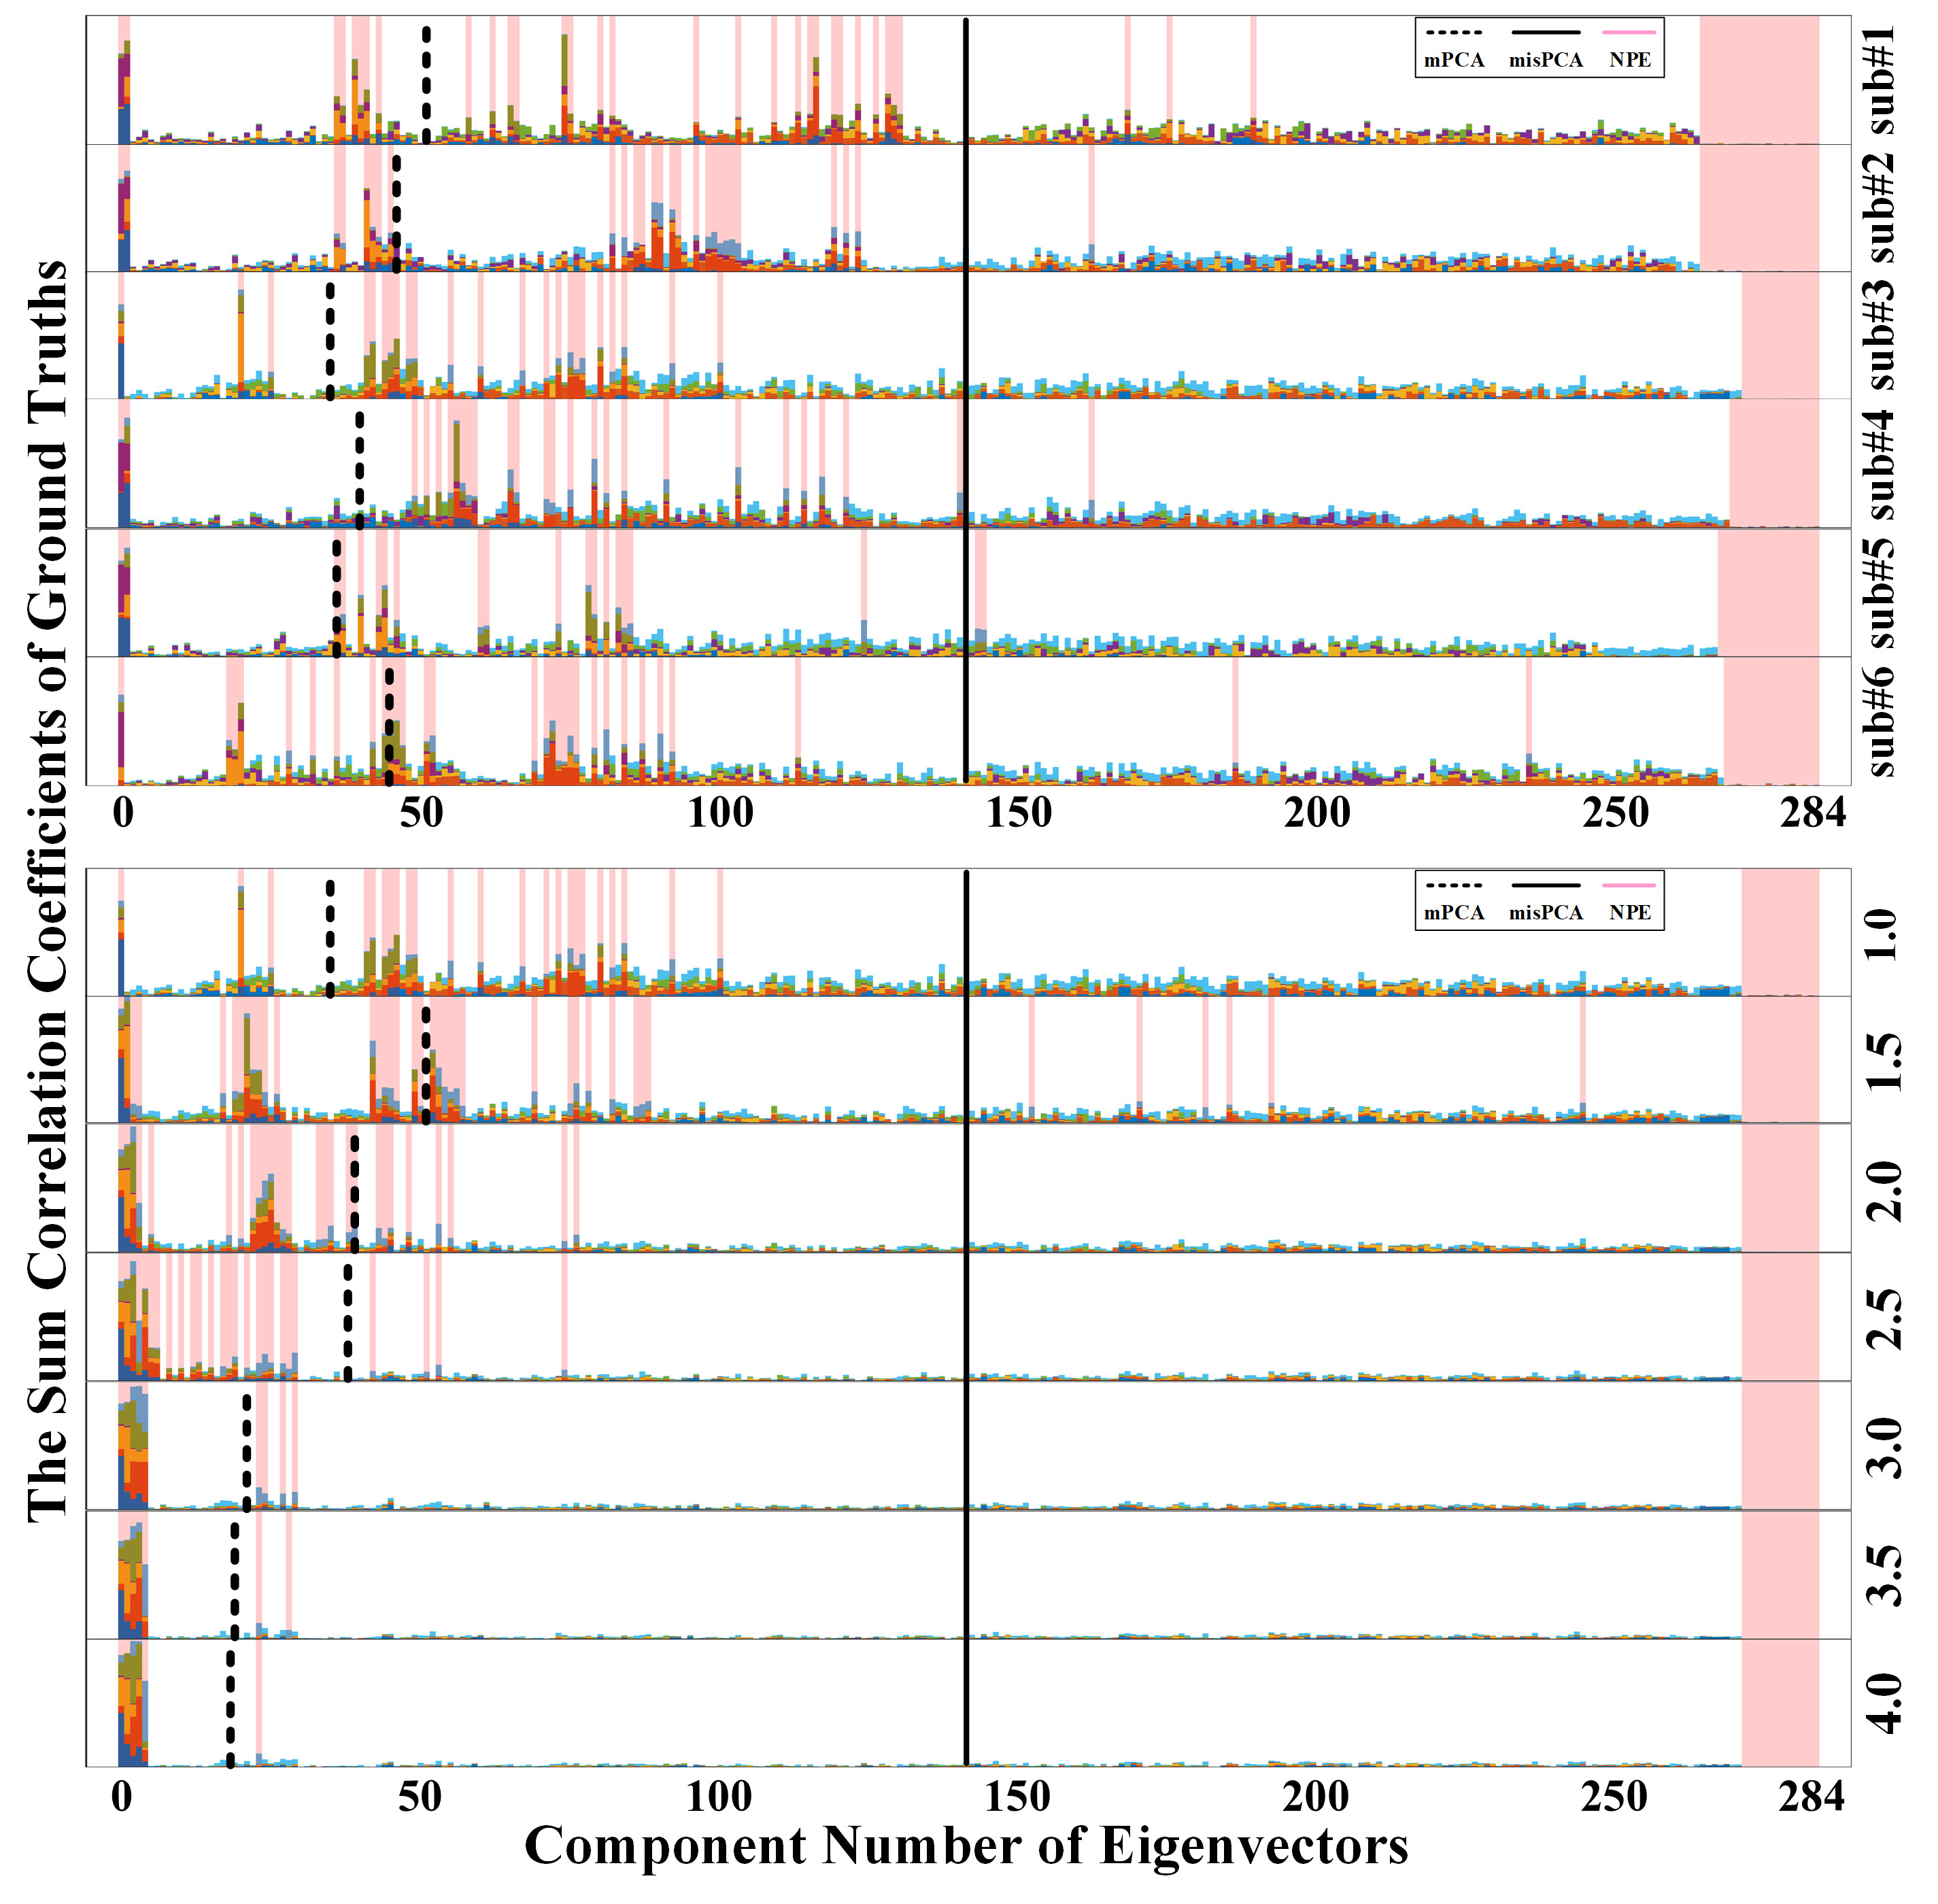
Two different PCA strategies were utilized to reveal why dimensionality reduction can be tricky when dealing with low CNR datasets. One is matched PCA (mPCA) with the same dimensions as NPE neighborhoods’ number, while another one is mismatched PCA (misPCA) that dimensions are not matched but determined by retaining sufficient components. As shown in Fig.2, high eigenvalues do not necessarily mean the component was highly informative. NPE method can select most informative components, even those with smaller eigenvalues, while keeping the highest dimension reduction efficiency.
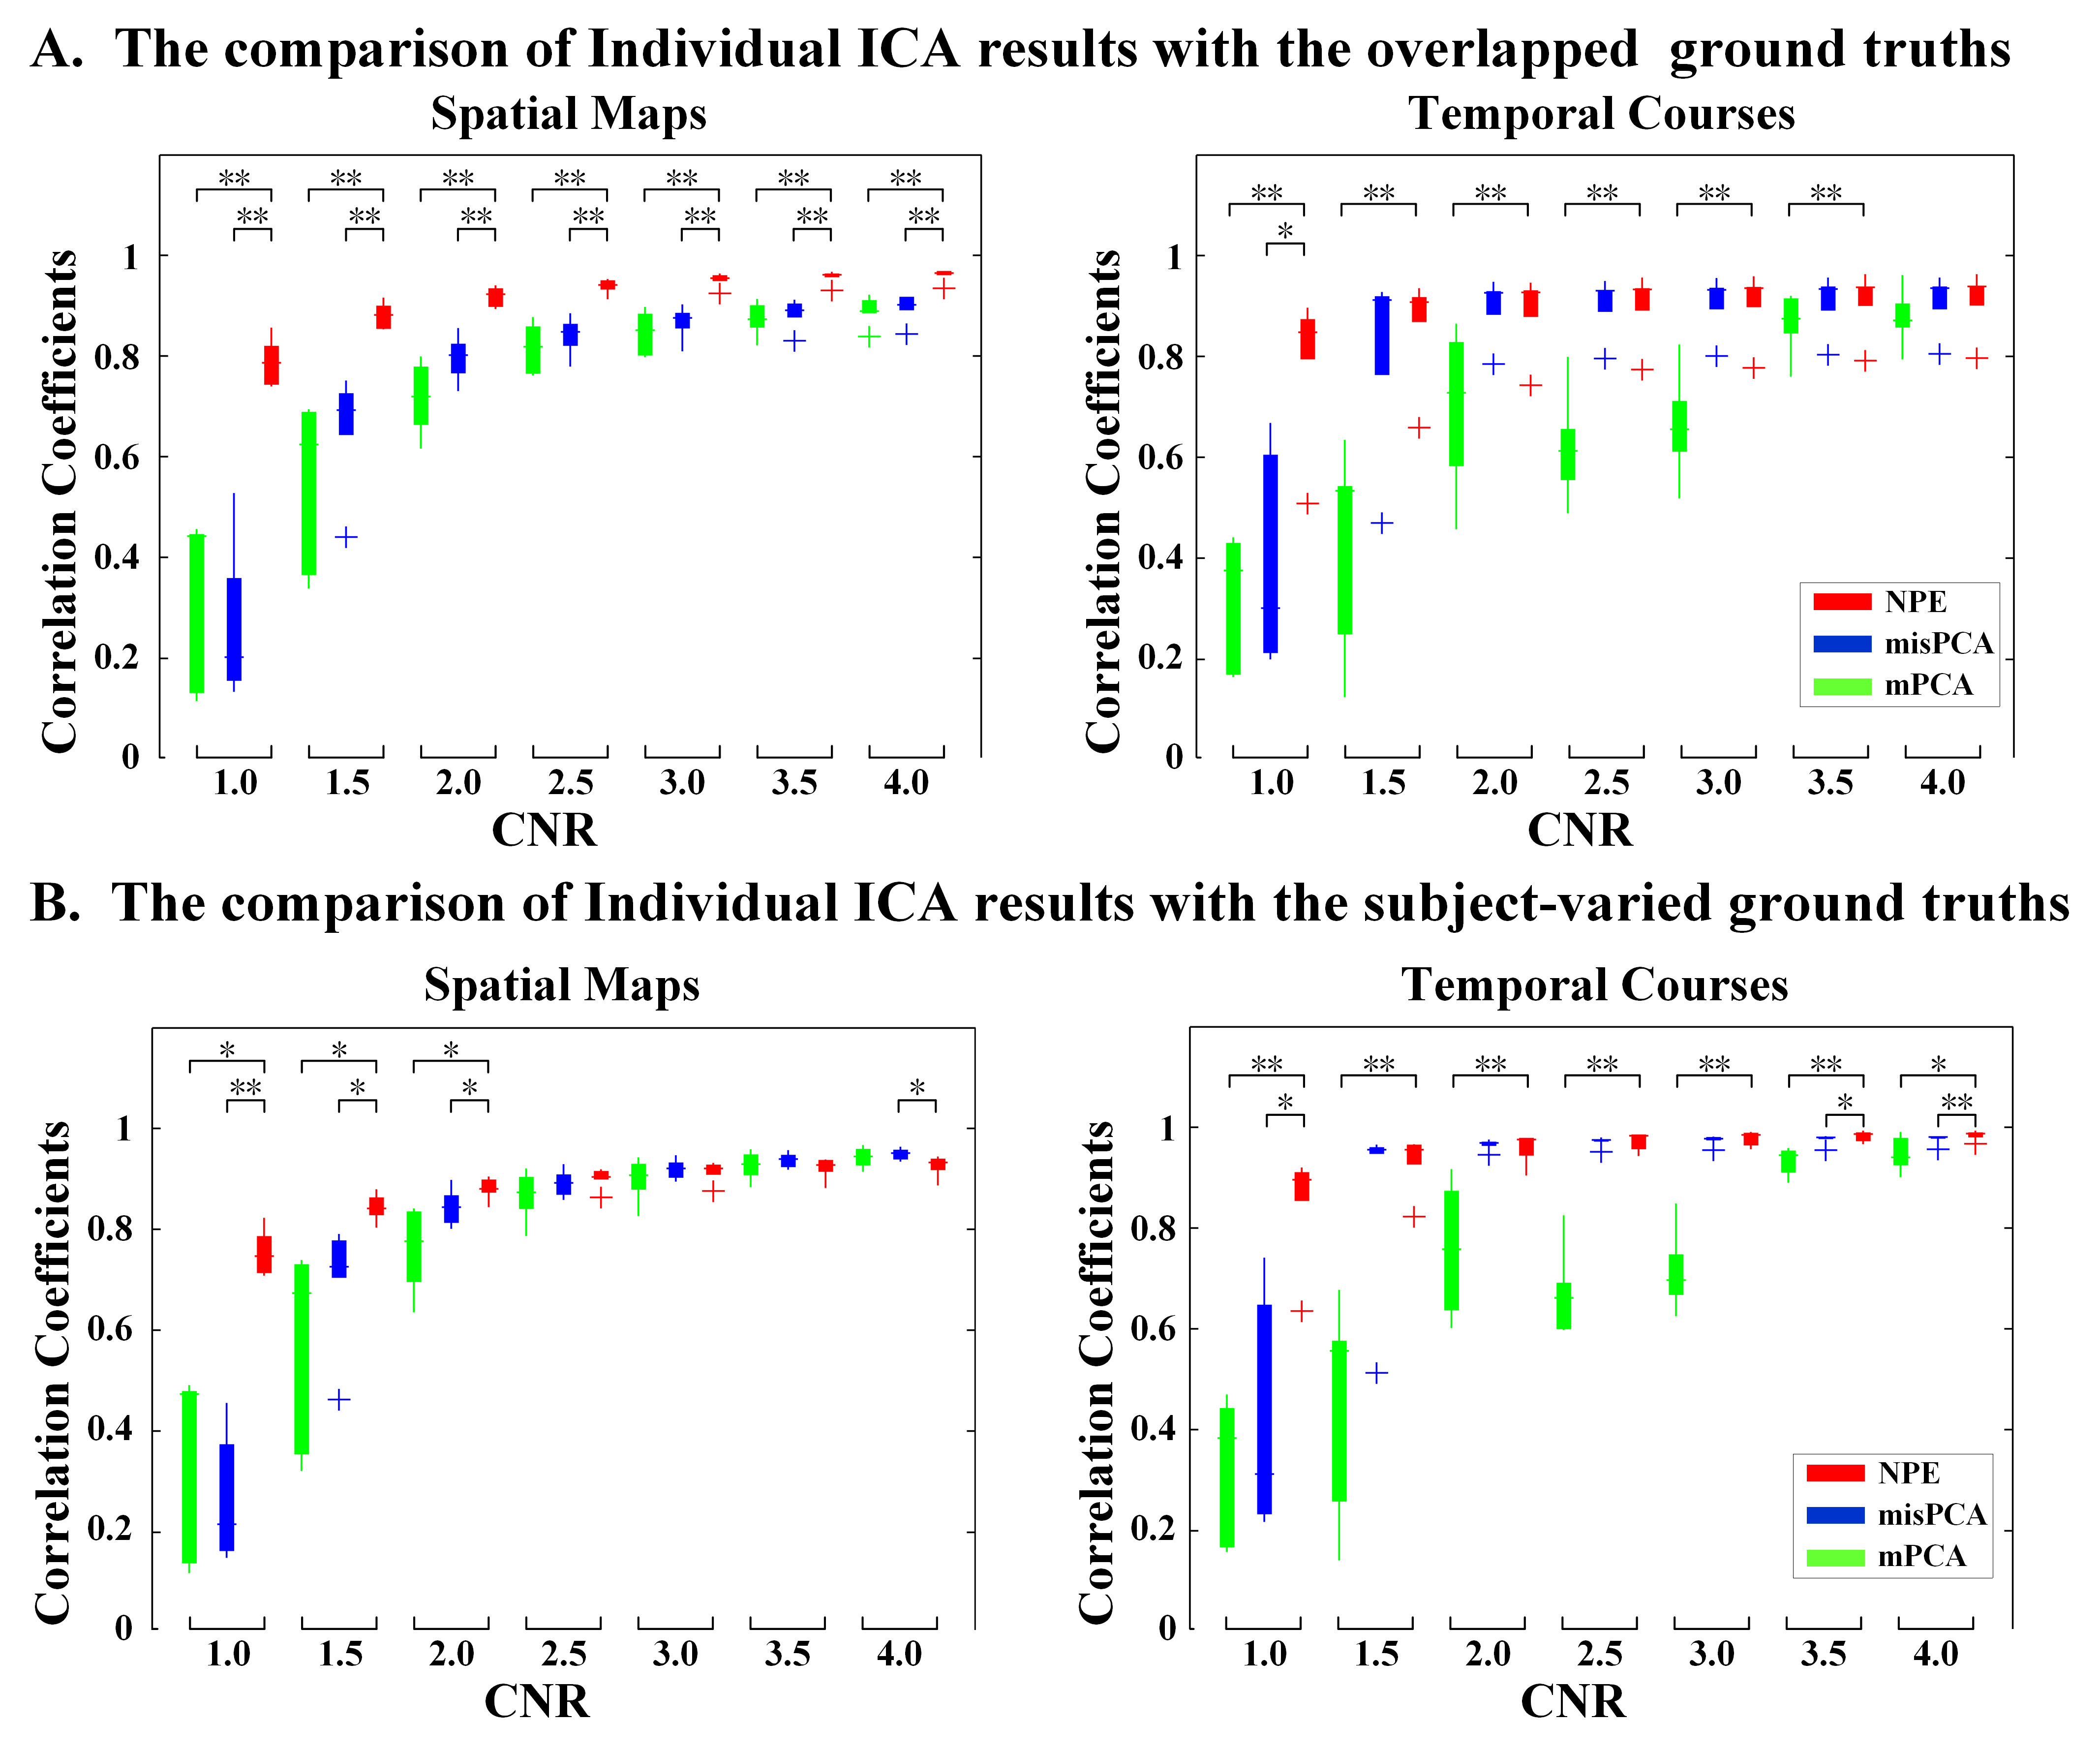
After conducting further decomposition with Independent Component Analysis, the accuracy of extracted independent components (ICs) were evaluated with correlation on both Individual ICA and Group ICA results. For Individual ICA comparison in Fig.3. the NPE-based methods outperformed mPCA and misPCA in recovering group-shared spatial maps of ground truth under all CNR levels, and shows better performance than mPCA (under all CNR levels) and misPCA (under low CNR, CNR<1.5) for subject-specific ground truth. The similar results was found in Group ICA and dual regression (no figures) that NPE outperforms other methods when under low CNR level (CNR < 2.0), and comparable when CNR are high. - Real Data
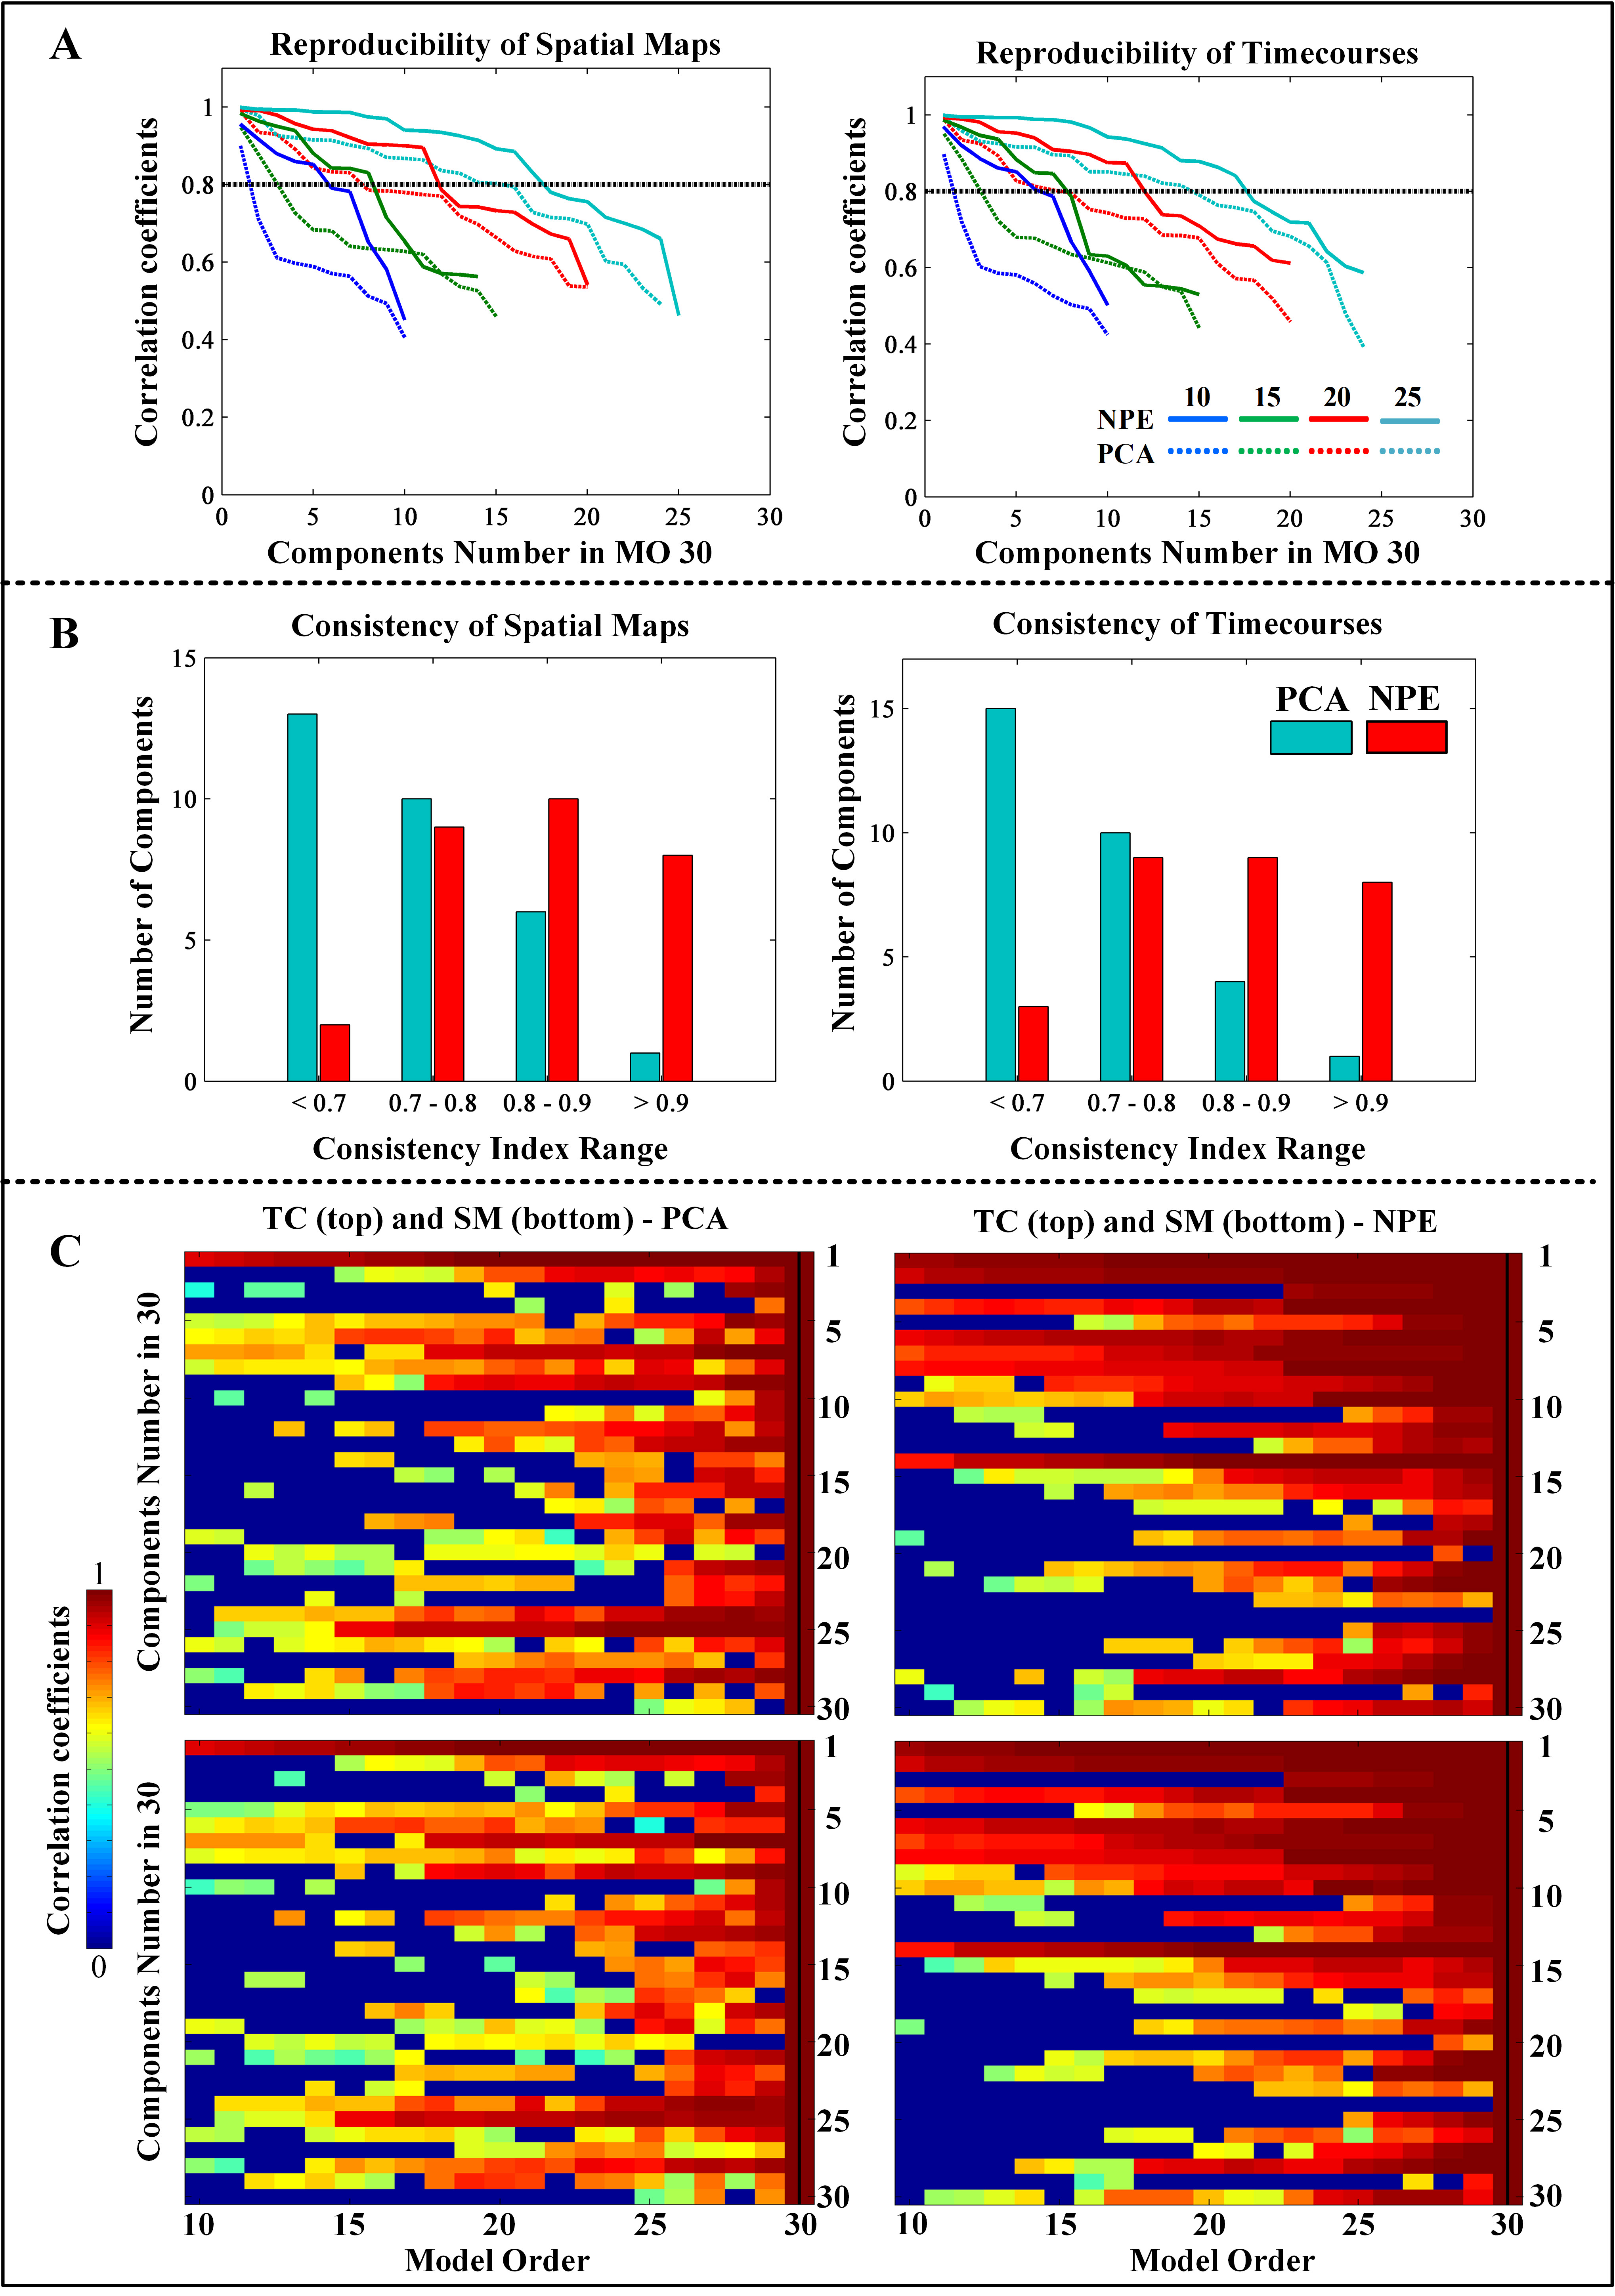
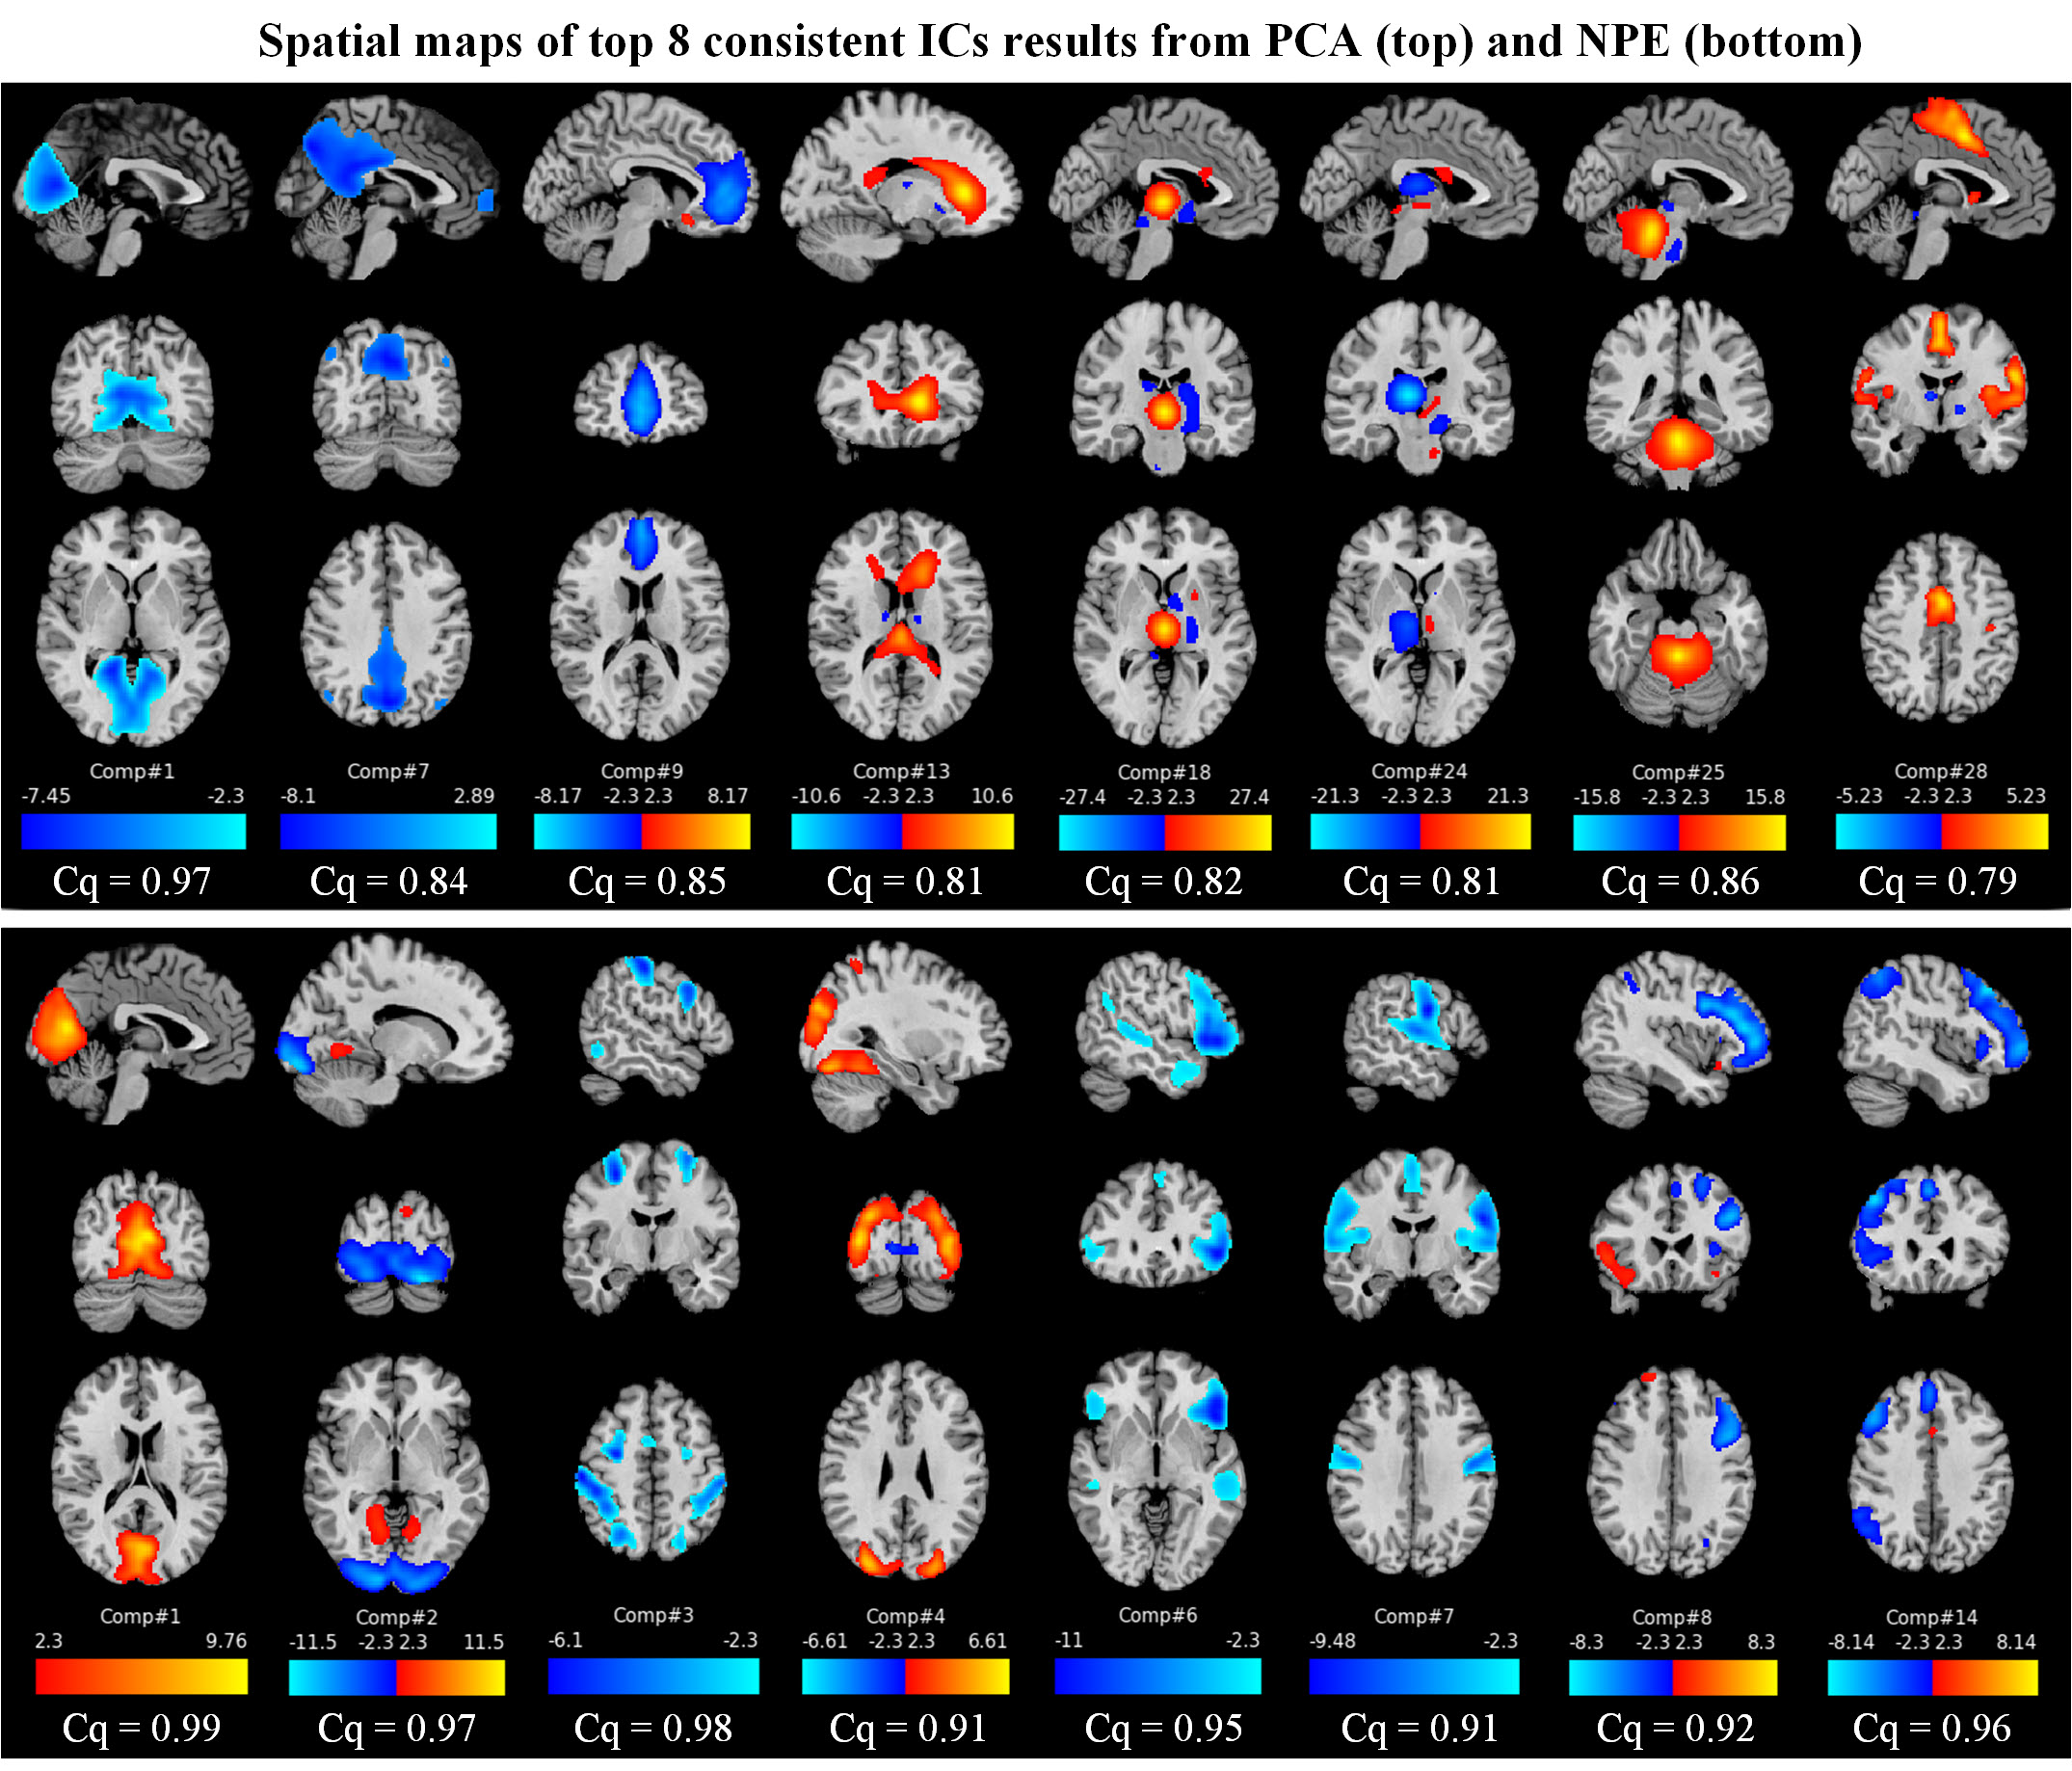
In Fig. 4, the comparison of stability and reproducibility were demonstrated in three different aspects. Fig. 4A showed that the comparisons between PCA (dotted line) and adapted NPE (solid line) are distinguishable that numbers of highly correlated ICs (over 0.8, horizonal black dotted line) from NPE outweighs PCA for both spatial and temporal components. As for the consistent analysis for persistence of IC shown in Fig. 4B, the bar plot shows that the consistent component (consistent index over 0.8) numbers from NPE were larger than PCA, which indicated that ICs from NPE were more stable and reproducible than those from PCA. To represent the results in a more comprehensive way, the visualizations of paired ICs in the consistency analysis were shown in Fig. 4C. Correlation coefficients of the matched ICs from model order 10 to 30 were represented with a hot colormap, and the black horizonal line denotes the 30 ICs in model order 30. The results of NPE had remarkable performance compared to PCA. Because number (length of column) and correlation (hot level of column) of matched components were very clearly larger for NPE on both spatial and temporal components. In Fig. 5, the top 8 highly consistent ICs from NPE and PCA were recovered. The components from NPE and PCA were surprisingly different. Half of the 8 reproducible ICs resulted from PCA were located in brainstem or cerebellum related areas; in contrast, those resulting from NPE were found distributed throughout cortical or sub-cortical areas. That proves the unique advantage of colleting small-variance but group-sharing information for NPE.
Conclusion
Our proposed method proved to be more effective than traditional individual ICA as well as the group ICA in lower SNR for simulation data. And despite the specific individual information loss, the common information highly preserved in individual subspace, at the meantime, the comparison with dual-regression results suggested that our method with Individual ICA decomposition could achieve the same or even better result for individual time-course or spatial maps on both individual and group level. Furthermore, the results of real fMRI data denote a better reproducible and reliable results compared to results from PCA.Acknowledgements
This work was supported by National Natural Science Foundation of China (Grant No. 91748105 & 81601484), and National Foundation in China (No. JCKY 2019110B009 & 2020-JCJQ-JJ-252), and the scholarships from China Scholarship Council (Nos. 202006060130), and the Fundamental Research Funds for the Central Universities [DUT2019, DUT20LAB303] in Dalian University of Technology in China.References
1. J. S. Damoiseaux, et al., Consistent resting-state networks across healthy subjects. Proc. Natl. Acad. Sci. U. S. A. 103, 13848–53 (2006).
2. M. F. Glasser, et al., The Minimal Preprocessing Pipelines for the Human Connectome Project and for the WU-Minn HCP Consortium. Neuroimage 80, 105–12404 (2013).
3. S. M. Smith, et al., Resting-state fMRI in the Human Connectome Project. Neuroimage 80, 144–168 (2013).
4. S. M. Smith, et al., Advances in functional and structural MR image analysis and implementation as FSL. Neuroimage 23, 208–219 (2004).
5. Xiaofei He, Deng Cai, Shuicheng Yan, Hong-Jiang Zhang, Neighborhood preserving embedding in Tenth IEEE International Conference on Computer Vision (ICCV’05) Volume 1, (IEEE, 2005), pp. 1208-1213 Vol. 2.
Figures