2691
Dephasing the speaking brain: Cleaning covert sentence production activation maps with a phase-based fMRI data analysis1BCBL - Basque Center on Cognition, Brain and Language, Donostia-San Sebastian, Spain
Synopsis
Phase-based denoising methods in BOLD fMRI can remove signal contributions from large draining veins. Here, we investigate the performance of this methodology in a covert sentence production task, where part of the activations observed in the inferior frontal gyrus (e.g. Broca’s region) may reflect macrovascular effects from large perisylvian veins. We found significant signal denoising at the left pars orbitalis, a region in Broca’s area which is located next to the Sylvian fissure that thus contains macrovascular veins. Our results demonstrate that this method is efficient to remove undesired signal contributions and improve the spatial specificity of brain activation maps.
Introduction
The spatial resolution in conventional gradient-echo functional MRI (fMRI) experiments is largely confounded by blood-oxygenation level dependent (BOLD) signal changes emanating from large draining veins.1 These macrovascular effects limit precise localization of the neuronal activity, which fundamentally occurs at the level of smaller veins and capillaries. Previous studies have observed that the phase of the fMRI signal captures BOLD changes in voxels with large vessels but not in voxels located within the microvasculature.2 Thus, by performing a linear regression between the phase and magnitude BOLD signals, the signal contribution coming from large veins can be estimated, and subsequently removed from the original magnitude time-series. Here, we investigate the performance of this phase-based denoising method on a covert sentence production task, where part of the observed activations in Broca’s area may be biased towards macrovasculature contained in the Sylvian fissure.3 We analyze the performance of two fitting algorithms, ordinary least-squares (OLS) and orthogonal distance regression (ODR),2,4 by comparing the conventional magnitude-based activation maps against those obtained after suppressing the contributions from macrovascular veins.Methods
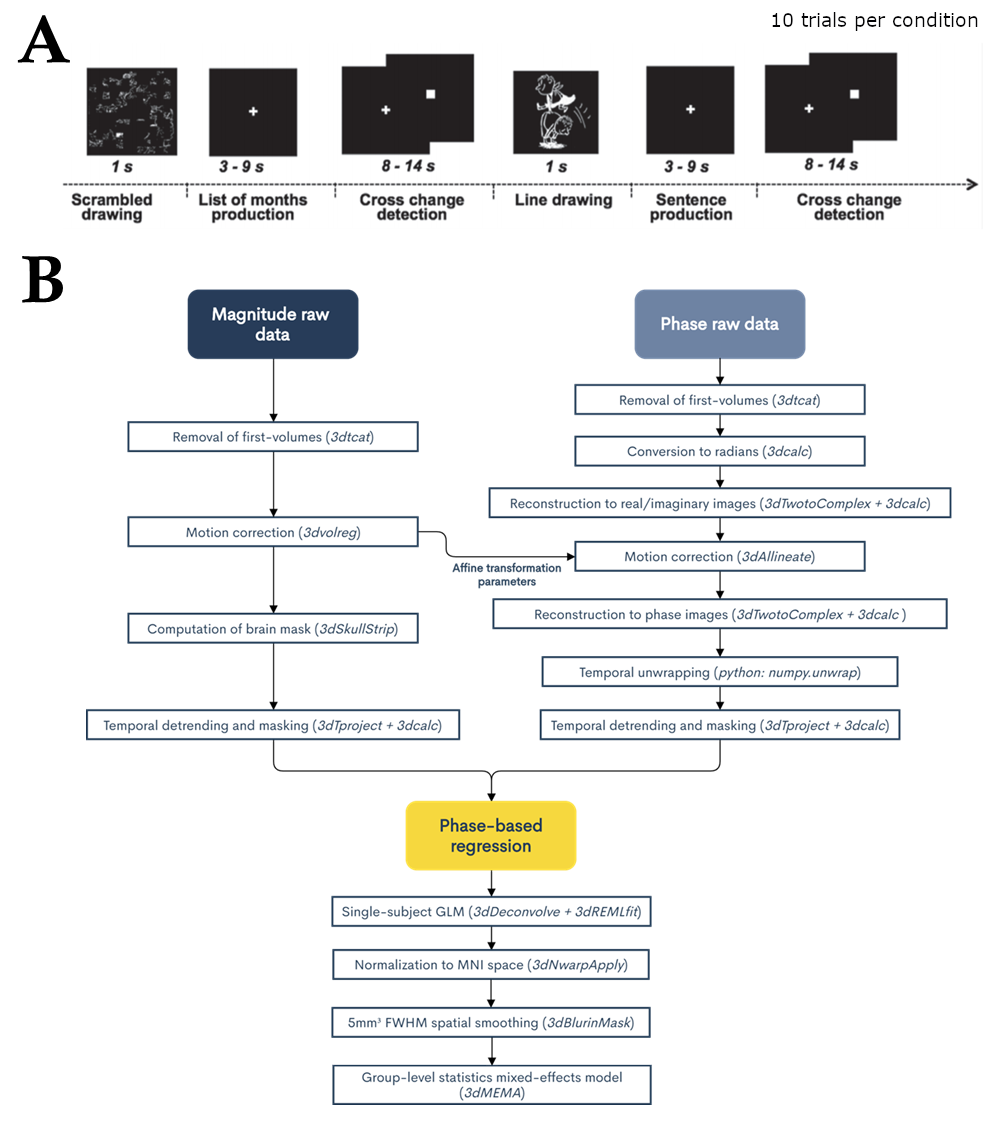
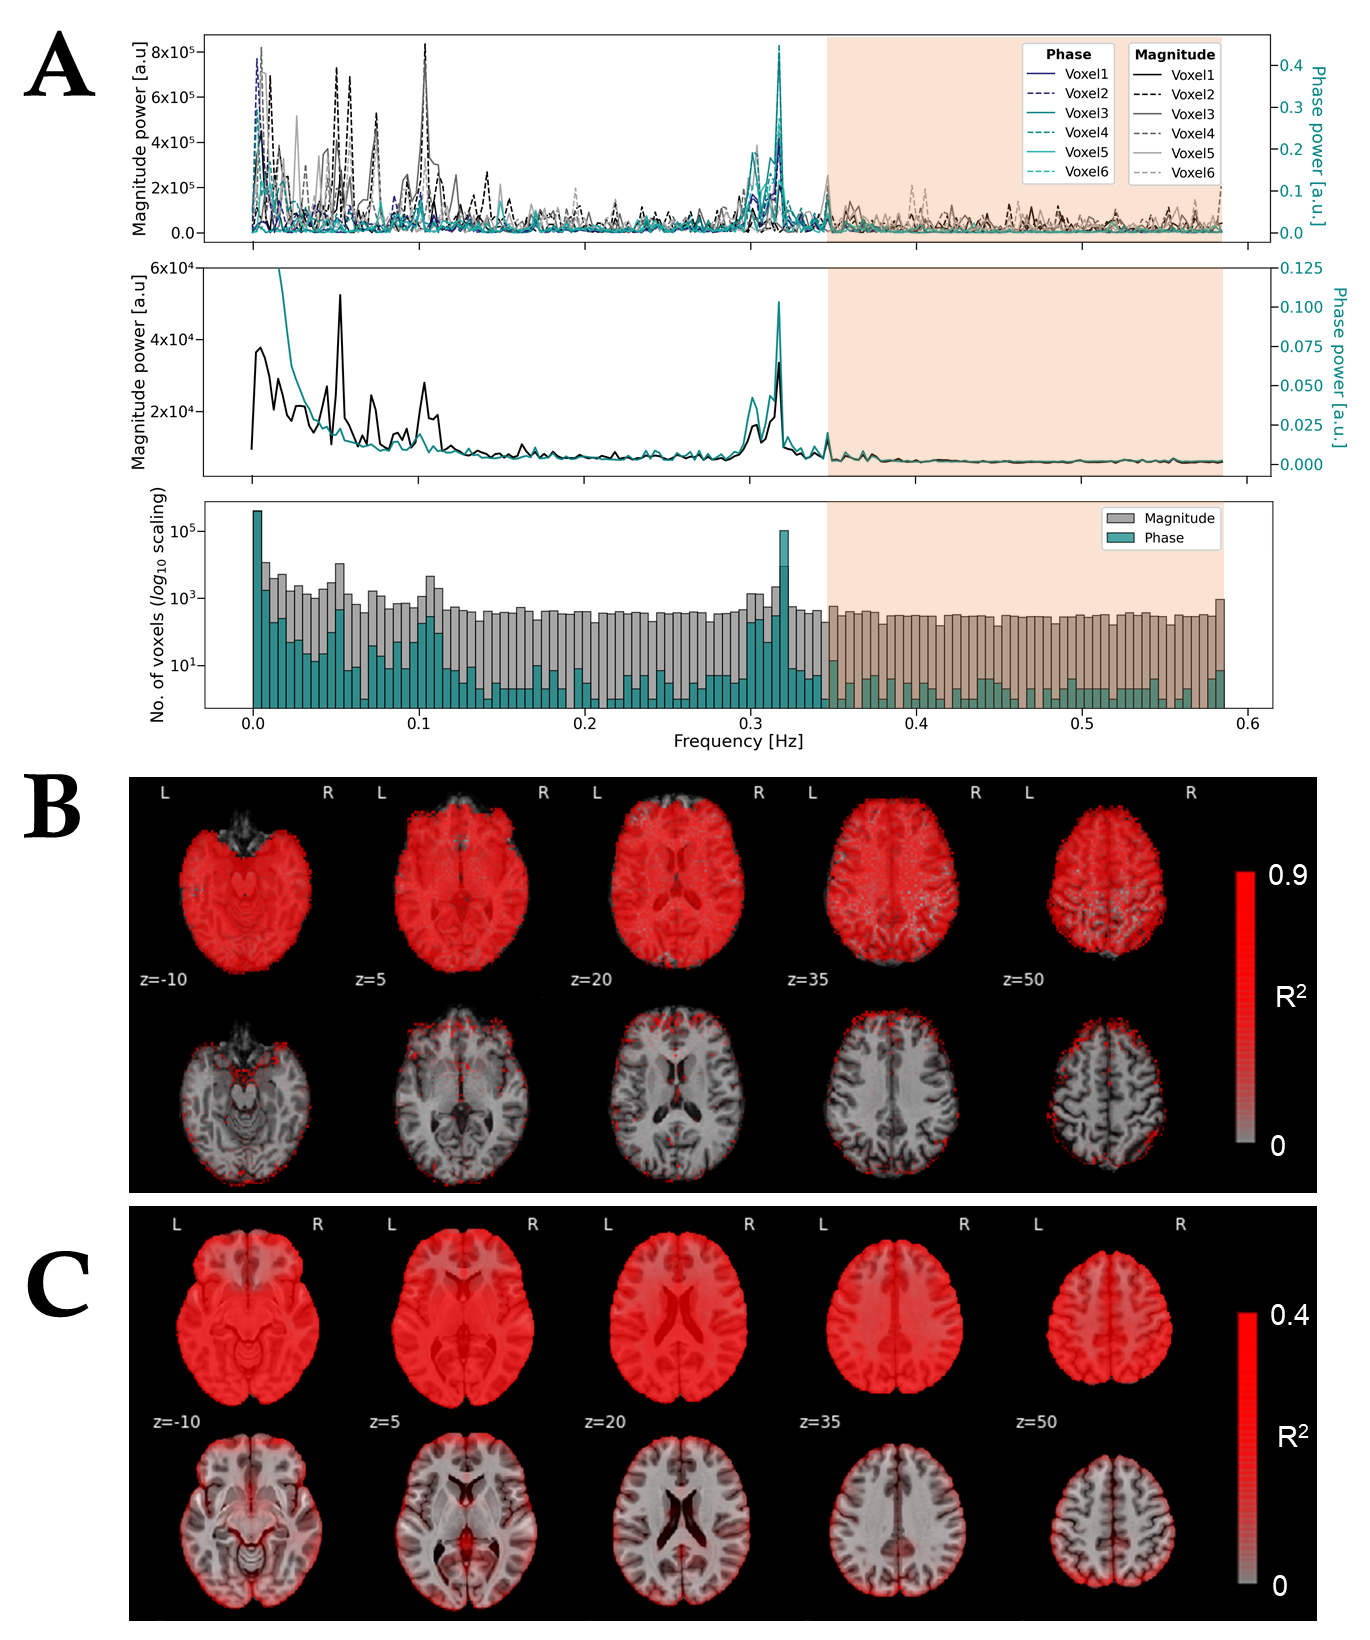
T2*-weighted multiband gradient-echo echo-planar images (TR = 850ms, TE = 35ms, flip angle = 56º, multiband acceleration factor = 6, voxel size = 2.4x2.4x2.4 mm3, matrix size = 88x88 mm2, 452 volumes) were collected in 23 subjects in a fMRI experiment while they performed a covert sentence production task in Spanish (Figure 1A).5 Anatomical images were acquired using a high-resolution T1-weighted MPRAGE sequence (TR = 2530 ms, TE = 2.36 ms, flip angle = 7º, GRAPPA factor = 2, FOV = 256x256 mm2, voxel size = 1x1x1 mm3) and a T2-weighted SPACE sequence (TR = 3390 ms, TE = 389 ms, flip angle = 120º, FOV = 256x232 mm2, voxel size = 1x1x1 mm3). All analyses were performed using AFNI and in-house python scripts.6 Preprocessing: Magnitude and phase fMRI signals were independently preprocessed prior to phase-based OLS or ODR denoising (Figure 1B). The ODR-denoising approach also required filtering of respiratory-related fluctuations, as it uses an estimation of the underlying noise to weight the fit between phase and magnitude signals. This was accomplished by automatically identifying the respiratory frequency peak of each subject, which then served as a high-pass cutoff frequency to filter the magnitude and phase signal prior to noise estimation (Figure 4). To source the origin of fluctuations, temporal standard deviation maps were also created from the preprocessed magnitude images (without phase denoising) after high-pass filtering above 0.25 Hz. Furthermore, we created a vein segmentation mask by thresholding a ratio of the T1- and T2-weighted anatomical images.7 GLM analyses: Subject-level analyses were based on a general linear regression model which included the task-evoked BOLD regressors related to the sentence production paradigm, up to 3rd order Legendre polynomials and motion-derived regressors to account for low-frequency trends and motion, respectively. Statistical parametric maps were computed at the individual subject’s space with 3dREMLfit to account for voxelwise temporal correlations. Separate GLM analyses were performed on the RAW preprocessed magnitude (i.e. without any phase-based denoising), and after the two phase-denoised methods (OLS-denoised and ODR-denoised). Group-level statistics comparing the different preprocessing strategies (RAW, OLS, ODR) were obtained with a mixed effects model using 3dMEMA.8 All the scripts used in this work are available in GitHub: https://github.com/idevicente/Phase-based_denoising_pipeline.Results and Discussion
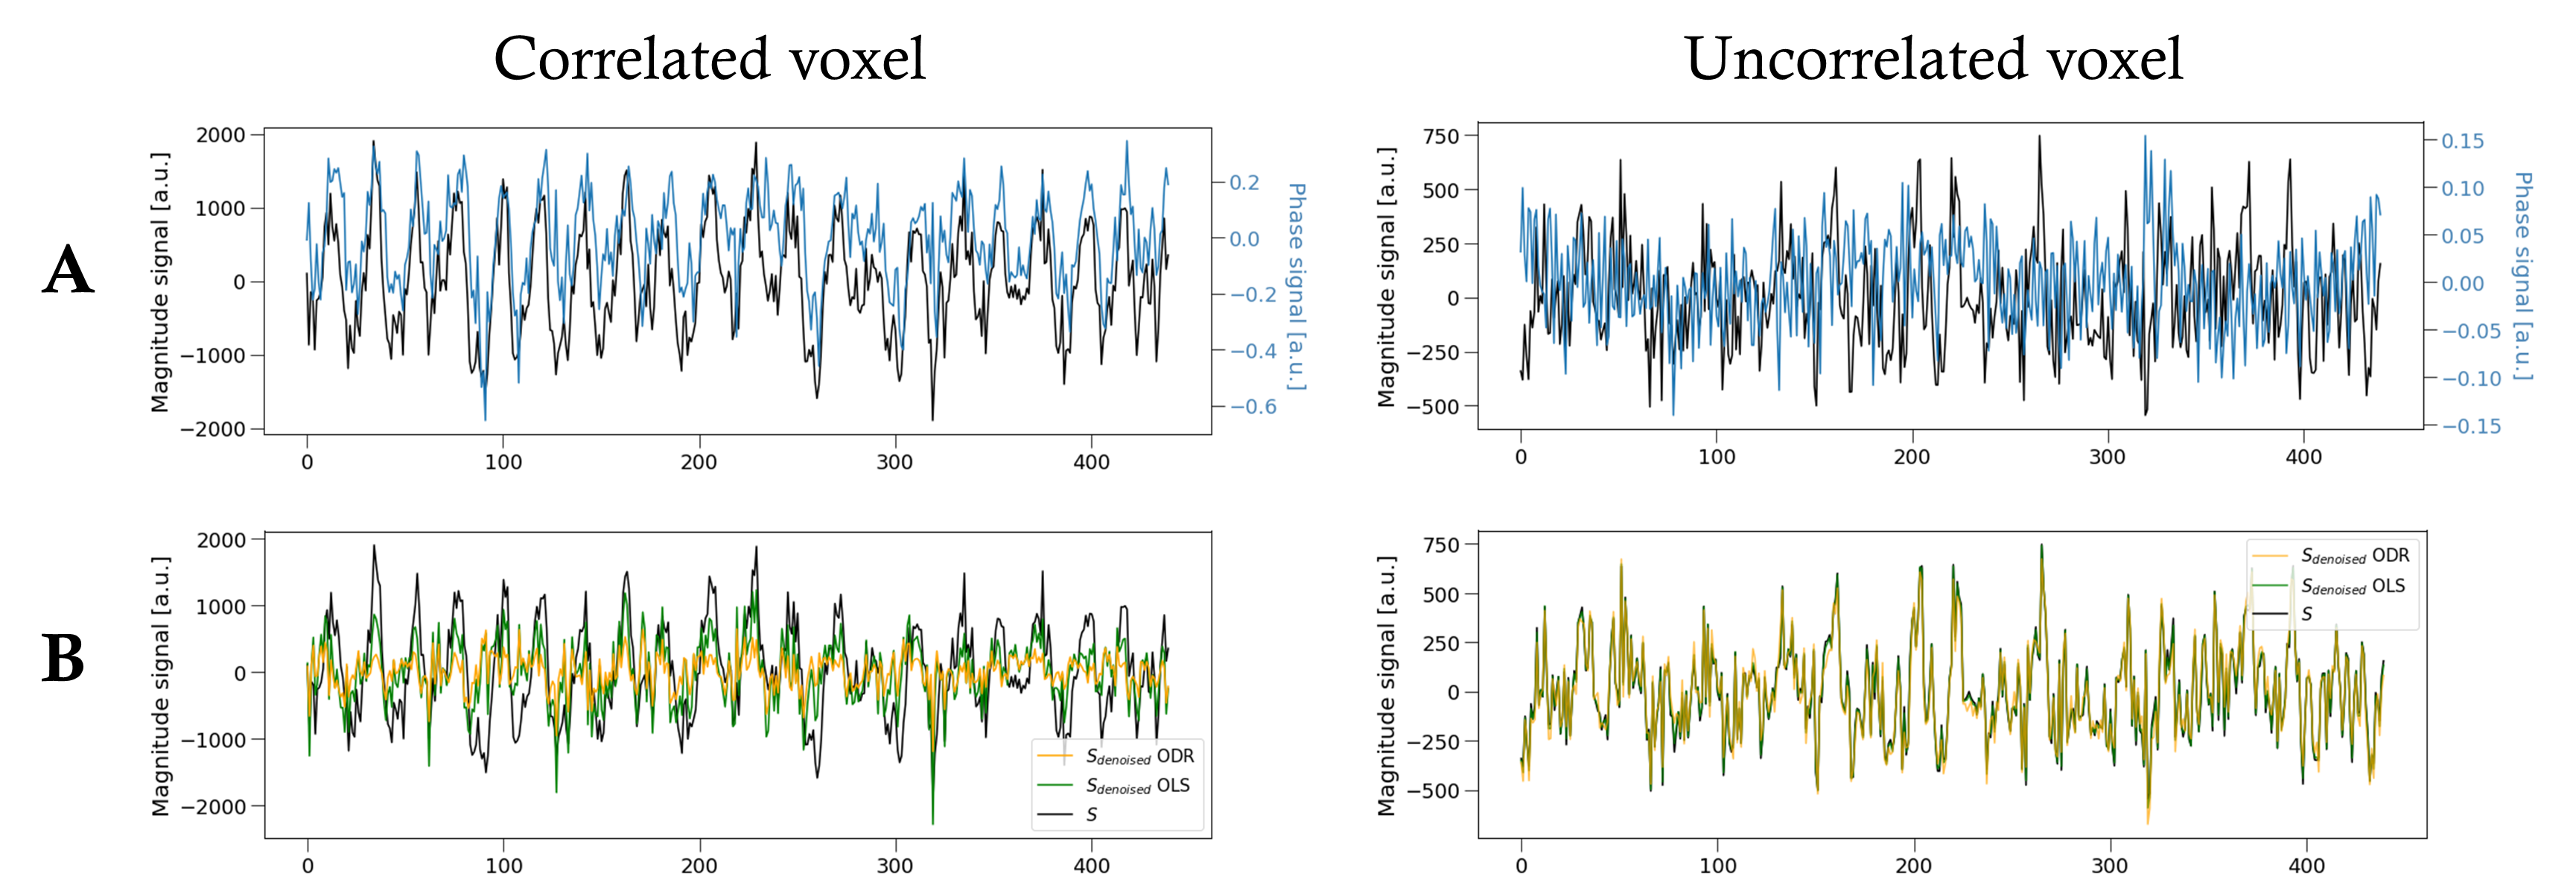
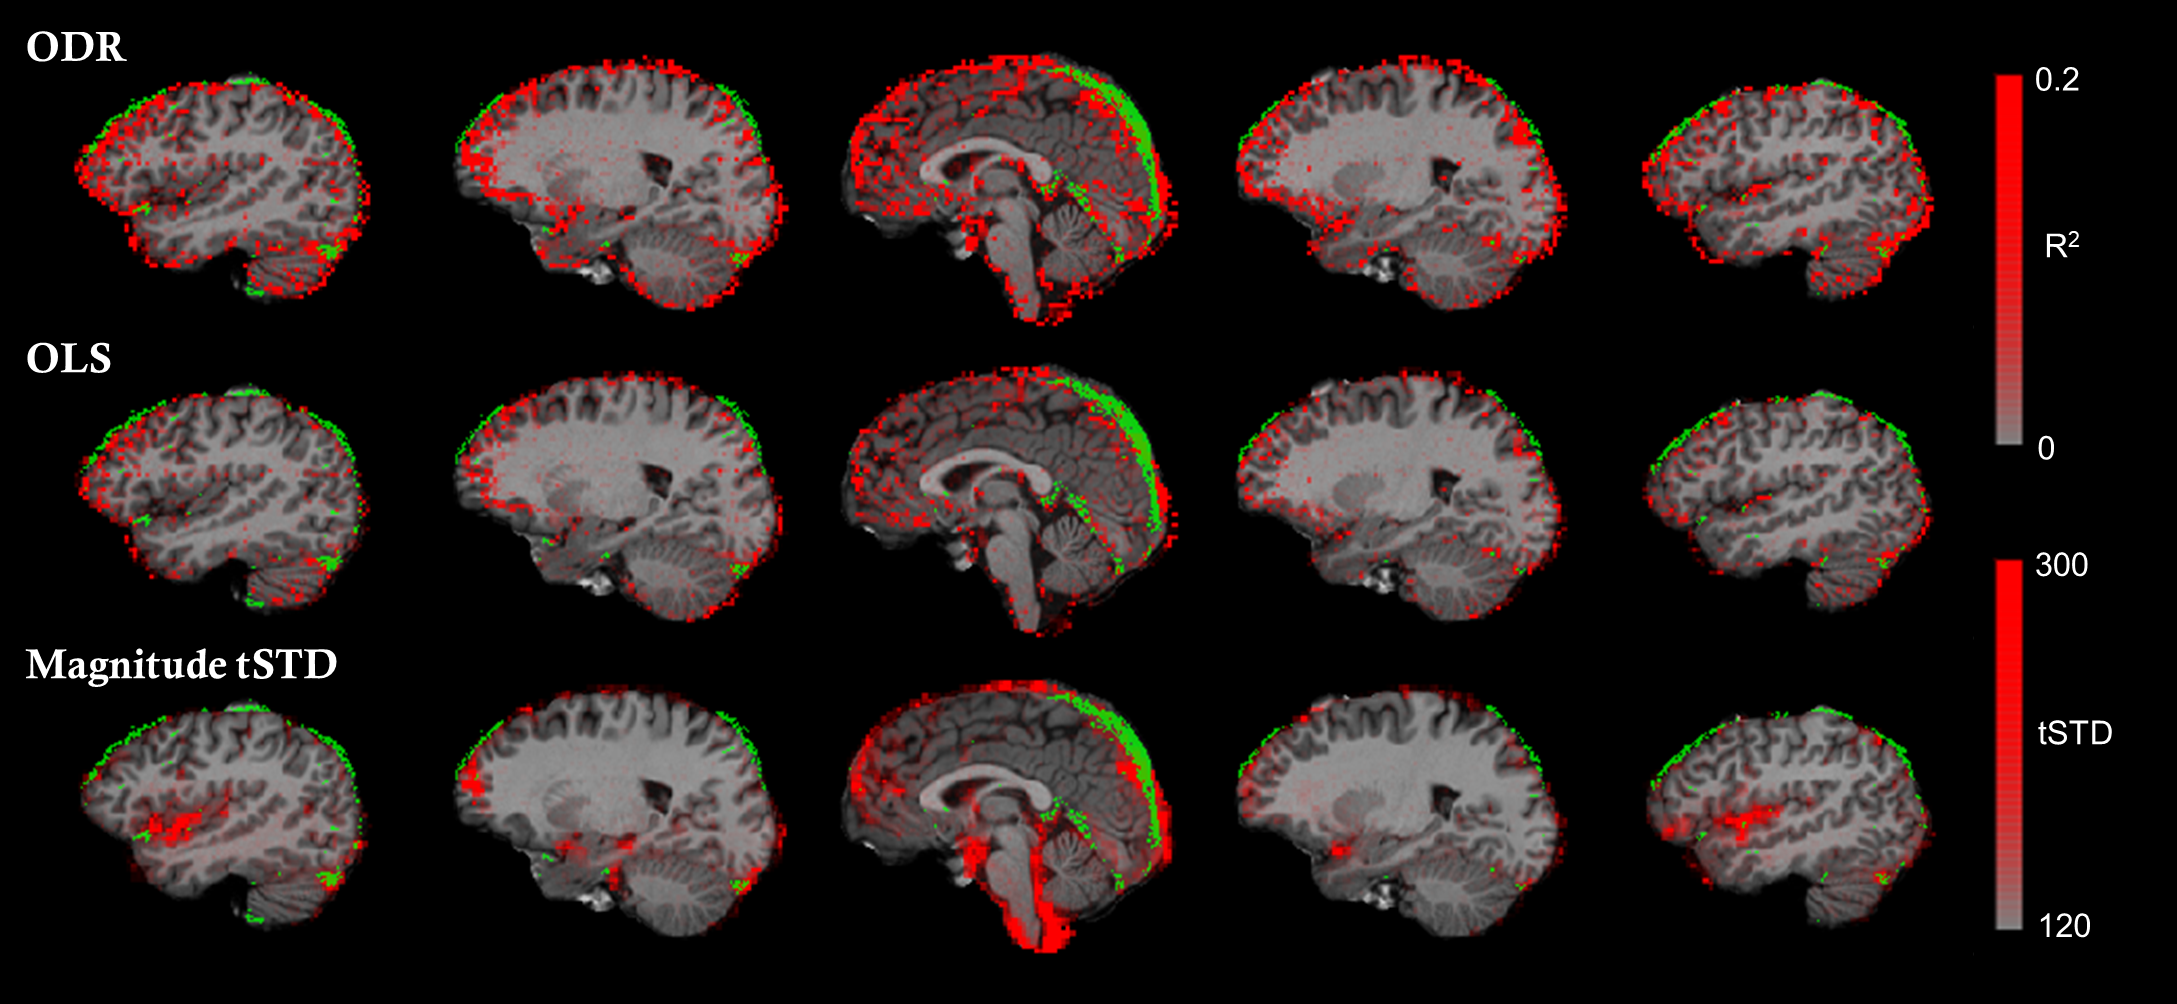
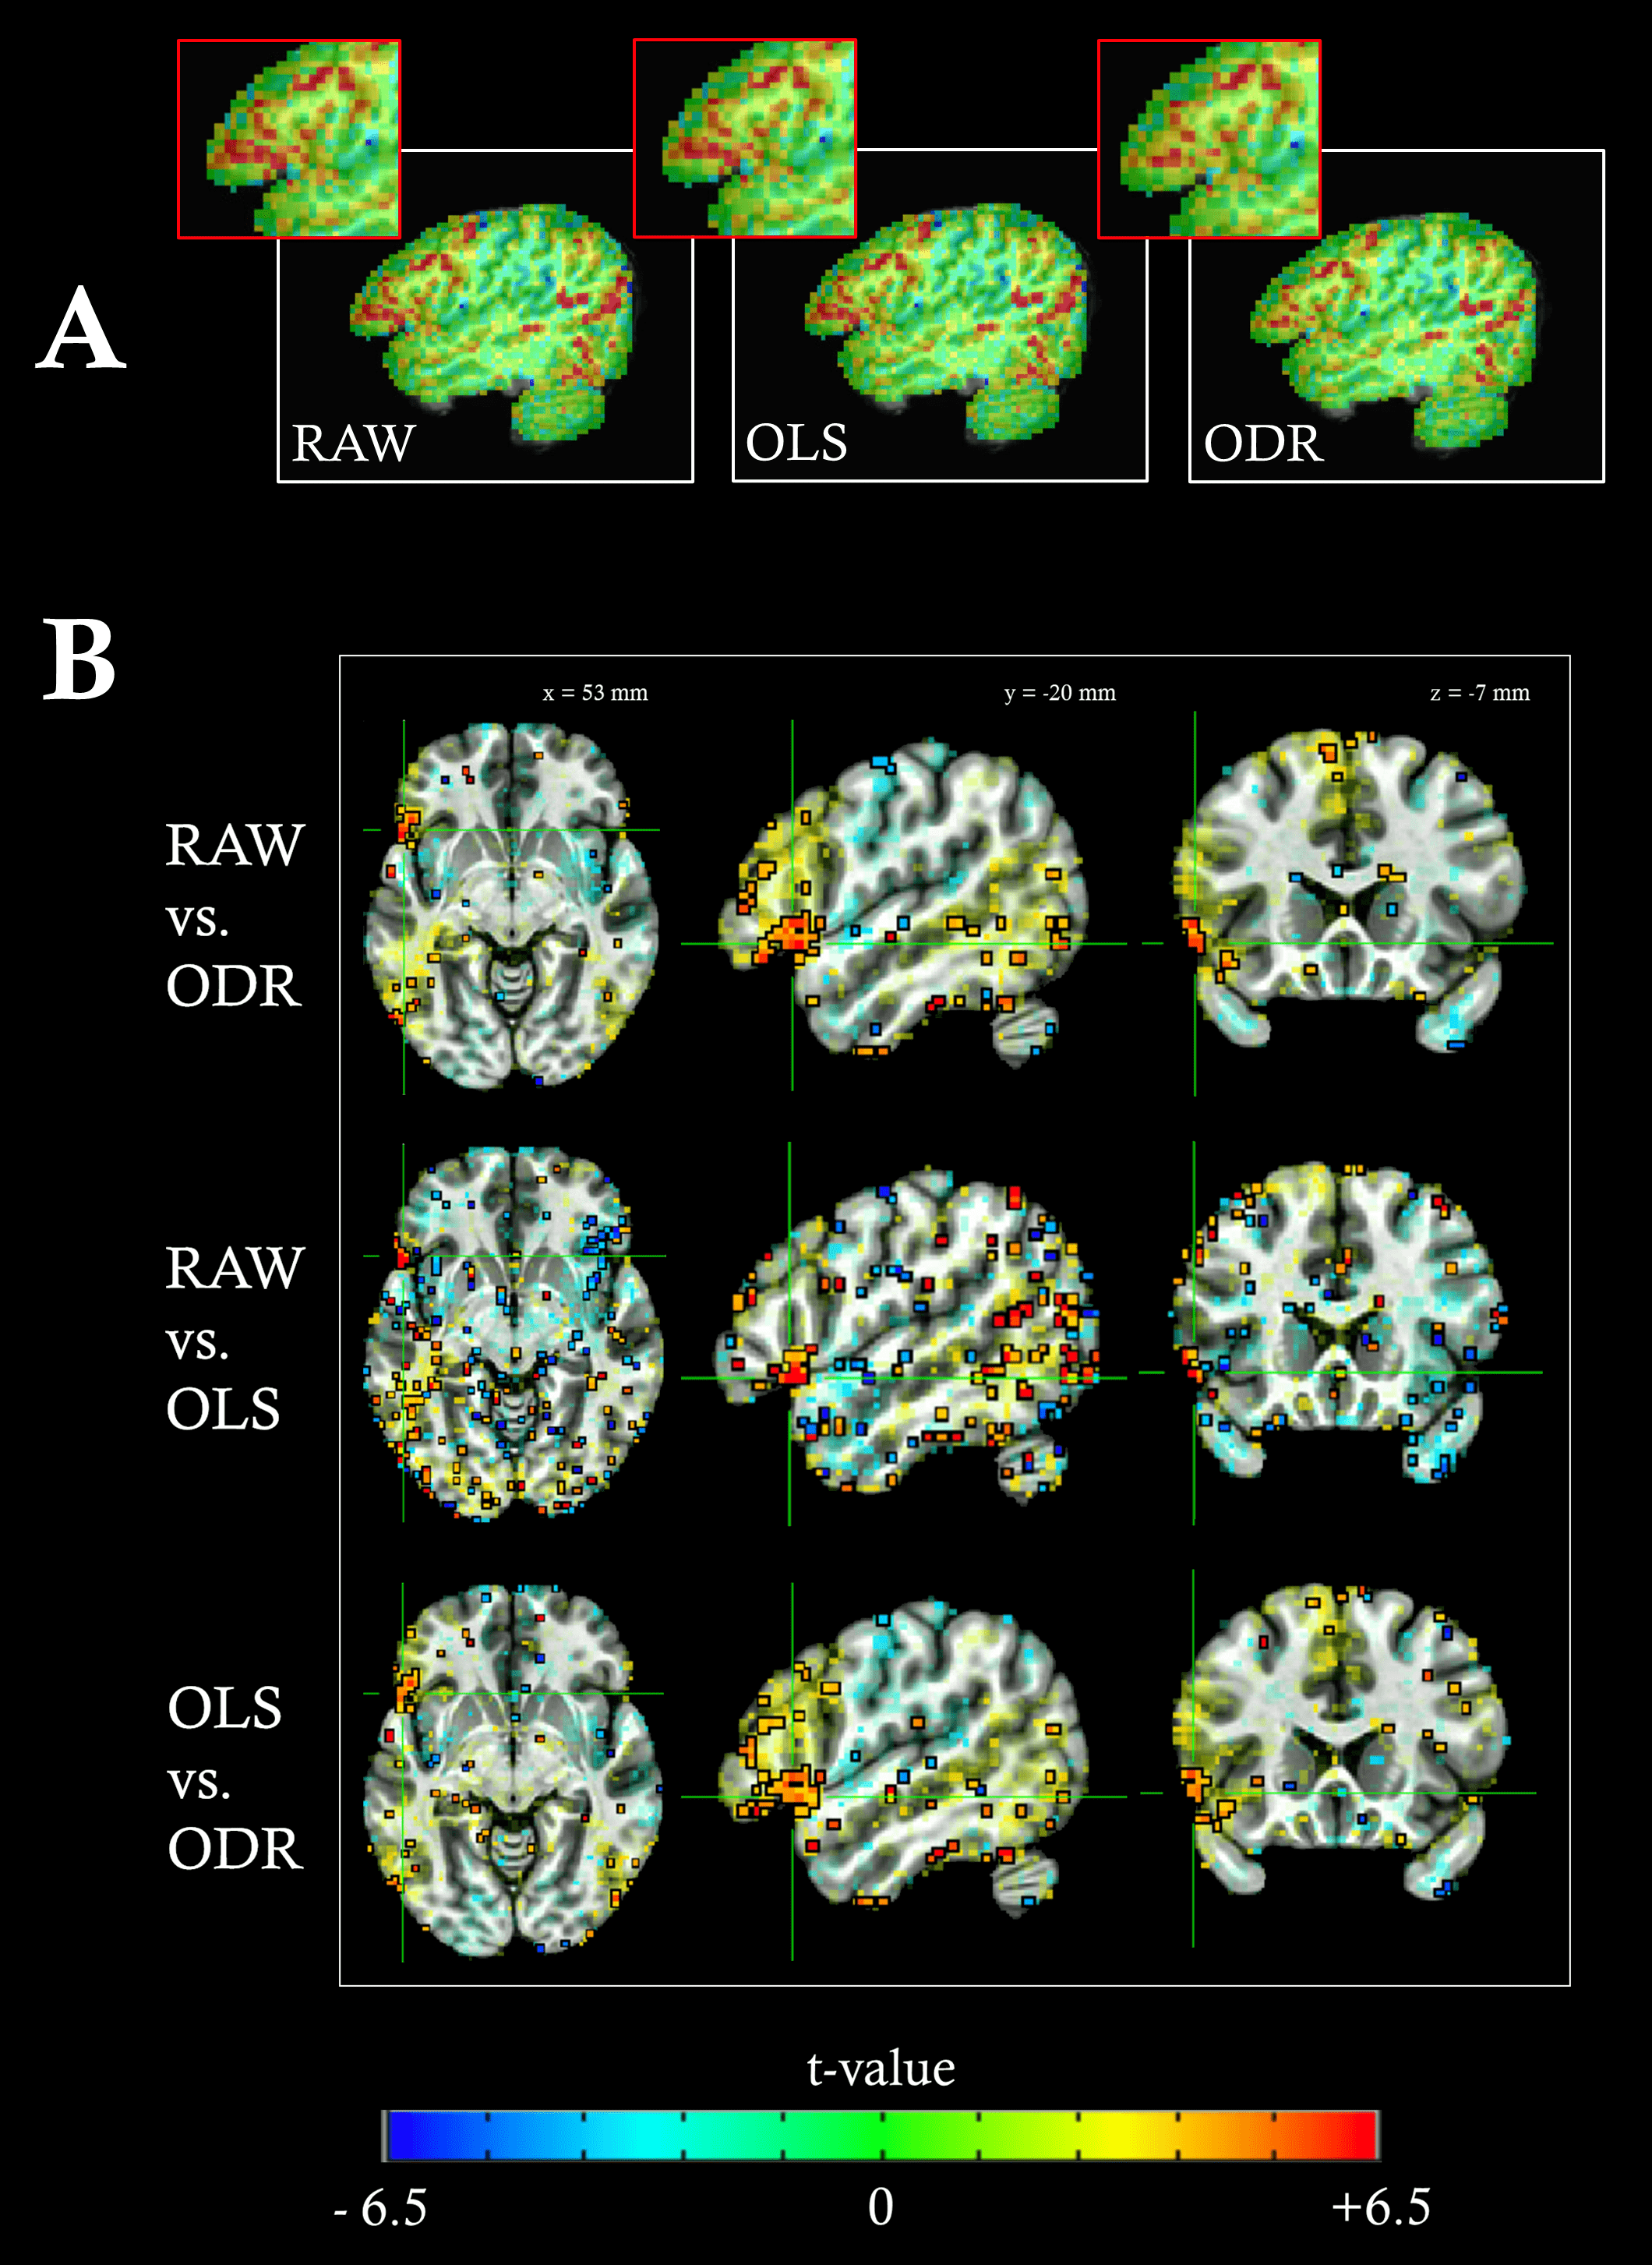
Figure 2A displays two representative voxels with phase and magnitude time-series that are correlated (left), showing a macrovascular effect, and uncorrelated (right). Figure 2B demonstrates the performance of both OLS and ODR fitting methods, where macrovascular effects are denoised in the correlated voxel and the magnitude signal remains intact in the uncorrelated voxel. Both OLS and ODR algorithms estimated phase-magnitude correlations in similar regions, showing low coefficient of determination (R2) values in white-matter voxels with reduced vasculature, and large R2 values close to large veins, such as the superior sagittal sinus (Figure 3). The R2 maps matched the high-pass filtered temporal standard deviation maps of the magnitude signal, which generally reflect physiological noise of large vessels. The segmented veins from the T1w/T2w ratio images also matched the patterns of denoising (green voxels in Figure 3). ODR outperformed OLS in terms of estimation accuracy, thus resulting in more effective removal of large draining effects. This was only true when respiration sources were not taken into account during the noise estimation process. Figure 4 shows the relevance and effectiveness of our data-driven removal of respiratory components in the ODR approach. When comparing standard activation maps against those obtained after phase-based denoising, we found significant signal suppression in individual subjects and at the group-level (Figure 5). As hypothesized, larger effects of macrovascular contributions were observed in areas of the inferior frontal gyrus, particularly in the left pars orbitalis which is located adjacent to the Sylvian fissure and thus contains large macrovascular signals.Conclusion
Our results demonstrate that covert sentence production studies with BOLD fMRI can be biased towards macrovascular sources contained in the pars orbitalis. We show that phase-based denoising methods have the potential to improve the accuracy of standard fMRI activation maps. Future work will address the relevance of this method to improve the accuracy of functional mapping with fMRI in speech-related disorders, particularly those involving considerable macrovascular damage.Acknowledgements
This work was supported by the Spanish Ministry of Economy and Competitiveness (Ramon y Cajal Fellowship, RYC-2017- 21845), the Basque Government (BERC 2018-2021, PIBA_2019_104 and PRE_2019_1_0054) and the Spanish Ministry of Science, Innovation and Universities (MICINN; PID2019-105520GB-100).References
1. Hoogenraad, F. G., Hofman, M. B., Pouwels, P. J., Reichenbach, J. R., Rombouts, S. A., & Haacke, E. M. (1999). Sub‐millimeter fMRI at 1.5 Tesla: correlation of high resolution with low resolution measurements. Journal of Magnetic Resonance Imaging: An Official Journal of the International Society for Magnetic Resonance in Medicine, 9(3), 475-482.
2. Menon, R. S. (2002). Postacquisition suppression of large‐vessel BOLD signals in high‐resolution fMRI. Magnetic Resonance in Medicine: An Official Journal of the International Society for Magnetic Resonance in Medicine, 47(1), 1-9.
3. Delion, M., Mercier, P., & Brassier, G. (2016). Arteries and veins of the sylvian fissure and insula: microsurgical anatomy. In Advances and technical standards in neurosurgery (pp. 185-216). Springer, Cham.
4. Curtis, A. T., Hutchison, R. M., & Menon, R. S. (2014). Phase based venous suppression in resting-state BOLD GE-fMRI. Neuroimage, 100, 51-59.
5. Mazoyer, B., Zago, L., Jobard, G., Crivello, F., Joliot, M., Perchey, G., ... & Tzourio-Mazoyer, N. (2014). Gaussian mixture modeling of hemispheric lateralization for language in a large sample of healthy individuals balanced for handedness. PloS one, 9(6), e101165.
6. Cox, R. W. (1996). AFNI: software for analysis and visualization of functional magnetic resonance neuroimages. Computers and Biomedical research, 29(3), 162-173.
7. Colenbier, N., Van de Steen, F., Uddin, L. Q., Poldrack, R. A., Calhoun, V. D., & Marinazzo, D. (2020). Disambiguating the role of blood flow and global signal with Partial Information Decomposition. NeuroImage, 116699.
8. Chen, G., Saad, Z. S., Nath, A. R., Beauchamp, M. S., & Cox, R. W. (2012). FMRI group analysis combining effect estimates and their variances. Neuroimage, 60(1), 747-765.
Figures