2690
Spectrally Segmented Regression of Physiological Noise and Motion in High-Bandwidth Resting-State fMRI1Nuclear Engineering, U New Mexico, Albuquerque, NM, United States, 2Neurology, U New Mexico, Albuquerque, NM, United States, 3Physics and Astronomy, U New Mexico, Albuquerque, NM, United States
Synopsis
It has been demonstrated in prior works that whole-band linear nuisance regression can result in the introduction of artifactual connectivity in the high frequency regime in resting-state fMRI. In the present work, an alternative approach is proposed to whole-band linear nuisance regression relying on spectral and temporal segmentation of the motion parameters and the physiological noise signals. The new approach is shown to not only avoid the injection of artifactual connectivity, but it also substantially improves the removal of physiological noise and motion effects throughout the whole frequency spectrum when uncertainties are present in the regression vectors.
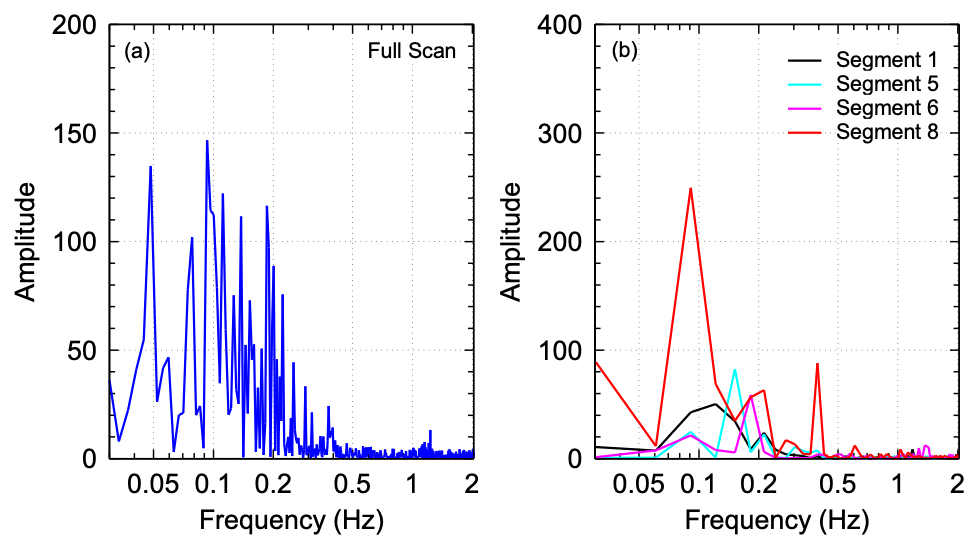
The advantages of using short repetition times (TRs) in fMRI scans are numerous including non-aliased representation of physiological noise. Concerns have been raised on the use of conventional regression techniques in the preprocessing of rapidly sampled fMRI data1,2. In particular, it was demonstrated that the use of whole-band linear regression in motion correction can result in the introduction of artifactual high frequency connectivity above those predicted from the canonical model which sets an upper limit at 0.3 Hz1. Alternate methods such as conventional FIR filtering suffer from extensive data losses as large portions of the spectra are contaminated with respiration, cardiac pulsation, and their harmonics. The present work demonstrates a new technique that both reduces data losses and improves the suppression of physiological noise and motion in resting-state fMRI. The technique exploits the fact that physiological noise tends to have narrower spectral bands over shorter time periods due to the decreased variability as shown in Figure 1.
METHODS
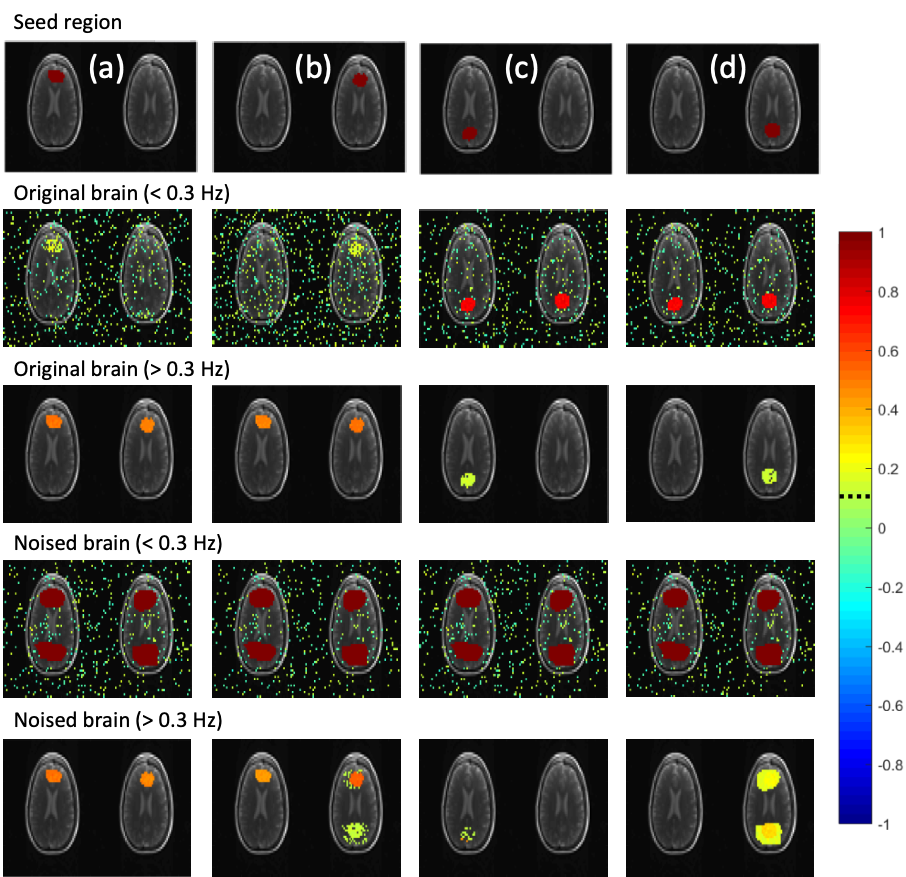
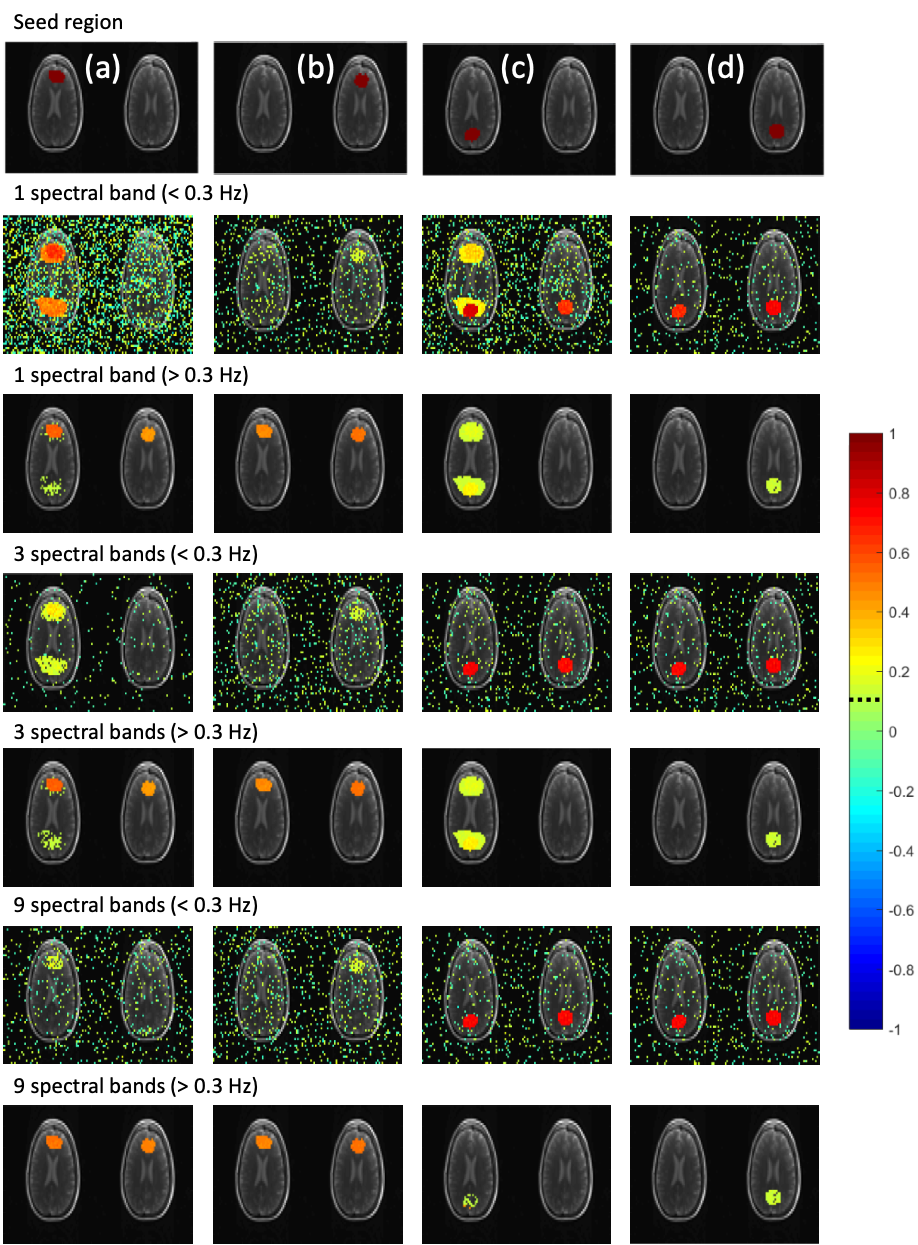
A two-step regression process is implemented. In the first step, regression vectors are constructed from motion parameters measured experimentally during the scan. Each motion parameter is filtered into k number of segments in the spectral domain to obtain a vector for each spectral band. A non-causal filter is used to filter the motion parameters by applying FFT to the motion parameter time course then using inverse FFT to obtain the segment of interest. Temporally segmented regression of the filtered motion parameters is then applied to obtain motion-corrected data. In the second step, the motion-corrected data is divided into temporal segments and physiological noise in each segment is labeled in the frequency domain. A spatial mask of the labeled feature is used to obtain a spatially averaged signal to construct a representative regression vector. The mask is based on a power-spectral integral threshold relative to a labeled non-physiological noise frequency range and represents regions where labeled physiological noise features are present with significant power. The average signal within the mask is pass-band filtered in the frequency range of the labeled feature to construct a regression vector for the feature within the segment. The constructed regression vectors are phase shifted individually for each slice such to minimize the power spectral integral in the frequency range of the feature in the corrected signal across the entire slice. Iterative minimization is used to search for optimal phase shifts, constrained to an arbitrary range. Regression of physiological noise involves generation of a set of regression vectors, $$$\overrightarrow{S}$$$, segmentation of the data and regression vectors in time into n segments, calculation of regression coefficients, and subtraction of the regression series from the original signal $$$\overrightarrow{x}^j$$$ to obtain the corrected signal, $$$\overrightarrow{x}_s^j$$$. $$\overrightarrow{x}_s^j=\overrightarrow{x}^j-\sum_{i=1}^{L^j}\overrightarrow{\gamma}_i^j\overrightarrow{S}_i^j (Eq. 1)$$ where j is the segment index, $$$\overrightarrow{\gamma}_i^j$$$ are calculated weighting coefficients, and $$$L^j$$$ is the number of regression vectors within segment j. The corrected signal in a voxel is the concatenation of $$$\overrightarrow{x}_s^j$$$ in time: $$\overrightarrow{x}_s^j=[\overrightarrow{x}_s^{j=1},\overrightarrow{x}_s^{j=2},..,\overrightarrow{x}_s^{j=n}] (Eq. 2)$$ The coefficients of regression can be obtained by minimizing the quadratic form $$$|\overrightarrow{x}^j-S^j\overrightarrow{\gamma}^j|^2$$$ described in3, resulting in: $$({S^j}^TS^j)\overrightarrow{\gamma}_i^j = {S^j}^T\overrightarrow{x}^j (Eq. 3)$$ Simulations using a 2-slice Rician brain model with 0.205s TR and 3000 time points are shown in Figure 2. Two seeds defined in anterior brain regions are correlated at > 0.3 Hz while two seeds defined in posterior brain regions are correlated at < 0.3 Hz. Three translation parameters from an in-vivo scan are injected into seed regions on the right slice. The same parameters are low-pass filtered < 0.3 Hz and injected into the seeds on the left slice. The unfiltered translation parameters are used in the construction of regression vectors.
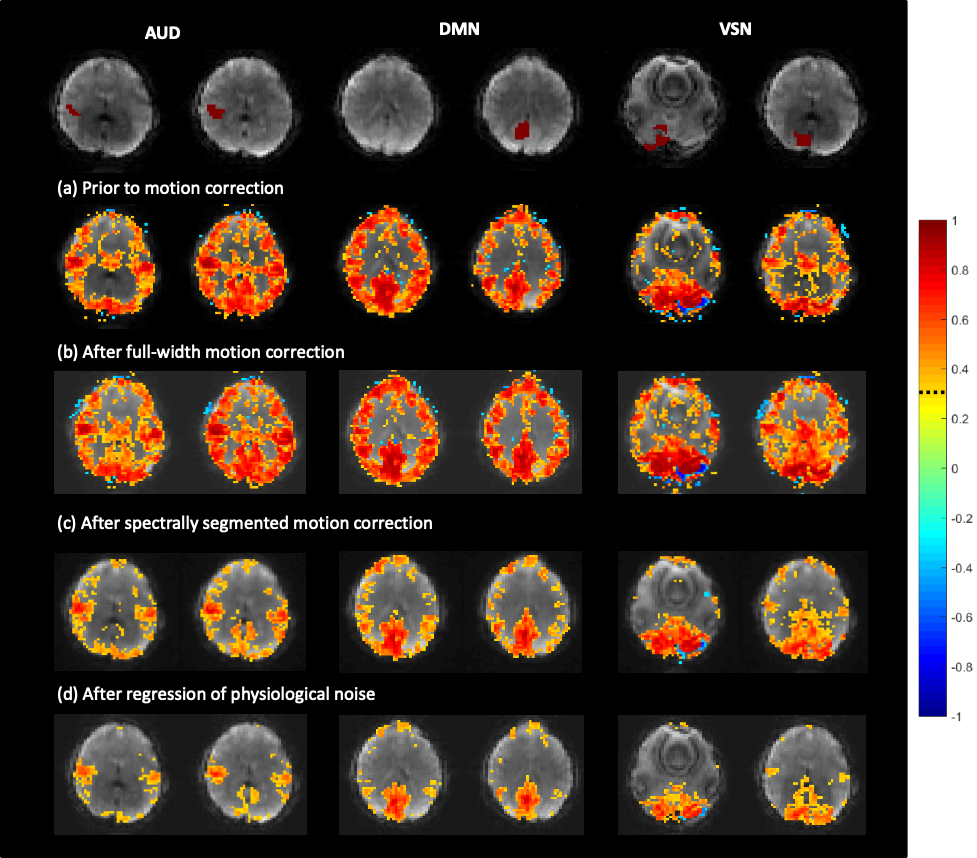
RESULTS AND DISCUSSION
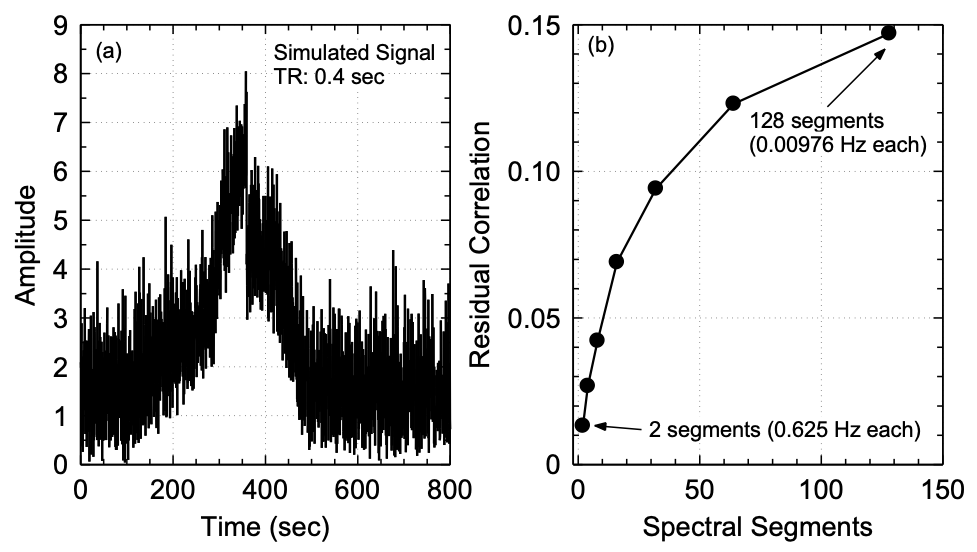
While conventional whole-band regression performs well when the nuisance parameters are accurately estimated (Figure 3), uncertainties in the regression vectors result in poor performance of the conventional approach and introduction of artifactual connectivity compared to the original model as shown in left slice seeds. As the number of equidistant spectral bands used in regression is increased such that the band of interest (> 0.3 Hz) is independent of lower frequency bands, artifactual high frequency connectivity disappears. The effectiveness of regression in the low frequency bands substantially improves with increasing number of spectral segments as vectors from different spectral bands are given different weights during regression which mitigates uncertainties in regression vector at higher frequencies. Self-regression tests (Figure 4) demonstrate that spectrally segmented regression results in little residual correlations (< 0.1) between the original signal and the regressed signal when a reasonable number of spectral bands are used. The approach was then applied to an in-vivo resting-state fMRI scan at 3T with 0.246s TR (Figure 5) and is demonstrated to significantly improve correction of motion-related signal changes compared to whole-range, whole-band regression.
CONCLUSIONS
A novel approach for the suppression of motion and physiological noise in high bandwidth resting-state fMRI is proposed. The approach, consistent with the recommendations in2, results in improved suppression of noise and avoids the introduction of spurious components into higher frequencies when sufficient number of spectral bands of the regression vectors is used.
Acknowledgements
Supported by 1R21EB022803-01. We gratefully acknowledge Essa Yacoub, Sudhir Ramanna and Steen Moeller for their contributions to the development of multi-slab and multi-band echo-volumar imaging.References
1. J. E. Chen, H. Jahanian, and G. H. Glover, "Nuisance Regreession of High-Frequency Functional Magnetic Resonance Imaging Data: Denoising Can Be Noisy," Brain Connectivity, vol. 7, 2017.
2. J. E. Chen, J. R. Polimeni, S. Bollmann, and G. H. Glover, "On the analysis of rapidly sampled fMRI data," Neuroimage, vol. 188, 2019.
3. Gembris, D., Taylor, G. J., Schor, S., Frings, W., Suter, D., and Posse, S., “Functional Magnetic Resonance Imaging in Real Time (FIRE): Sliding-Window Correlation Analysis and Reference-Vector Optimization,” Mag. Reson. Med. 43:259-268, 2000.
Figures