2686
Smoothing-matched k-space coverage for enhanced BOLD fMRI1Department of Biomedical Engineering, The University of Melbourne, Parkville, Australia, 2Melbourne Brain Centre Imaging Unit, The University of Melbourne, Parkville, Australia
Synopsis
Spatial smoothing is commonly applied as a pre-processing step in fMRI activation analysis pipelines. We investigate smoothing-matched k-space coverage for multiband EPI, with a particular focus on how varying the sampling speed in a reduced k-space will affect image SNR and resultant activation maps. A block task finger-tapping experiment demonstrates improved SNR from smoothing-matched k-space coverage, and improvements in activation level and specificity in the activation map. Our results demonstrate that dense sampling around the central echo time in multiband EPI produces superior results.
Introduction
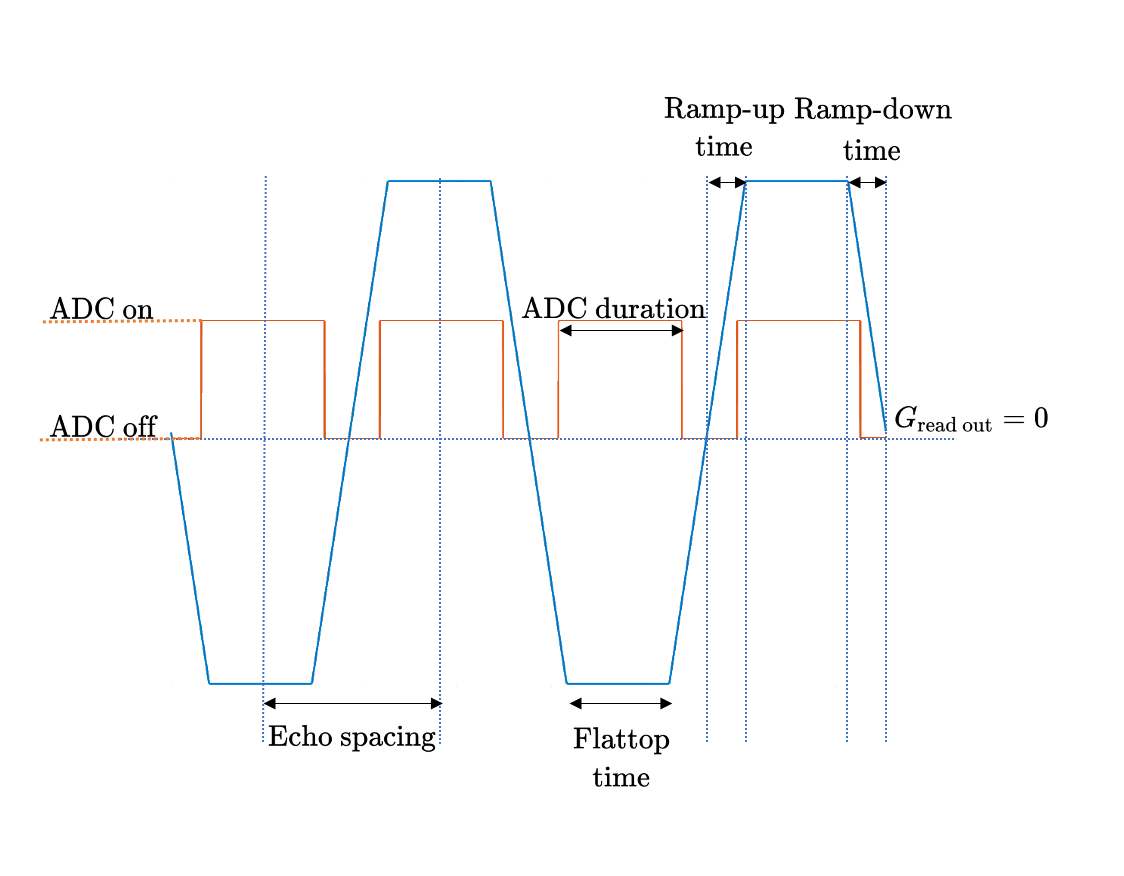
Spatial smoothing is a near ubiquitous pre-processing step in fMRI data analysis1, with spatial smoothing kernels chosen to match the spatial extent of the hemodynamic response and thickness of the human cerebral cortex2. Spatial smoothing also prepares the validity of data for parametric tests based on random field theory3. It is well understood that Gaussian smoothing in image space has an equivalent Gaussian representation in the k-space domain, and therefore the preprocessing spatial smoothing step in fMRI analyses can equivalently be performed in the data acquisition stage as k-space smoothing. Methods proposed for k-space smoothing have included density-weighted sampling4,5, which demonstrated optimized image SNR by matched k-space filtering. As smoothing reduces high-frequency content, we posed a simple question: could a reduced multiband EPI k-space acquisition, that samples only the spatial frequencies that remain post-smoothing (“smoothing-matched k-space acquisition”), lead to improved BOLD fMRI activation maps? We investigated the flexibility afforded by a reduced k-space matrix size, including readout bandwidth (BW) and echo spacing (Fig.1). Our hypothesis was that denser the sampling around the echo time would lead to better SNR statistics and improved the BOLD activation maps due to reduced dephasing closer to the central echo.Methods
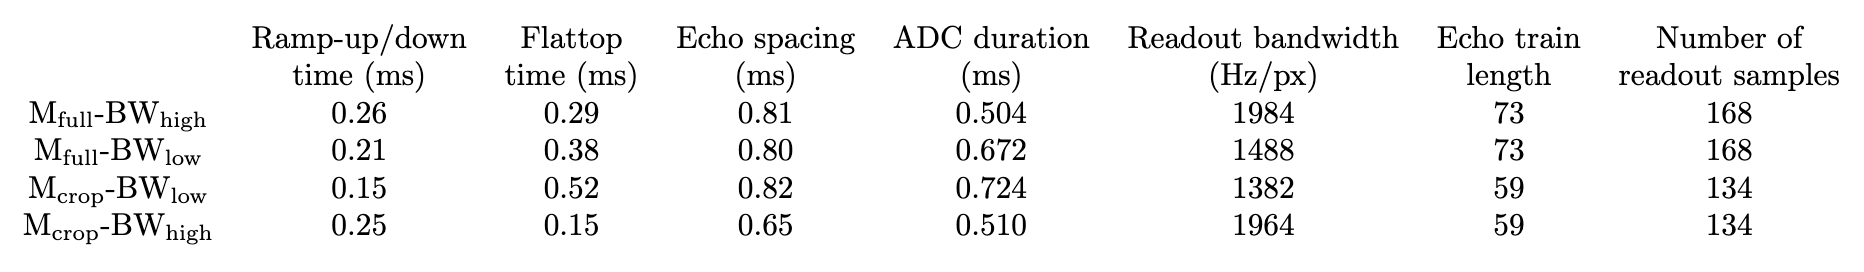
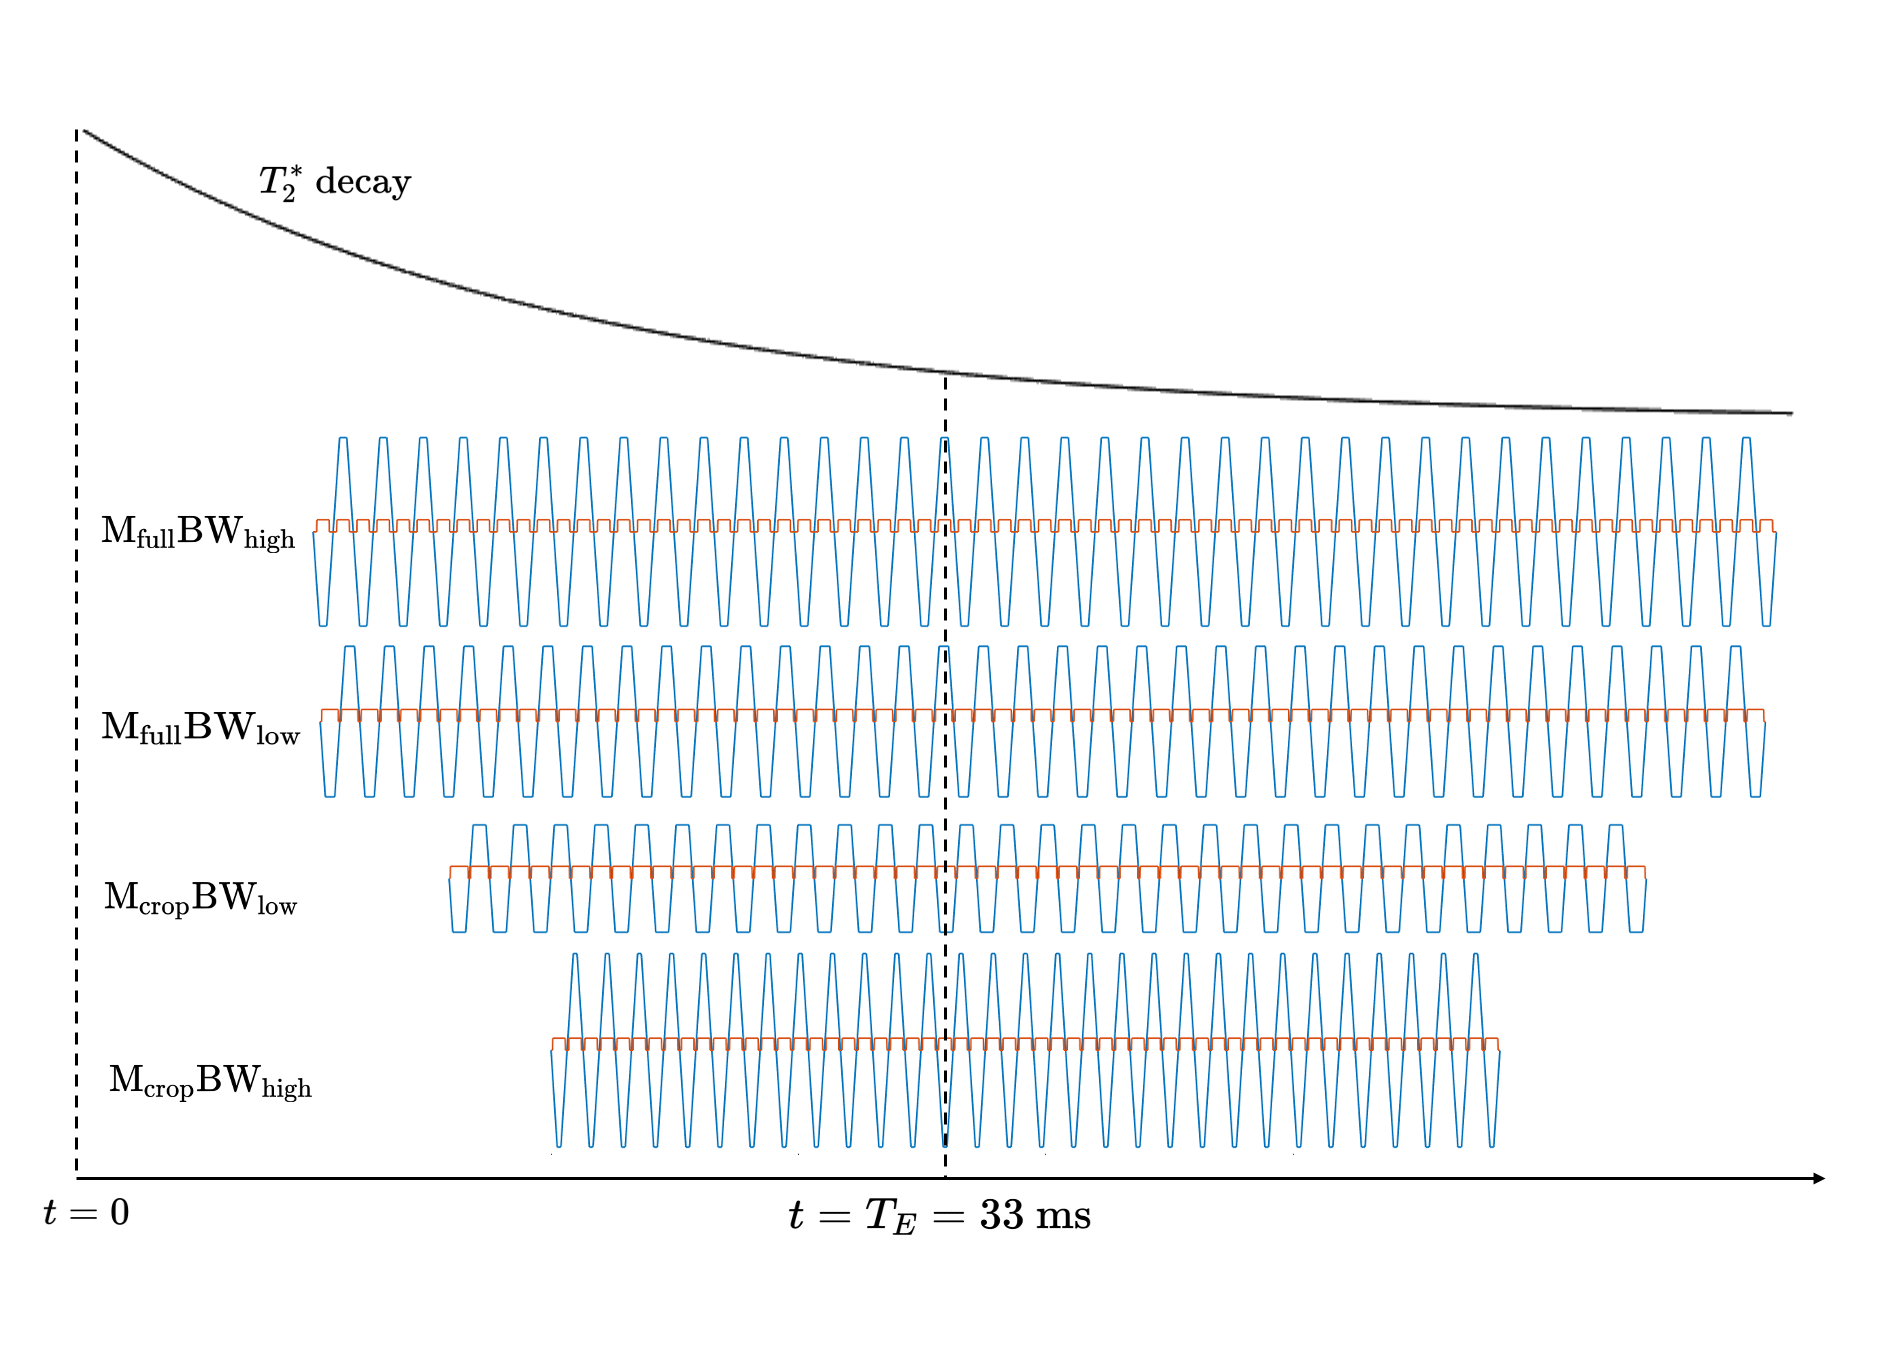
Experimental design and image acquisition: Eight right-handed, healthy volunteers (4F, age 28.1±6.1 years) were recruited with written consent obtained before scans and approval from the University of Melbourne Ethics Committee. Scans were performed on a 7T research scanner (Siemens Healthcare, Germany) using a 32-channel head-coil (Nova Medical Inc., USA). T1-w images were acquired for registration using MP2RAGE, resolution of 1.4 mm3.Using a constant TE, four multiband EPI timing cases were compared (Fig.1): 1) full matrix, high BW (reference); 2) full matrix, low BW; 3) cropped matrix, low BW; 4) cropped matrix, high BW. The four paradigms were tested by a finger-tapping experiment in which participants tapped their right-hand fingers in 25.5s rest/task blocks for 3.4 minutes. BOLD images were acquired using 2D multiband GE-EPI6,7 (GRAPPA factor=2, partial Fourier= $$$\frac{7}{8}$$$, multiband factor=6, A-to-P direction, TE=33ms, TR=1700ms, FOV=2082mm2, 120 slices, FA=65°). Full matrix=168x168, cropped matrix=134x134 with zero-padding to 168x168. High and low BWs were tested with both matrix sizes (Fig.1). The four cases are depicted to scale in Fig.2, demonstrating that densest sampling around TE is achieved with a cropped matrix, high BW acquisition.
Data analysis: Images were motion corrected, high-pass filtered, and spatially smoothed (FWHM=2.5mm) using Gaussian and SUSAN filtering (FMRIB). Image SNR and temporal SNR (tSNR) were calculated in grey matter. Z-statistic maps of finger-tapping against baseline were computed with significant activation defined at Z > 3.1 (cluster-based correction, p < 0.05), using FILM8 (FMRIB), with fixed effects analyses for group results and repeated measure ANOVA for group-level comparisons.
Results & Discussion
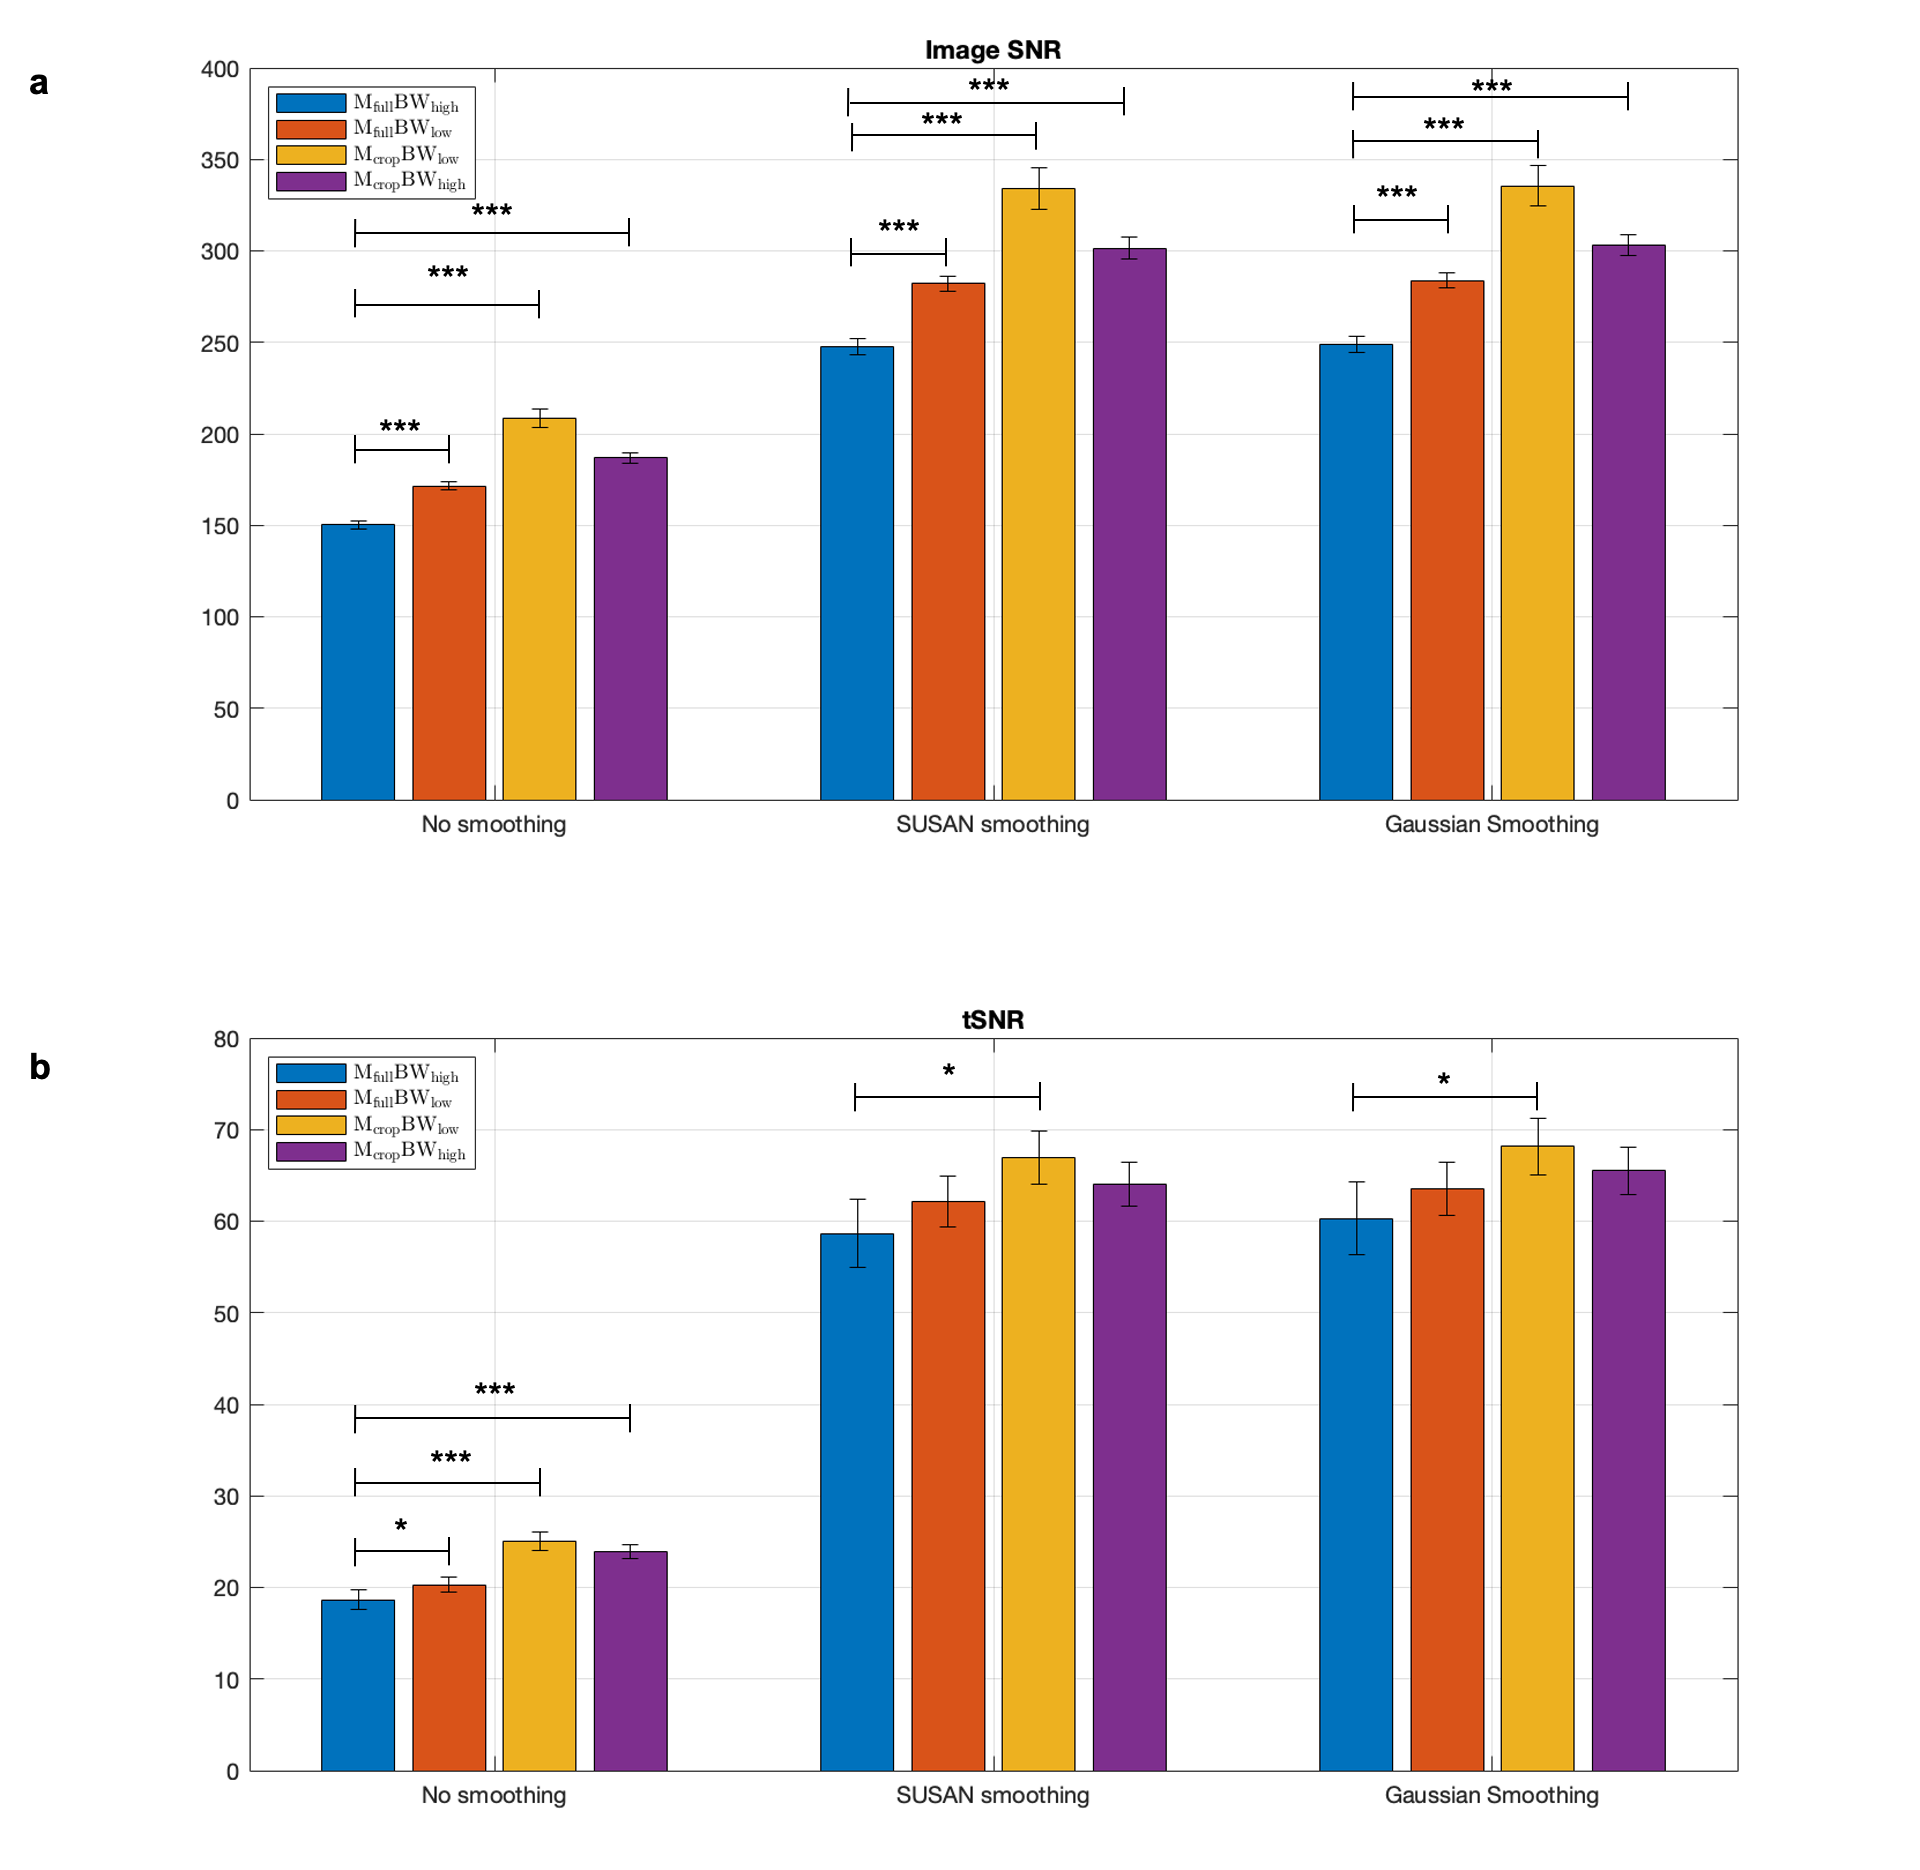
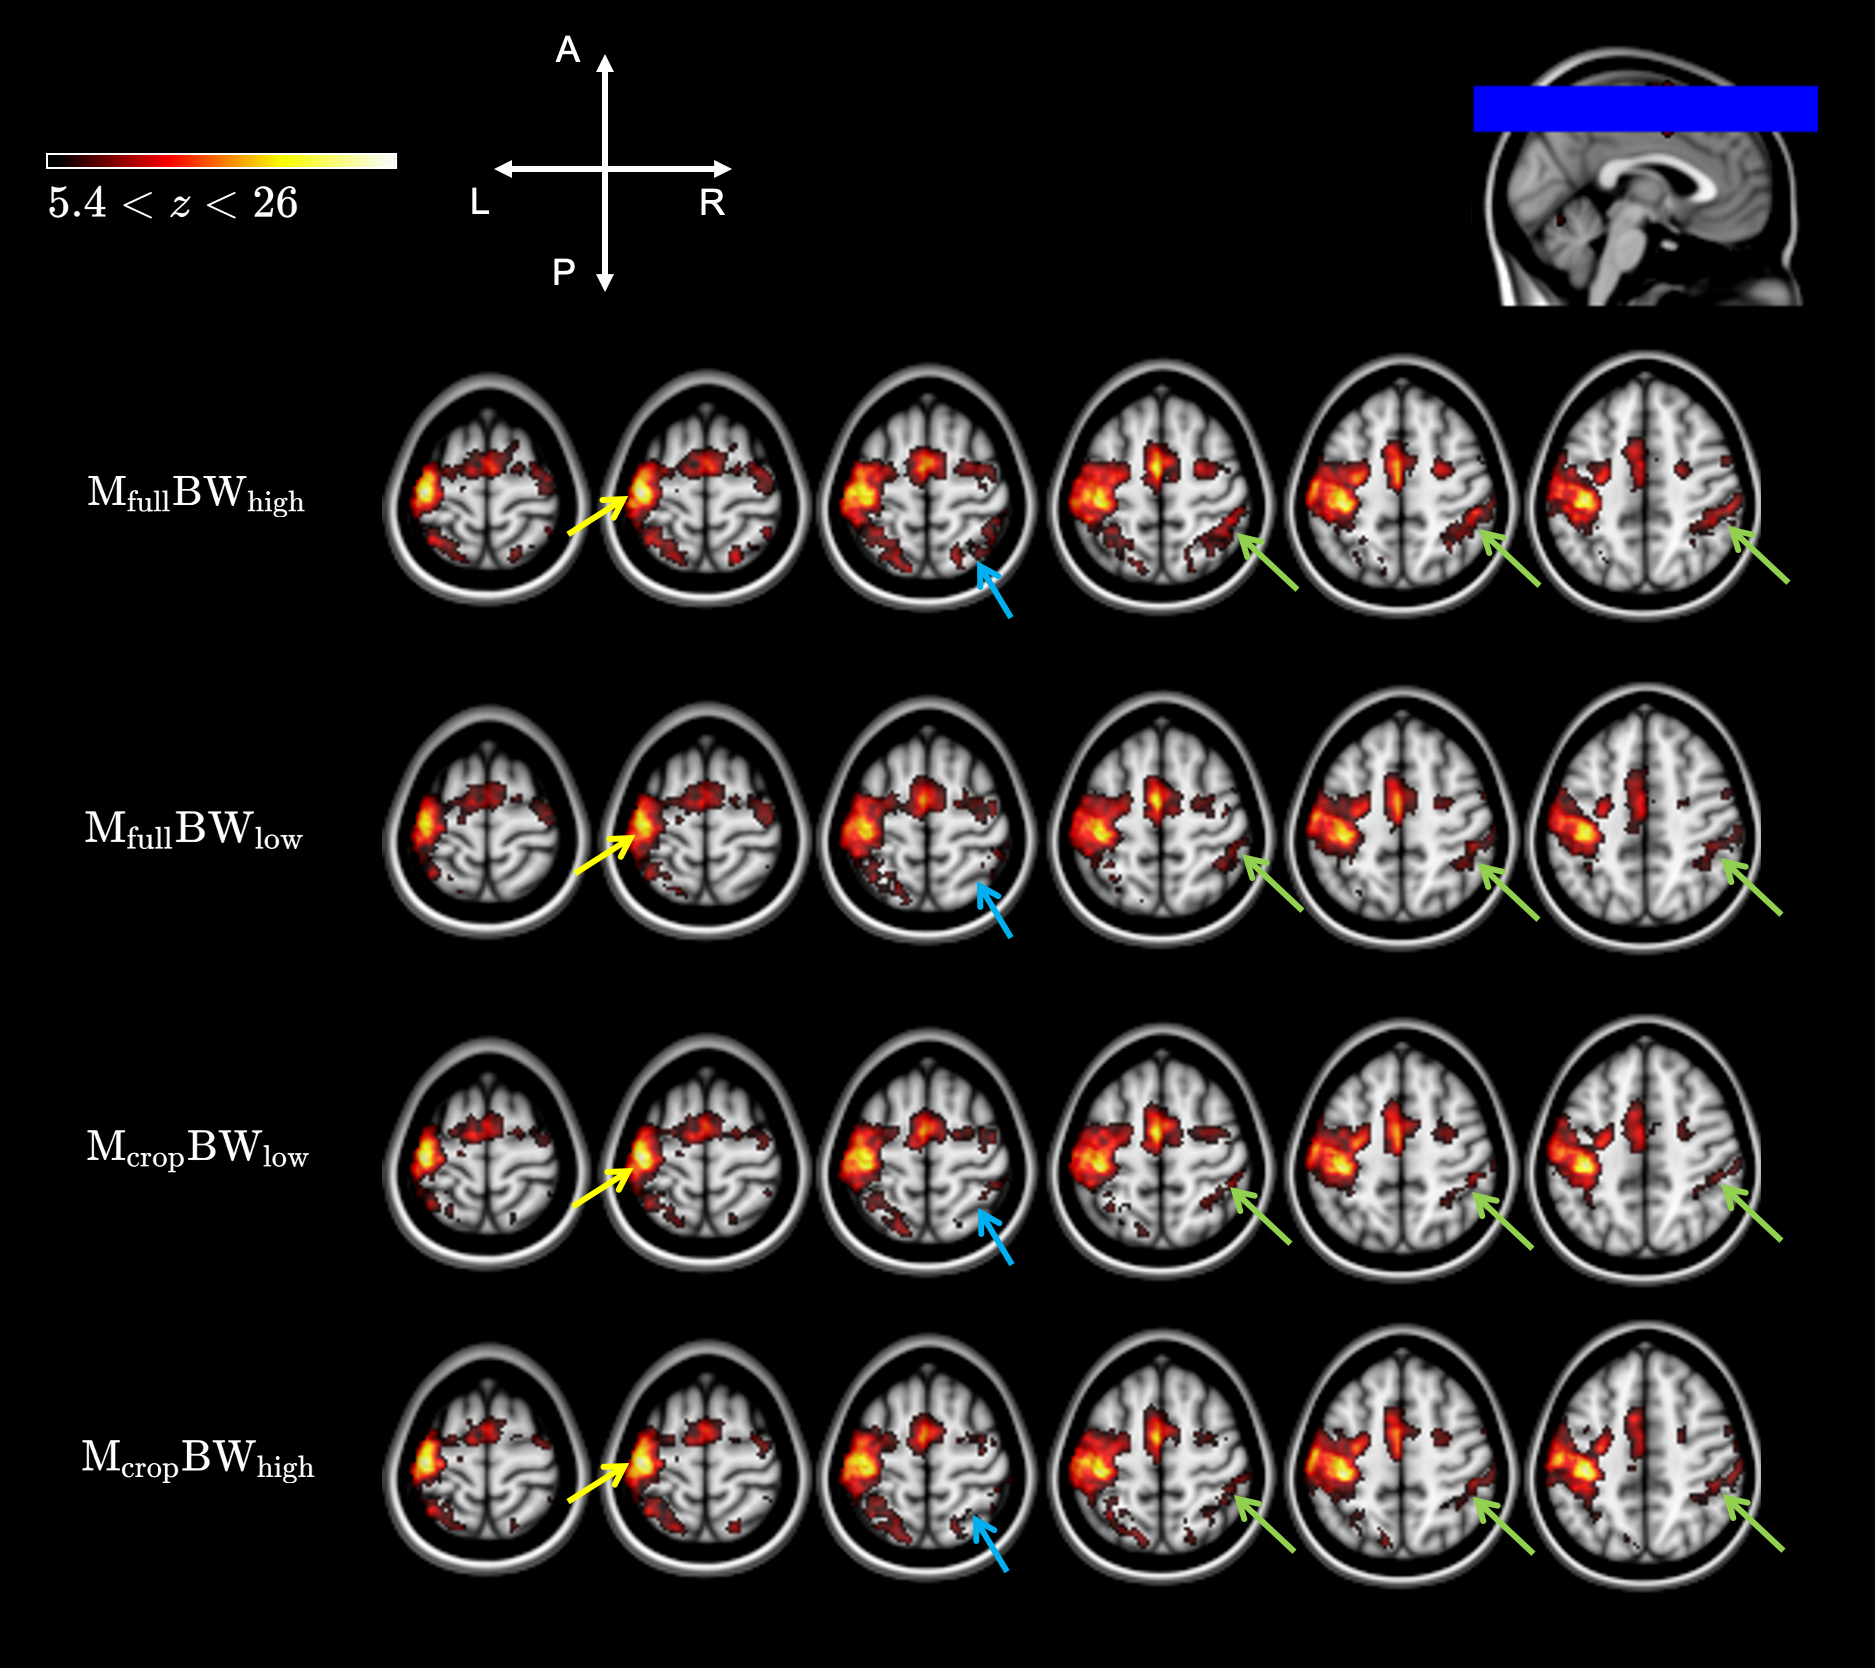
The smoothing-matched k-space acquisition and subsequent zero-padding induce a sinc kernel in image space, that when convolved with the Gaussian smoothing filter is negligibly different to the Gaussian smoothing filter itself, with a 1.67% mean-square-error difference over a 15x15mm2 range. As hypothesized, there were significant image SNR improvements for cropped k-space matrix acquisitions (orange and purple bars, Fig.4). Temporal SNR trended higher also, but was not statistically significantly different. In addition to smoothing-matched k-space coverage, the 30% reduction in pixel bandwidth (Mcrop-BWlow, orange bars) provided a 14% increase in tSNR on average compared to that of the Mfull-BWhigh case (blue bars, Fig.4). Low BW acquisition did not confer an advantage to activation maps. Instead, the smoothing-matched cropped k-space with high BW showed improvement in BOLD sensitivity in the contralateral motor cortex (M1-L, S1-L, yellow arrows Fig. 5). Not only was an increase in activation level found, in agreement with prior work9, but group-level activation showed greater specificity in ipsilateral regions S1-R (blue arrows, Fig.5) and SPL-R (green arrows, Fig.5), where more sparse activation is expected in a one-handed finger tapping10,11.Conclusion
By acquiring data only at spatial frequencies that survive BOLD-fMRI spatial smoothing, we have demonstrated the advantage of a dense sampling of k-space around the central echo time in terms of SNR and BOLD SPMs. Our results provide evidence that acquisition at the post-smoothing resolution can provide benefit to subsequent activation analyses. While we analyzed 7T data, our approach and results are applicable to any field strength. Current work involves optimizing the multiband factor12 and temporal resolution13 achievable with smoothing-matched k-space coverage.Acknowledgements
We acknowledge the facilities, and the scientific and technical assistance of the Australian National Imaging Facility, a National Collaborative Research Infrastructure Strategy (NCRIS) capability, at the Melbourne Brain Centre Imaging Unit of the University of Melbourne. The work was also supported by a research collaboration agreement with Siemens Healthineers.References
1. Worsley K, Marrett S, Neelin P, et al. A unified statistical approach for determining significant signals in images of cerebral activation. Hum. Brain Mapp. 1996; 4(1): 58–73.
2. Desikan, R. S., Ségonne, F., Fischl, B., Quinn, B. T., et al. An automated labeling system for subdividing the human cerebral cortex on MRI scans into gyral based regions of interest. Neuroimage. 2006; 31(3): 968-980.
3. Friston, K. J., Ashburner, J., Kiebel, S. J., Nichols, T. E., & Penny, W. D. Statistical parametric mapping: the analysis of functional brain images. 2007.
4. Kasper L, Maximilian H, Benjamin D, et al. Matched-filter acquisition for BOLD fMRI. NeuroImage. 2014; 100:145-160.
5. Greiser A and Kienlin M. Efficient k-space sampling by density-weighted phase-encoding. Magn. Reson. Med. 2003; 50(6):1266-1275
6. Moeller, S., Yacoub, E., Olman, C. et al. Multiband multislice GE‐EPI at 7 Tesla, with 16‐fold acceleration using partial parallel imaging with application to high spatial and temporal whole‐brain fMRI. Magnetic resonance in medicine. 2010; 63(5): 1144-1153.
7. Setsompop, K., Gagoski, B. A., Polimeni, J. R. et al. Blipped‐controlled aliasing in parallel imaging for simultaneous multislice echo planar imaging with reduced g‐factor penalty. Magnetic resonance in medicine. 2012; 67(5): 1210-1224.
8. Woolrich, M. W., Ripley, B. D., Brady, M., & Smith, S. M. Temporal autocorrelation in univariate linear modeling of FMRI data. Neuroimage. 2001; 14(6): 1370-1386.
9. Molloy, E. K., Meyerand, M. E., & Birn, R. M. The influence of spatial resolution and smoothing on the detectability of resting-state and task fMRI. Neuroimage. 2014; 86: 221-230.
10. Cramer, S. C., Finklestein, S. P., Schaechter, J. D., Bush, G., & Rosen, B. R. Activation of distinct motor cortex regions during ipsilateral and contralateral finger movements. Journal of neurophysiology. 1999. 81(1): 383-387.
11. Nelson, A. J., & Chen, R. Digit somatotopy within cortical areas of the postcentral gyrus in humans. Cerebral cortex. 2008. 18(10): 2341-2351.
12. Xu, J., Moeller, S., Auerbach, E. J., Strupp, J. et al. Evaluation of slice accelerations using multiband echo planar imaging at 3T. Neuroimage. 2013. 83: 991-1001.
13. Yoo, P. E., John, S. E., Farquharson, S., Cleary, J. O. et al. 7T-fMRI: Faster temporal resolution yields optimal BOLD sensitivity for functional network imaging specifically at high spatial resolution. Neuroimage. 2018. 164: 214-229.
Figures