2684
A new method for mapping baseline cerebral oxygen metabolism using breath-hold calibrated fMRI1School of Physics and Astronomy, Cardiff University, Cardiff, United Kingdom, 2Department of Physical Therapy and Human Movement Sciences, Northwestern University, Chicago, IL, United States, 3School of Psychology, Cardiff University, Cardiff, United Kingdom, 4Department of Neurosciences, University of Chieti-Pescara, Chieti, Italy
Synopsis
We derive a new expression for the maximum BOLD signal (M) that includes a simple model of oxygen exchange. Using this new expression for M and Monte-Carlo simulations we show that the resting cerebral metabolic rate of oxygen consumption (CMRO2) can be estimated from the resting perfusion (CBF) and maximum BOLD signal (M). The proposed method is demonstrated in-vivo using a repeated breath-holding protocol to measure M. This new gas-free method of estimating CMRO2 offers a pragmatic approach for estimate cerebral oxygen consumption that is simple to perform and well tolerated.
Introduction
A number of MRI methods1,2,3,4,5,6,7 have been proposed to map the cerebral metabolic rate of oxygen consumption (CMRO2). However, due to a combination of high SNR requirements and experimental complexity none of the proposed methods has yet to see widespread adoption. Here we present a straightforward and pragmatic approach for estimating CMRO2 that uses a simple repeated breath-holding protocol. The proposed method provides robust estimates of CMRO2, which can be acquired in less than 10 minutes and with minimal operator training. The method is based on a new formulation of M (the maximum BOLD signal), which includes a simple model of oxygen exchange8,9,10. Monte-Carlo modelling of the relationship between M, CBF, and CMRO2 suggest that CMRO2 can be estimated from M and the resting CBF with low uncertainty across a wide range of physiology. Here we use a breath-holding protocol to measure M as it is straight forward to acquire, well tolerated, and has been used in many clinical studies of BOLD cerebral vascular reactivity11.Methods
Following the modelling of references 9,10, and 12 we can express the resting cerebral metabolic rate of oxygen metabolism as shown in equation 1.$$ CMRO_{2}=CBV_{cap}\cdot\kappa\cdot( P_{50}\sqrt[h]{\frac{2}{OEF}-1}-PminO_{2}) $$
Where CBVcap is the capillary blood volume that exchanges oxygen with the tissue, $$$\kappa$$$ is the effective permeability of capillary endothelium and brain tissue (μmol/mmHg/ml/min), P50 is the blood oxygen tension at which haemoglobin is 50% saturated, h is the Hill coefficient (2.8) and PminO2 is the minimum oxygen tension at the mitochondria. The capillary blood volume exchanging oxygen with the tissue, CBVcap, is assumed to be a fraction of the BOLD sensitive blood volume (CBVv), i.e. $$$CBV_{v}=\rho\cdot CBV_{cap}$$$
Re-arranging equation 1 in terms of CBVv and substituting into the definition of M, $$$M= TE \cdot A\cdot CBV_{v}\cdot([Hb]\cdot(1- SvO_{2}))^{\beta}$$$ 13, we can derive an alternative definition of M as expressed by equation 2.
$$ M=\frac{CMRO_{2}\cdot TE \cdot A\cdot\rho\cdot ([Hb]\cdot(1- SvO_{2}))^{\beta}}{\kappa\cdot(P_{50} \sqrt[h]{\frac{2}{OEF}-1} -PminO_{2} )} $$
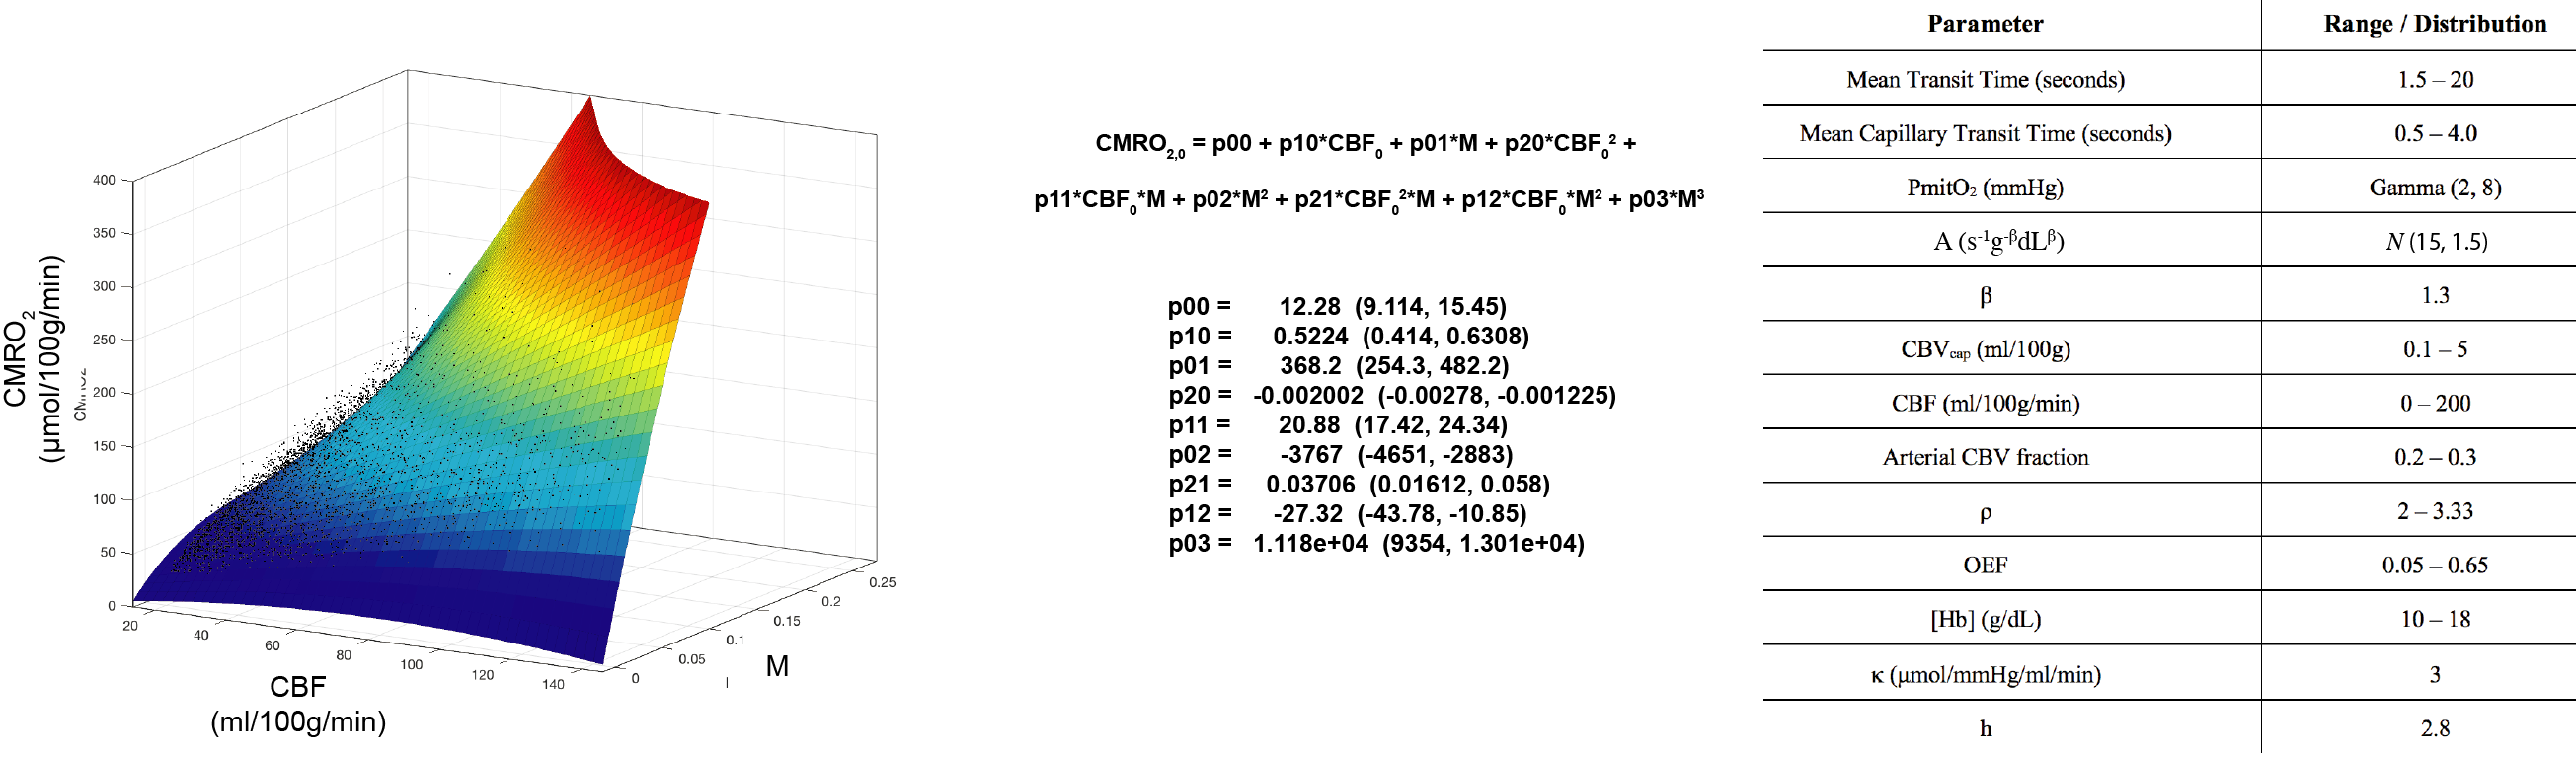
By assigning physiologically realistic parameter values and ranges to each of the unknown parameters (see table 1) we are able to model the relationship between M, CBF and CMRO2. Monte-Carlo modelling of this relationship reveals that CMRO2 can be estimated from M and CBF with low uncertainty (R2 = 0.92, RMSE = 9.8 μmol/100g/min) over a wide range of physiology using a simple polynomial surface (order 2,3), see figure 1.
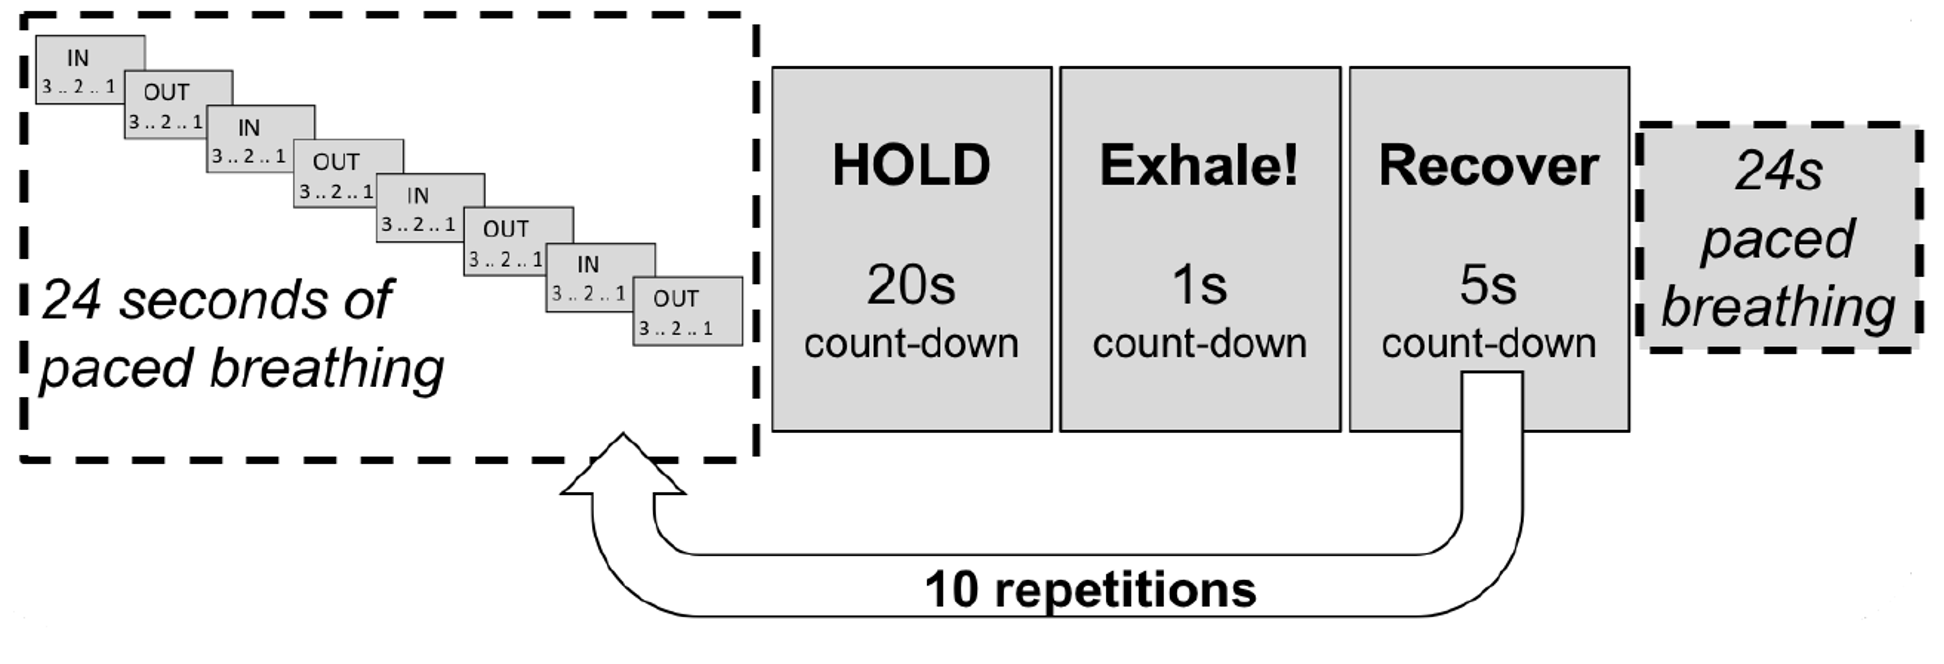
In-vivo data was acquired using an 8 minute 45 second dual-excitation pseudo-continuous arterial spin labelling (pCASL) and BOLD-weighted acquisition during intermittent breath-holding (see figure 2 for experimental protocol). Fifteen healthy volunteers (4 males, mean age 27.4 ± 6.2 years) were recruited to the study. The local ethics committee approved the study and written informed consent was obtained from each participant. The parameters for the homemade pCASL sequence were as follows: post-labelling delay and label duration 1.5 seconds, EPI readout with GRAPPA acceleration (factor = 3), TE1 = 10ms, TE2 = 30ms, TR = 4.4 seconds, 3.4 x 3.4 mm in-plane resolution, and 15 (7mm) slices with 20% slice gap.
Acquired MRI data were motion corrected and high pass filtered (BOLD data only) before the Fourier Transform of time series data was calculated. The first 15 Fourier bins were analysed with LightGBM14 regressors, trained on simulated data, to estimate CMRO2. Such a machine learning pipeline has previously been shown to provide rapid and robust assessment of physiological MRI data8.
Results
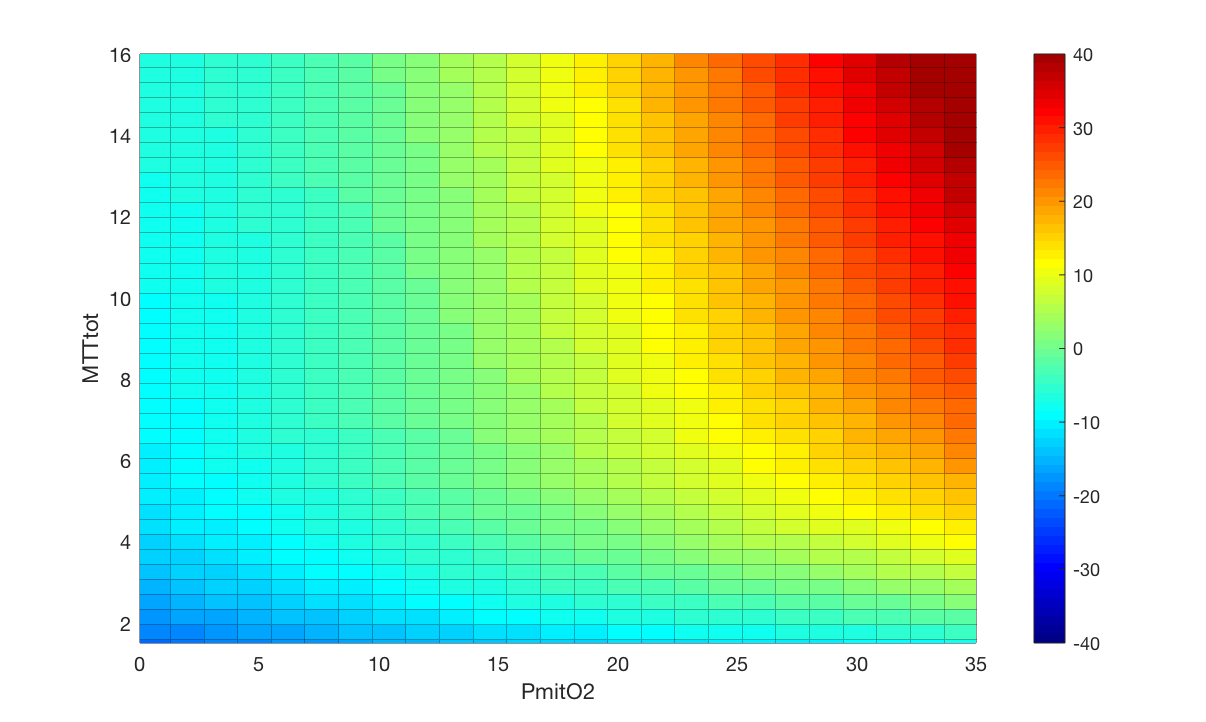
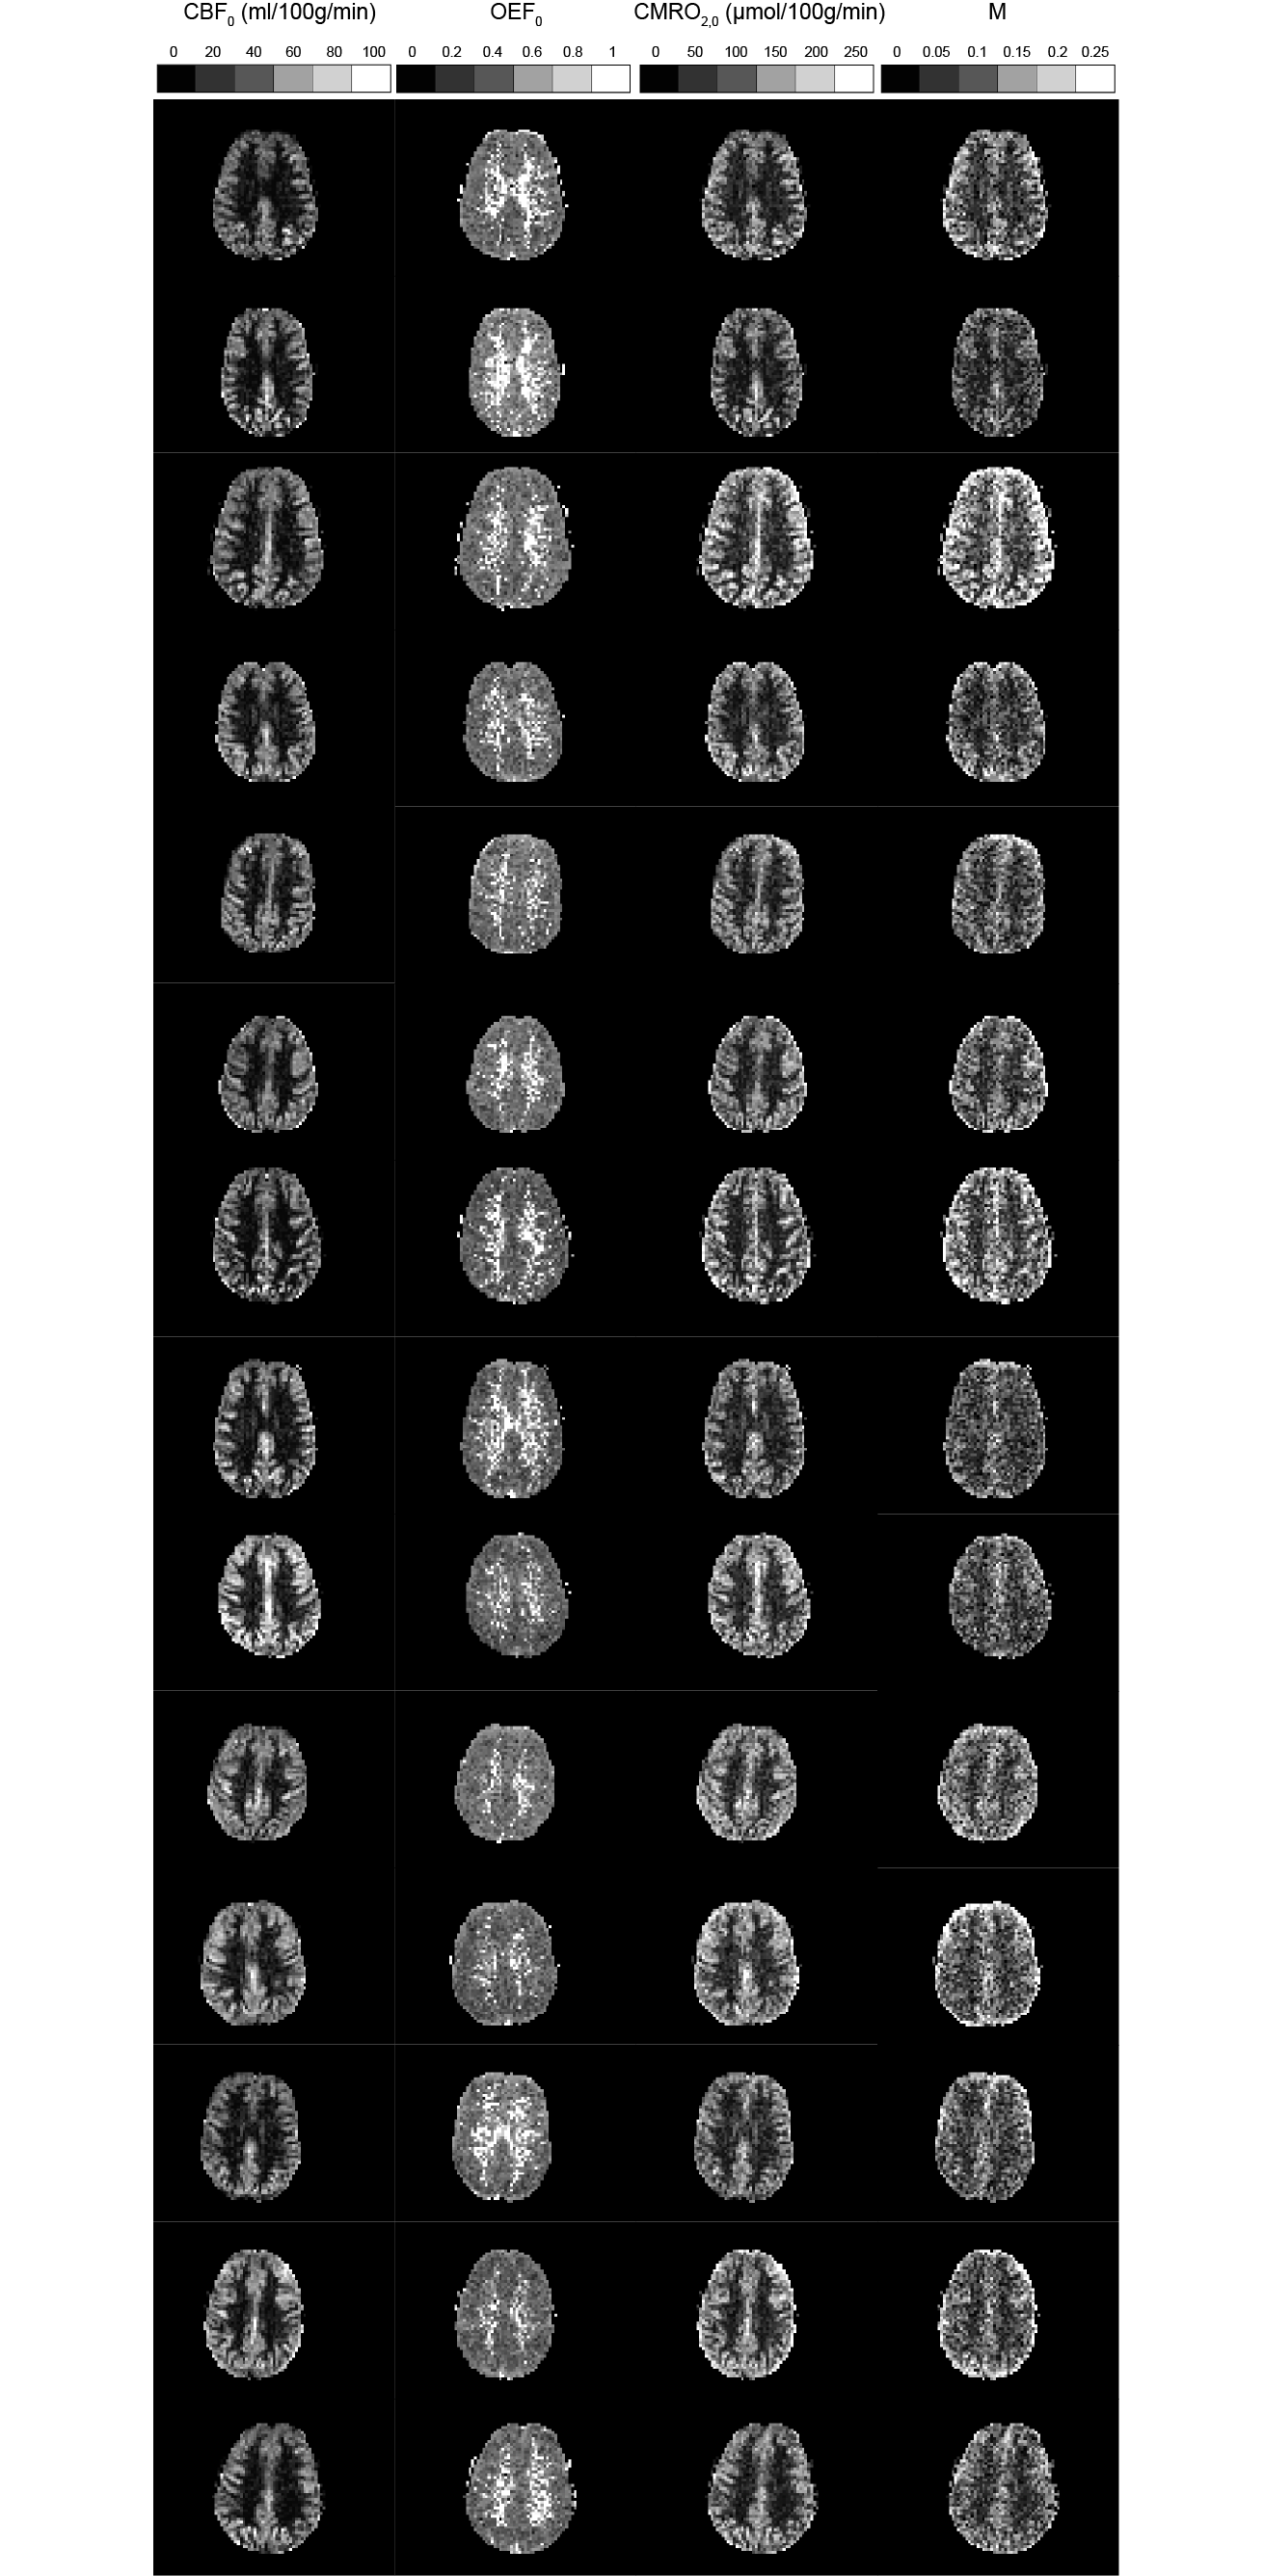
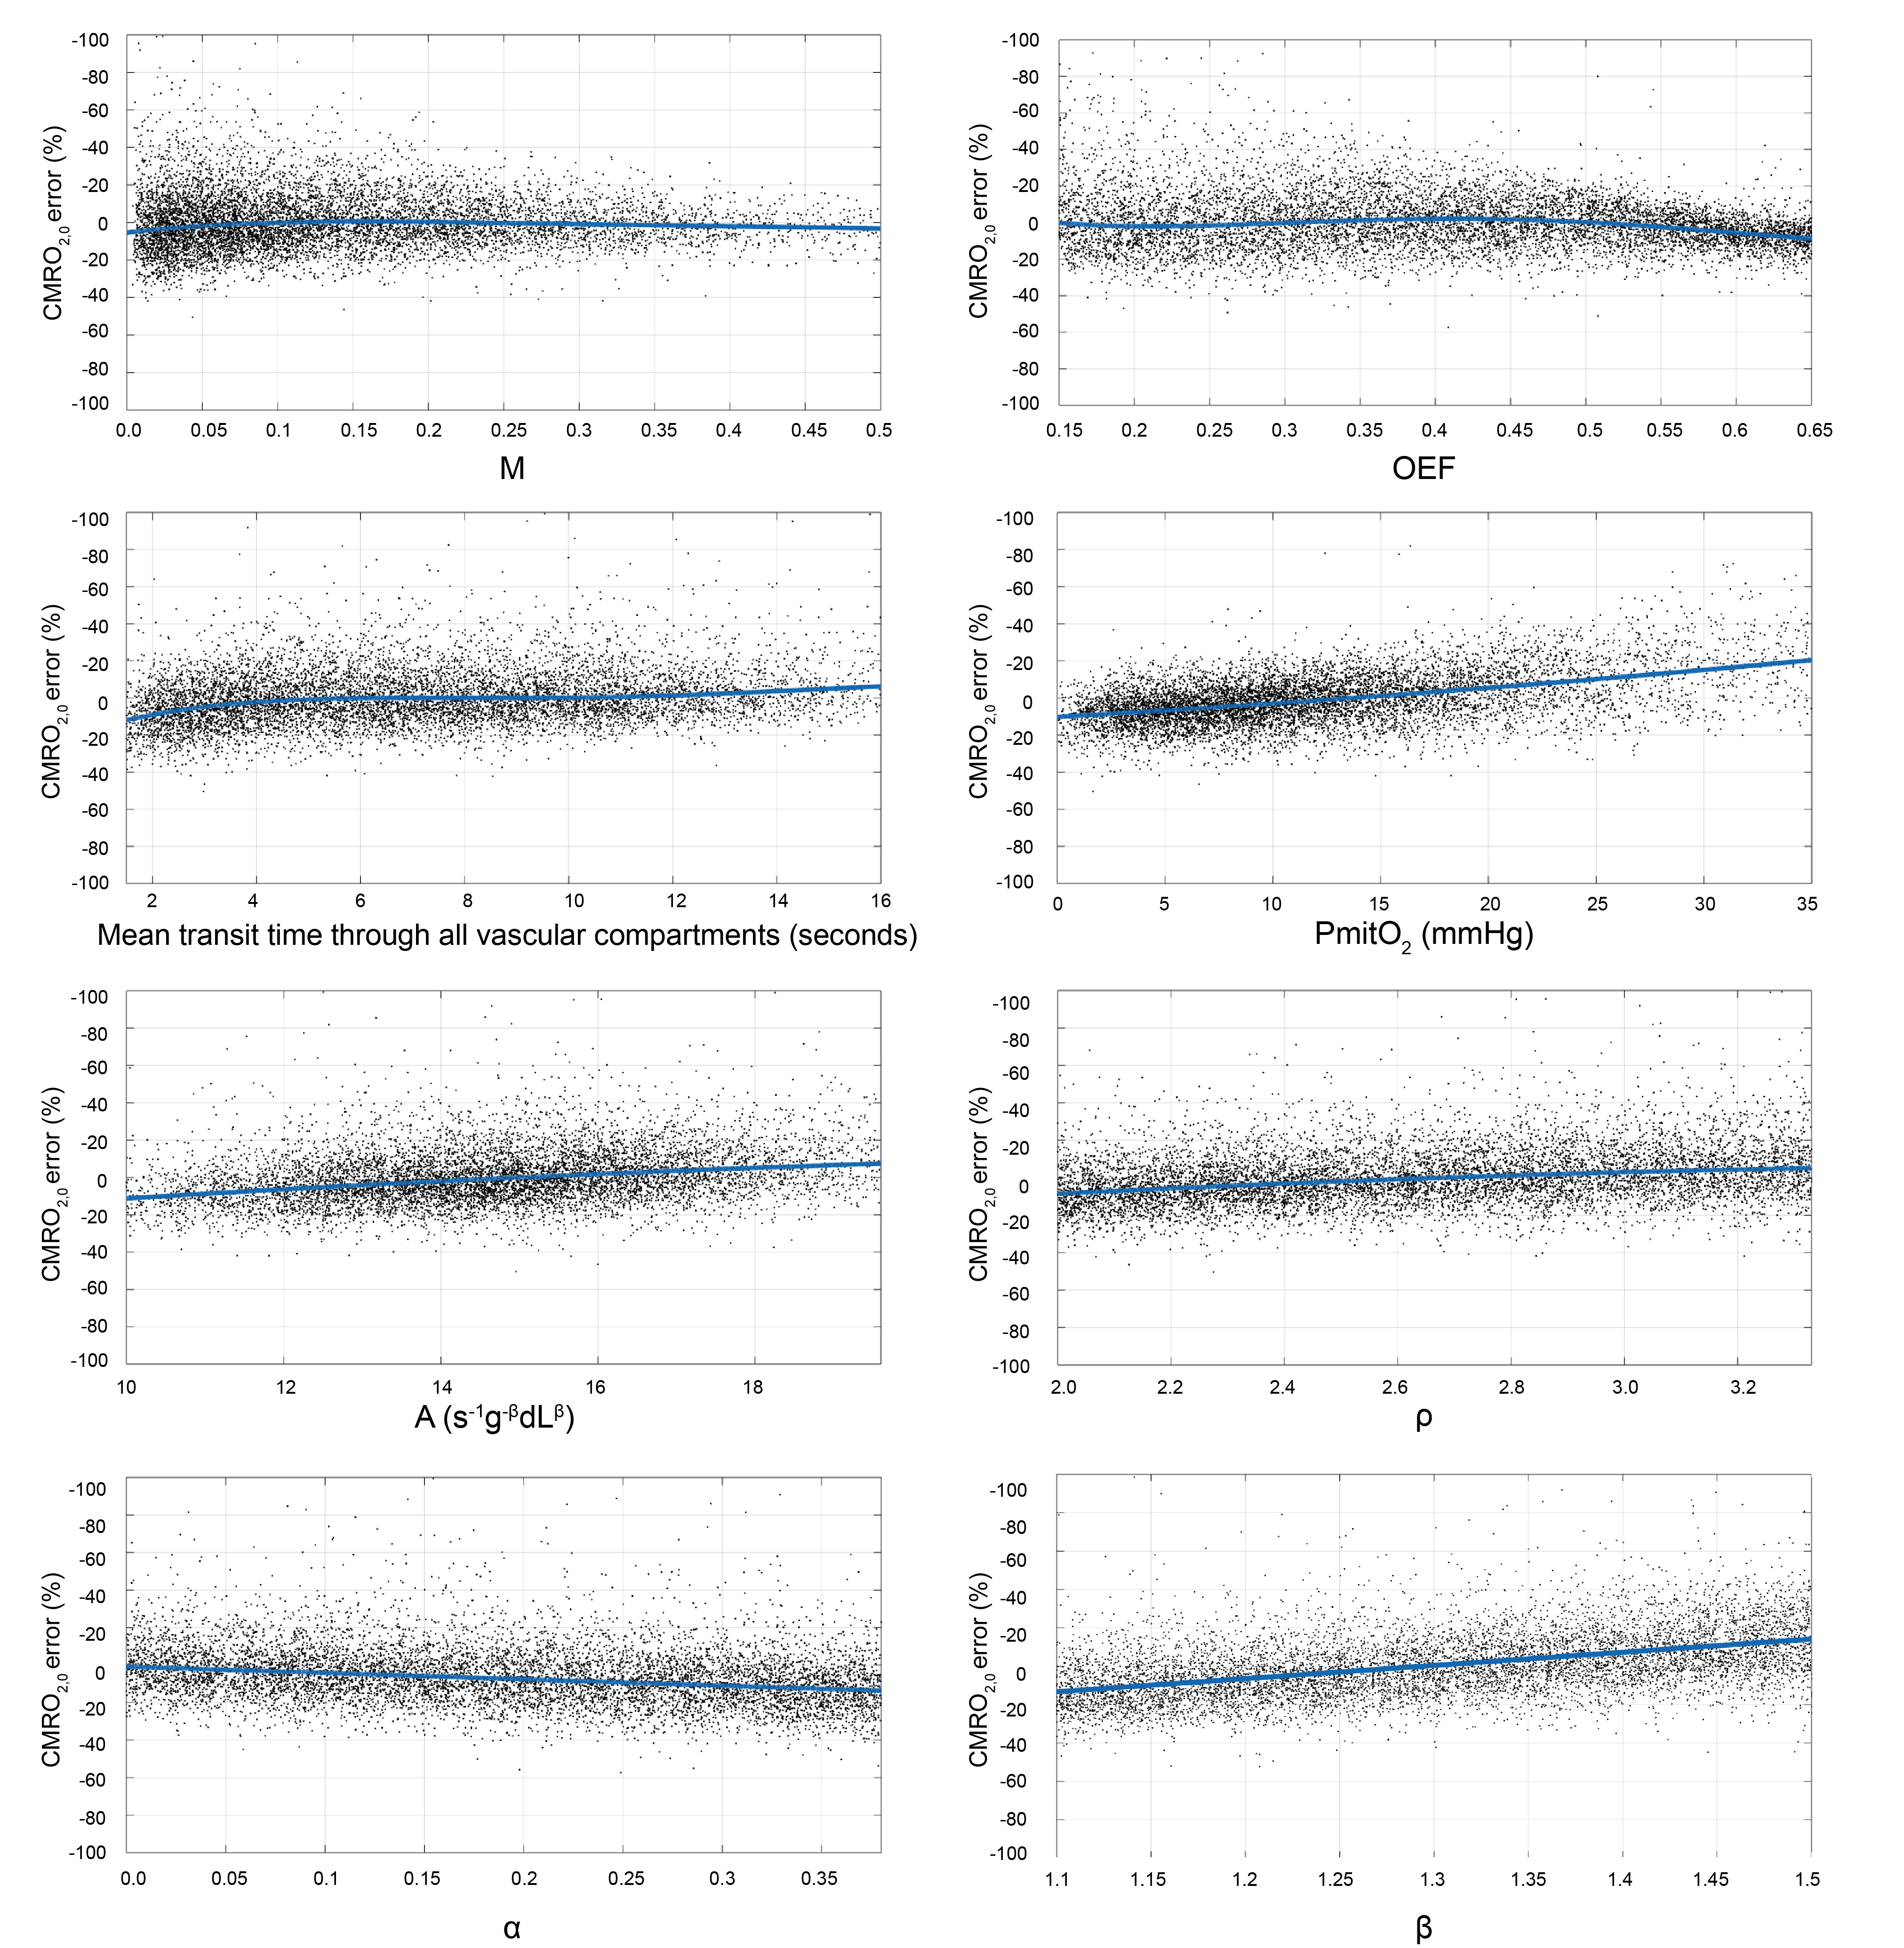
Cross-validation of the LightGBM regression models show that CMRO2 estimates have an R2 of 0.91 and a RMSE of 10.0 μmol/100g/min. Figure 3 shows the percentage error in CMRO2 estimates for key modelling and physiological parameters. The error plots typically have a bias of less than 10%, with maximum values approaching 20% at the extreme ranges of parameter values. A surface of the mean percentage CMRO2 error against MTT and PmitO2, figure 4, shows that the most significant bias only occurs when MTT is long and PmitO2 is high. The mean grey matter parameter estimates across the volunteers were, CMRO2 124.1 ± 10.4 μmol/100g/min, OEF 0.37 ± 0.03, CBF 47.6 ± 6.3 ml/100g/min, M 0.073 ± 0.01. Figure 5 displays example parameter maps from each volunteer. OEF estimates are approximately uniform in grey matter, however white matter estimates are higher than expected for normal physiology.Discussion/Conclusion
This work presents a practical and pragmatic method of mapping grey matter CMRO2 with MRI. The approach is straightforward to apply and should be widely applicable to basic research as well as clinical studies. Although the approach requires validation with proven measures of cerebral oxygen metabolism, the agreement between in-vivo results and previously observed physiological relationships is encouraging and supports the validity of the method.We have chosen to demonstrate the method using a breath holding protocol with simultaneously acquired BOLD and ASL data. This method provides rapid measurement of both M and CBF, which are required for the calculation of oxygen extraction and CMRO2. However, the method can in principle be applied to any data that can provide a robust measurement of M and an estimate of resting CBF. To facilitate such analysis we have provided a simple mapping from M and CBF to CMRO2.
Acknowledgements
The work was funded by Wellcome and the UK EPSRC.References
1. Bolar, D.S., Rosen, B.R., Sorensen, A.G., Adalsteinsson, E., 2011. QUantitative Imaging of eXtraction of oxygen and TIssue consumption (QUIXOTIC) using venular-targeted velocity-selective spin labeling. Magn Reson Med 66, 1550-1562.
2. Fan, A.P., Govindarajan, S.T., Kinkel, R.P., Madigan, N.K., Nielsen, A.S., Benner, T., Tinelli, E., Rosen, B.R., Adalsteinsson, E., Mainero, C., 2015. Quantitative oxygen extraction fraction from 7-Tesla MRI phase: reproducibility and application in multiple sclerosis. J Cereb Blood Flow Metab 35, 131-139.
3. Guo, J., Wong, E.C., 2012. Venous oxygenation mapping using velocity-selective excitation and arterial nulling. Magn Reson Med 68, 1458-1471.
4. He, X., Yablonskiy, D.A., 2007. Quantitative BOLD: mapping of human cerebral deoxygenated blood volume and oxygen extraction fraction: default state. Magn Reson Med 57, 115-126.
5. Bulte, D.P., Kelly, M., Germuska, M., Xie, J., Chappell, M.A., Okell, T.W., Bright, M.G., Jezzard, P., 2012. Quantitative measurement of cerebral physiology using respiratory-calibrated MRI. Neuroimage 60, 582-591.
6. Gauthier, C.J., Desjardins-Crepeau, L., Madjar, C., Bherer, L., Hoge, R.D., 2012. Absolute quantification of resting oxygen metabolism and metabolic reactivity during functional activation using QUO2 MRI. Neuroimage 63, 1353-1363.
7. Wise, R.G., Harris, A.D., Stone, A.J., Murphy, K., 2013. Measurement of OEF and absolute CMRO2: MRI-based methods using interleaved and combined hypercapnia and hyperoxia. Neuroimage 83, 135-147.
8. Germuska, M., Chandler, H., Okell, T., Fasano, F., Tomassini, V., Murphy, K., Wise, R., 2020. A frequency-domain machine learning method for dual-calibrated fMRI mapping of oxygen extraction fraction (OEF) and cerebral metabolic rate of oxygen consumption (CMRO2). Front Artif Intell 3.
9. Gjedde, A., 2002. Cerebral blood flow change in arterial hypoxemia is consistent with negligible oxygen tension in brain mitochondria. Neuroimage 17, 1876-1881
10. Hayashi, T., Watabe, H., Kudomi, N., Kim, K.M., Enmi, J., Hayashida, K., Iida, H., 2003. A theoretical model of oxygen delivery and metabolism for physiologic interpretation of quantitative cerebral blood flow and metabolic rate of oxygen. J Cereb Blood Flow Metab 23, 1314-1323.
11 Pillai, J.J. and Mikulis, D.J., 2015. Cerebrovascular Reactivity Mapping: An Evolving Standard for Clinical Functional Imaging. AJNR Am J Neuroradiol. 36 (1), 7-13
12. Vafaee, M.S., Gjedde, A., 2000. Model of blood-brain transfer of oxygen explains nonlinear flow-metabolism coupling during stimulation of visual cortex. J Cereb Blood Flow Metab 20, 747-754.
13. Hoge, R.D., Atkinson, J., Gill, B., Crelier, G.R., Marrett, S., Pike, G.B., 1999. Investigation of BOLD signal dependence on cerebral blood flow and oxygen consumption: the deoxyhemoglobin dilution model. Magn Reson Med 42, 849-863.
14. Ke, G., Meng, Q., Finley, T., 2017. LightGBM: A Highly Efficient Gradient Boosting Decision Tree. Advances in Neural Information Processing Systems 30.
Figures