2683
The impact of geometric distortions and their correction on fMRI data analyses1Coimbra Institute for Biomedical Imaging and Translational Research (CIBIT), Institute for Nuclear Sciences Applied to Health (ICNAS), University of Coimbra, Coimbra, Portugal, 2Faculty of Medicine, University of Coimbra, Coimbra, Portugal
Synopsis
The impact of geometric distortions on fMRI data analyses has been scarcely investigated, and a direct comparison between fMRI distortion correction approaches has not been performed so far. Here, we found that correcting the distortions from phase-reversed or field map images improved the registration into structural data, the identification of resting-state networks, and the mapping sensitivity of task-related activations, relatively to not correcting the distortions. Accounting for fMRI distortions is recommended, with the use of field map images yielding the best results at the cost of longer scanning times when compared to acquiring a few phase-reversed fMRI volumes.
Introduction
fMRI data is typically collected with GE-EPI sequences, which are prone to the susceptibility artifact as a result of B0 field inhomogeneity, mainly due to the long time interval between the acquisition of adjacent k-space points in the phase-encoding direction. The component of the artifact derived from in-plane spin dephasing induces geometric distortions1. A systematic investigation on the impact of these distortions, and the direct comparison of different approaches to tackle them, on fMRI data analyses is missing. Here, we directly compared, in the same dataset, two different distortion correction approaches, by acquiring additional: 1) EPI data with reversed phase encoding direction, and 2) standard (and undistorted) GE data at two different echo times. Three types of analyses on the distorted and corrected fMRI data were then conducted: a) registration into structural data, b) identification of resting-state networks (RSNs), and c) mapping of task-related brain regions.Methods
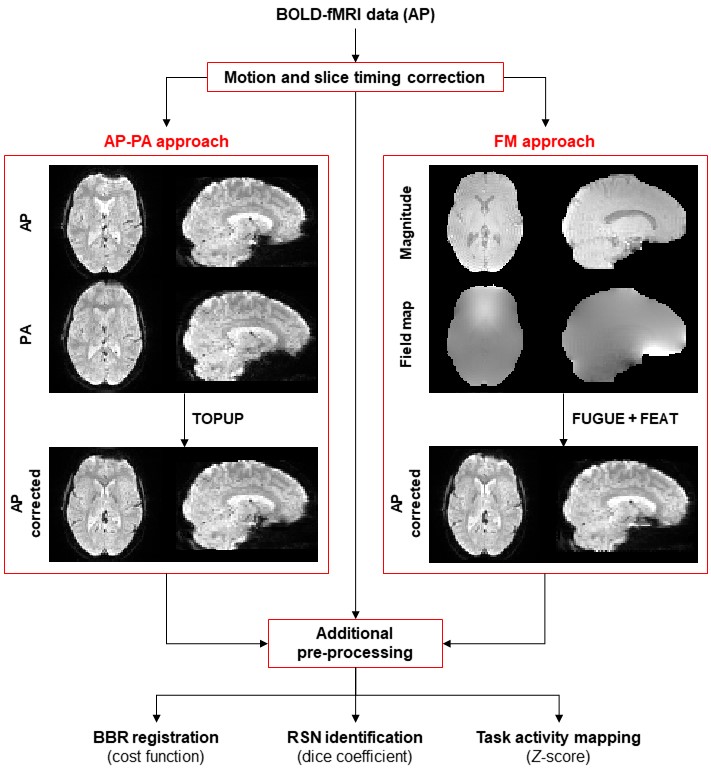
fMRI data acquisition: Imaging was performed on a 3T Siemens MRI system from twenty healthy subjects. BOLD-fMRI was acquired during one hMT/V5+ functional localizer2 (6min) and four biological motion perception3 (10min each) runs, using a 2D-EPI (3×SMS and 2×in-plane GRAPPA accelerations) sequence with TR/TE=1000/30.2ms, voxel size=2.5×2.5×2.5mm3, 51 axial slices (no gap and whole-brain coverage), FOV=195×195mm2, FA=68°, bandwidth=2086 Hz/pixel, echo spacing (effective)=0.57 (0.285)ms, 78 echoes per excitation pulse, and phase encoding in the anterior-posterior (AP) direction. Advanced pre-processing steps were performed4.Geometric distortion correction (Fig. 1): Before each functional run, additional data was acquired for distortion correction. First, field map imaging was performed with a double-echo spoiled GE sequence (3.5min) with TR=400ms, TE1/TE2=4.92/7.38ms (ΔTE=2.46ms for 3T), voxel size=2.5×2.5×2.5mm3 and 51 axial slices (matching the functional images), FOV=192×192mm2 and FA=60°, resulting in two magnitude (one per TE) and one phase difference images, from which the field map was calculated with fsl_prepare_fieldmap (FM approach). Second, 10 volumes (10sec) using the same parameters of the functional images but with reversed phase-encoding direction were collected (posterior-anterior, PA). The last PA volume and the middle volume of each (AP) functional run (the reference volume for motion correction, rendering the estimated displacement field alignment-wise valid for all AP volumes) were then used in FSL-TOPUP (AP-PA approach)5.
fMRI data analyses: The following analyses were performed on pre-processed fMRI data, with and without distortion correction. First, the reference AP volumes of each run were co-registered into the structural image (acquired with MP2RAGE, 1 mm isotropic) using the boundary-based registration (BBR) method; its cost function was used to quantify the registration quality. Second, group-level spatial ICA decomposition6 was performed for each run, identifying 10 RSNs based on their spatial overlap (quantified by the Dice coefficient7) with RSN templates8. Third, for each run, task activations were mapped with a GLM comprising a boxcar regressor with ones during the stimulation periods, and zeros during baseline periods. Voxels exhibiting significant changes between stimulation and baseline periods were identified by cluster thresholding (voxel Z>2.5, cluster p<0.05)9. Group activation maps were obtained using mixed-effects modelling10, from which the average and maximum Z-score values were extracted to quantify the mapping sensitivity. The main effect of performing distortion correction was evaluated by a 1-way ANOVA for each quality metric separately; post-hoc statistical tests were also performed (p<0.05) to evaluate the impact of each correction approach.
Results
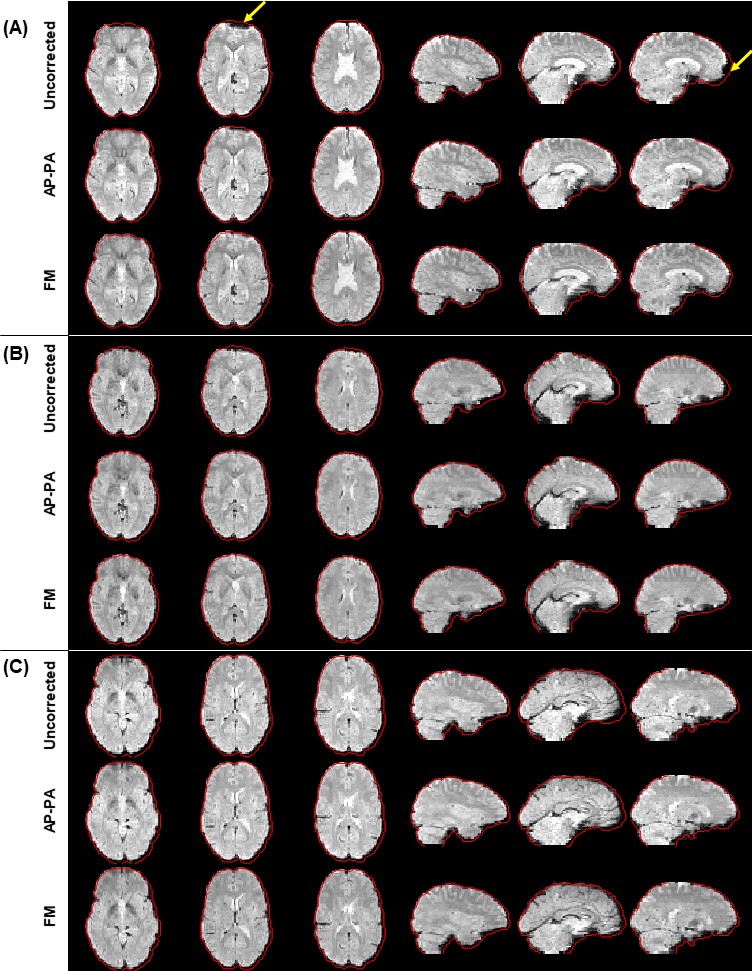
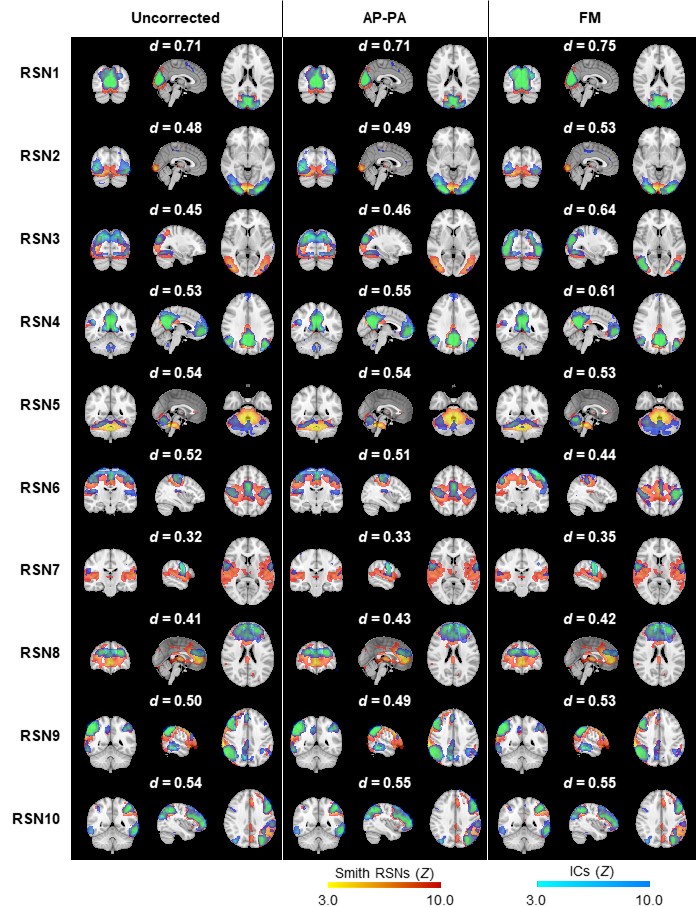
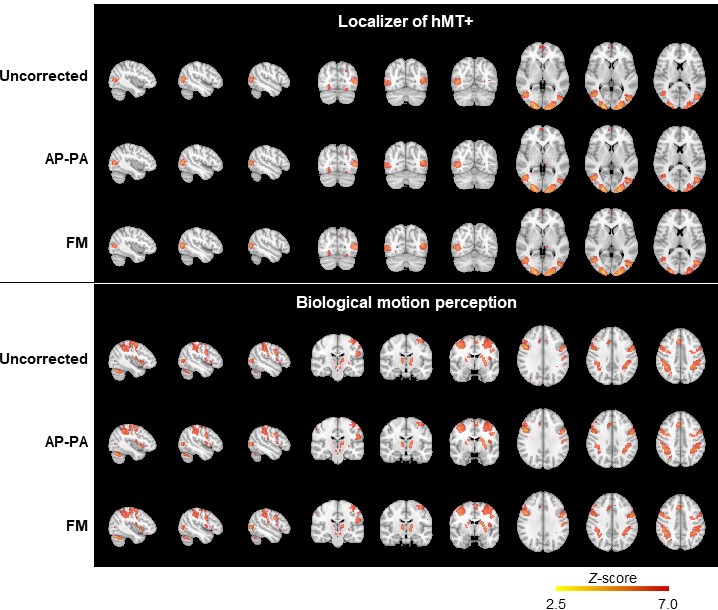
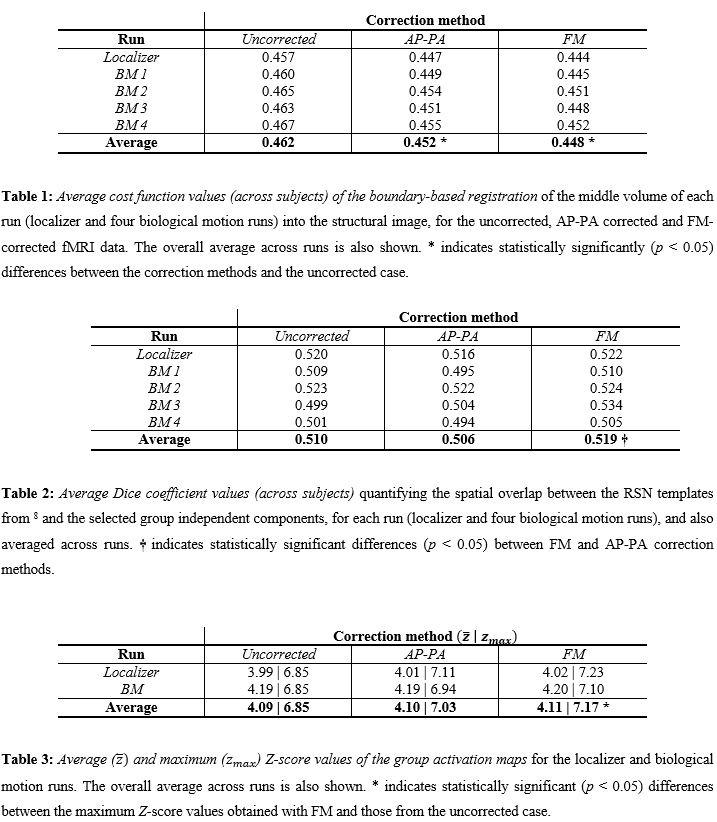
Fig. 2 illustrates the impact of geometric distortions, showing squashing of voxels mainly at the temporal and frontal lobes. The average BBR cost function values across subjects for each run, and across runs, are shown in Table 1, with AP-PA and FM corrections yielding significantly lower values than those without correction, and FM surpassing AP-PA. Fig. 3 illustrates group RSNs identified in one of the BM runs, superimposed with the closest RSN templates. The average Dice coefficient across RSNs and subjects for each run, and across runs, are shown in Table 2. FM yielded the highest values, and significantly higher than those of AP-PA, which exhibited the worst performance. Group activation maps from both tasks are shown in Fig. 4, highlighting the same active regions regardless of correcting the distortions, or the approach used for that purpose. The average and maximum Z-score values of each task are depicted in Table 3. Only the maximum Z-score values exhibited a clear trend (p=0.06), following the same pattern of the BBR cost function, with FM yielding significantly higher values than those of the uncorrected case.Discussion and Conclusion
We observed that geometric distortions and their correction significantly impact our fMRI analyses. While several comparison studies have focused on the registration quality and the presence of geometric distortions5,11–17, their impact on RSNs or activation maps has only been scarcely investigated. Overall, our results show that FM surpassed AP-PA, with both outperforming the results when no correction was performed. Distortion correction was previously found to positively impact these fMRI data analyses18,19, although direct comparisons have never been performed on fMRI data. Such comparisons have revealed contrasting results, with AP-PA outperforming FM17,20. Accounting for geometric distortions in fMRI data is thus recommended, which can be easily accomplished using AP-PA by acquiring a few phase-reversed volumes, or ultimately using FM for the best performance, which requires however additional scanning time for the field map imaging.Acknowledgements
This work was supported by Grants Funded by Fundação para a Ciência e Tecnologia, PAC –286 MEDPERSYST, POCI-01-0145-FEDER-016428, BIGDATIMAGE, CENTRO-01-0145-FEDER-000016 financed by Centro 2020 FEDER, COMPETE, FCT UID/4950/2020 – COMPETE, CONNECT.BCI POCI-01-0145- FEDER-30852, and BIOMUSCLE PTDC/MEC-NEU/31973/2017. FCT also funded an individual grant to JVD (Individual Scientific Employment Stimulus 2017 - CEECIND/00581/2017).References
1. Jezzard, P. Correction of geometric distortion in fMRI data. NeuroImage 62, 648–651 (2012).
2. Huk, A. C., Dougherty, R. F. & Heeger, D. J. Retinotopy and functional subdivision of human areas MT and MST. J. Neurosci. 22, 7195–7205 (2002).
3. Chang, D. H. F., Ban, H., Ikegaya, Y., Fujita, I. & Troje, N. F. Cortical and subcortical responses to biological motion. Neuroimage 174, 87–96 (2018).
4. Abreu, R., Nunes, S., Leal, A. & Figueiredo, P. Physiological noise correction using ECG-derived respiratory signals for enhanced mapping of spontaneous neuronal activity with simultaneous EEG-fMRI. Neuroimage 154, 115–127 (2017).
5. Andersson, J. L. R., Skare, S. & Ashburner, J. How to correct susceptibility distortions in spin-echo echo-planar images: Application to diffusion tensor imaging. Neuroimage 20, 870–888 (2003).
6. Beckmann, C. F. & Smith, S. M. Probabilistic independent component analysis for functional magnetic resonance imaging. IEEE Trans. Med. Imaging 23, 137–52 (2004).
7. Dice, L. R. Measures of the Amount of Ecologic Association Between Species. Ecology 26, 297–302 (1945).
8. Smith, S. M. et al. Correspondence of the brain’s functional architecture during activation and rest. Proc. Natl. Acad. Sci. U. S. A. 106, 13040–13045 (2009).
9. Woolrich, M. W., Ripley, B. D., Brady, M. & Smith, S. M. Temporal autocorrelation in univariate linear modeling of FMRI data. Neuroimage 14, 1370–86 (2001).
10. Beckmann, C. F., Jenkinson, M. & Smith, S. M. General multilevel linear modeling for group analysis in FMRI. Neuroimage 20, 1052–1063 (2003).
11. Glodeck, D., Hesser, J. & Zheng, L. Distortion correction of EPI data using multimodal nonrigid registration with an anisotropic regularization. Magn. Reson. Imaging 34, 127–136 (2016).
12. Ardekani, S. & Sinha, U. Geometric distortion correction of high-resolution 3 T diffusion tensor brain images. Magn. Reson. Med. 54, 1163–1171 (2005).
13. Hutton, C. et al. Image distortion correction in fMRI: A quantitative evaluation. Neuroimage 16, 217–240 (2002).
14. Bhushan, C. et al. Co-registration and distortion correction of diffusion and anatomical images based on inverse contrast normalization. Neuroimage 115, 269–280 (2015).
15. Jezzard, P. & Balaban, R. S. Correction for geometric distortion in echo planar images from B0 field variations. Magn. Reson. Med. 34, 65–73 (1995).
16. Holland, D., Kuperman, J. M. & Dale, A. M. Efficient correction of inhomogeneous static magnetic field-induced distortion in Echo Planar Imaging. Neuroimage 50, 175–183 (2010).
17. Graham, M. S., Drobnjak, I., Jenkinson, M. & Zhang, H. Quantitative assessment of the susceptibility artefact and its interaction with motion in diffusion MRI. PLoS One 12, (2017).
18. Cusack, R., Brett, M. & Osswald, K. An evaluation of the use of magnetic field maps to undistort echo-planar images. Neuroimage 18, 127–142 (2003).
19. Togo, H. et al. Effects of Field-Map Distortion Correction on Resting State Functional Connectivity MRI. Front. Neurosci. 11, (2017).
20. Hong, X., To, X. V., Teh, I., Soh, J. R. & Chuang, K. H. Evaluation of EPI distortion correction methods for quantitative MRI of the brain at high magnetic field. Magn. Reson. Imaging 33, 1098–1105 (2015).
Figures