2677
Coherence-resolved Looping Star – improvements for silent multi-gradient echo structural and functional neuroimaging
Nikou Louise Damestani1, David John Lythgoe1, Ana Beatriz Solana2, Brice Fernandez3, Steven Charles Rees Williams1, Fernando Zelaya1, and Florian Wiesinger2
1Department of Neuroimaging, King's College London, London, United Kingdom, 2ASL Europe, GE Healthcare, München, Germany, 3ASL Europe, GE Healthcare, Paris, France
1Department of Neuroimaging, King's College London, London, United Kingdom, 2ASL Europe, GE Healthcare, München, Germany, 3ASL Europe, GE Healthcare, Paris, France
Synopsis
We have previously reported acoustically silent functional MRI using a novel pulse sequence known as Looping Star, which has been successfully implemented across distinct paradigms in spite of limitations to image quality and signal-to-noise. Here, we present a recent important improvement of Looping Star and demonstrate its robust performance for both functional imaging (in terms of visual BOLD fMRI) and structural imaging (in terms of T2*-weighted and quantitative susceptibility mapping).
Introduction
Evidence supporting the sensitivity of Looping Star to neural functional activation has been well-established across numerous paradigms and at rest1-5. Since Looping Star employs a three-dimensional radial acquisition scheme, as well as low flip-angle excitation pulses, signal-to-noise ratio and low sampling density away from the centre of k-space have been of concern. Furthermore, the first implementation of the Looping Star acquisition scheme involved an artefact whereby the coherences of the incoming and outgoing echoes overlapped, leading to signal interference. Although this issue can be partly addressed via filtering or phase-cycling (with prolonged scan time), a clever adjustment of the pulse sequence can address this artefact at its root source. We previously demonstrated an initial strategy to overcome this problem5,6 and here we report an extension of this approach with in-vivo applications, ultimately producing a silent MRI acquisition pipeline.This is an essential improvement for the acoustically quiet Looping Star pulse sequence, which will further facilitate its translation to future studies across numerous cohorts.
Methods
For the first iteration of Looping Star1 (Fig. 1, left), gradients are applied such that the k-space trajectory self-refocuses with only minor directional gradient changes. As there is overlap between the echo-in and echo-out refocusing signal coherences, filtering and/or RF-phase cycling is required to reduce artefacts. The modification presented in (Fig. 1, right) involves exciting only every second spoke at the mid-point of the readout gradient, generating diametric spokes during which the signal is sampled as the trajectory moves through the centre of k-space. The coherences are then effectively separated in time, thereby avoiding the echo-in/echo-out mixing of the original Looping Star implementation.The acquisition was performed on a 3T MR750 GE Healthcare scanner (GE Healthcare, Chicago, IL) using a 32-channel head coil (Nova Medical, Wilmington, MA). Five volunteers participated in the fMRI paradigm. Quantitative susceptibility mapping (QSM) and high-resolution T2*-weighted structural imaging were acquired for one of the participants. A Casella 62X sound level meter (Casella Solutions, Bedford, UK) was used to measure the acoustic noise levels, placed at the centre of the scanner bore. The fMRI paradigm consisted of an 8Hz visual checkerboard with 10s duration and 20s break between blocks. We also acquired an anatomical image for each participant using a silent T1-weighted IR-prepared RUFIS acquisition for spatial normalisation of the fMRI datasets7,8. The full details of the acquisitions are as follows:
- fMRI Looping Star: 24 spokes per echo, 2 echoes, 31.25kHz, 19.2cm FOV, 3mm isotropic resolution, FA = 2, TE = 0ms, 26.88ms, TR = 1.53s, NEX = 0.25, 128 volumes
- QSM Looping Star: 4 spokes per echo, 4 echoes, 31.25kHz, 19.2cm FOV, 1mm isotropic resolution, FA = 2, TE = 0ms, 12.7ms, 25.4ms, 38.1ms, TR (acquisition time) = 5 mins 40s
- High-resolution Looping Star: 8 spokes per echo, 2 echoes, 31.25kHz, 19.2cm FOV, 1mm isotropic resolution, FA = 2, TE = 0ms, 25.5ms, TR (acquisition time) = 2 mins 44s
- Anatomical RUFIS: 15.6kHz, 1mm isotropic resolution, 22cm FOV, FA = 2, TI = 450ms
Image reconstruction of all Looping Star datasets was performed using nearest-neighbour 3D gridding. For the QSM maps, sensitivity maps were calculated from a calibration region in the centre of k-space9. Coil combination was computed using the sensitivity maps. Phase unwrapping and frequency fitting were performed with Romeo10. Background fields were removed using the Projection onto Dipole Fields method11. The MEDI toolbox12 was used for background field removal and susceptibility calculation.
Steady-state signal stabilisation was corrected for by removing the first four volumes of the Looping Star fMRI dataset. Temporal signal-to-noise ratio was calculated as described by Friedman and Glover13. This dataset was pre-processed with a standard SPM-12 pipeline, including segmentation of the T1-weighted RUFIS scan, realignment, co-registration of the FID and the T1 and extrapolation to the echoes, normalisation to MNI space and 6mm FWHM smoothing. First level and group level analyses were performed in SPM-12 on both the FID and the echo datasets. First level analysis was also performed across the group due to the small sample size. A 128s high-pass filter was applied with motion regressors modelled. The whole brain was thresholded at p < 0.001 uncorrected with a cluster extent threshold of zero due to the small sample size, with pFWE cluster-level significance reported at p < 0.05.
Results
The acoustic noise level (LAeq) of Looping Star fMRI was 66.5dBA and of Looping Star structural fMRI was 74.4dBA, with the noise level of the ambient scan room being 65dBA. Figure 2 presents the high-resolution, QSM and fMRI images. The reported QSM values are consistent with those previously reported14. Figure 3 demonstrates the functional MRI analysis outputs, highlighting a robust visual response across our cohort in both the echo and FID image. The latter is likely due to the contribution of inflow effects around the large veins in the occipital cortex15. The tSNR values seen in this figure were also higher than previously reported2.Conclusions
Looping Star is indeed a promising modality for fMRI investigations and for other applications where T2*-based contrast is desired, within an acoustically silent environment. This silent pipeline would have significant benefits in particular to patient cohorts with symptoms of hypersensitivity to sound.Acknowledgements
This presentation represents independent research supported by the National Institute for Health Research (NIHR) Biomedical Research Centre at South London and Maudsley NHS Foundation Trust and King’s College London. Nikou is in receipt of a PhD studentship funded by the NIHR Maudsley Biomedical Research Centre. The views expressed are those of the author(s) and not necessarily those of the NHS, the NIHR or the Department of Health and Social Care. Florian Wiesinger, Ana Beatriz Solana and Brice Fernandez are employed by GE Healthcare. With thanks to Dr Tobias Wood and Dr Emil Ljungberg for their support.References
- Wiesinger, F., Menini, A. and Solana, A.B. 2019. Looping star. Magnetic Resonance in Medicine, 81(1), pp.57-68.
- Dionisio‐Parra, B., Wiesinger, F., Sämann, P.G., Czisch, M. and Solana, A.B. 2020. Looping Star fMRI in Cognitive Tasks and Resting State. Journal of Magnetic Resonance Imaging.
- Damestani, N.L., Lythgoe, D.J., Wiesinger, F., Solana, A.B., Williams, S.C.R., Zelaya. F. 2019. Identifying functional resting state networks in silence using Looping Star. In Proceedings of the 25th Annual Meeting of OHBM. Rome, Italy. Abstract 1929.
- Damestani, N.L., O’Daly, O., Lythgoe, D.J., Wiesinger, F., Solana, A.B., Williams, S.C.R., Zelaya. F. 2020. Silent functional MRI for novel sound discrimination using the auditory oddball paradigm. In Proceedings of the 27th Annual Meeting of ISMRM. Virtual. Abstract 3894.
- Damestani, N.L., Lythgoe, D.J., Wiesinger, F., Solana, A.B., Williams, S.C.R., Zelaya. F. 2020. Silent fMRI of auditory and motor functions using coherence-resolved Looping Star. In Proceedings of the 26th Annual Meeting of OHBM. Virtual. Abstract 2022.
- Wiesinger, F., Solana, A.B. 2020. Looping Star: Revisiting echo in/out separation. In Proceedings of the 27th Annual Meeting of ISMRM. Virtual. Abstract 3733.
- Holdsworth, S.J., Macpherson, S.J., Yeom, K.W., Wintermark, M. and Zaharchuk, G. 2018. Clinical evaluation of silent T1-weighted MRI and silent MR angiography of the brain. American Journal of Roentgenology, 210(2), pp.404-411.
- Alibek, S., Vogel, M., Sun, W., Winkler, D., Baker, C.A., Burke, M. and Gloger, H., 2014. Acoustic noise reduction in MRI using Silent Scan: an initial experience. Diagnostic and interventional radiology, 20(4), p.360.
- McKenzie, C.A., Yeh, E.N., Ohliger, M.A., Price, M.D. and Sodickson, D.K., 2002. Self‐calibrating parallel imaging with automatic coil sensitivity extraction. Magnetic Resonance in Medicine: An Official Journal of the International Society for Magnetic Resonance in Medicine, 47(3), pp.529-538.
- Dymerska, B., Eckstein, K., Bachrata, B., Siow, B., Trattnig, S., Shmueli, K. and Robinson, S.D. 2020. Phase unwrapping with a rapid opensource minimum spanning tree algorithm (ROMEO). Magnetic Resonance in Medicine.
- Liu, T., Khalidov, I., de Rochefort, L., Spincemaille, P., Liu, J., Tsiouris, A.J. and Wang, Y. 2011. A novel background field removal method for MRI using projection onto dipole fields. NMR in Biomedicine, 24(9), pp.1129-1136.
- Wang, Y. and Liu T., 2015. Quantitative susceptibility mapping (QSM): decoding MRI data for a tissue magnetic biomarker. Magnetic resonance in medicine, 73(1), pp.82-101. Society for Magnetic Resonance in Medicine, 47(3), pp.529-538.
- Friedman, L. and Glover, G.H. 2006. Report on a multicenter fMRI quality assurance protocol. Journal of Magnetic Resonance Imaging: An Official Journal of the International Society for Magnetic Resonance in Medicine, 23(6), pp.827-839.
- Cohen-Adad, J. 2014. What can we learn from T2* maps of the cortex?. Neuroimage, 93, pp.189-200.
- Paasonen, J., Laakso, H., Pirttimäki, T., Stenroos, P., Salo, R.A., Zhurakovskaya, E., Lehto, L.J., Tanila, H., Garwood, M., Michaeli, S. and Idiyatullin, D. 2020. Multi-band SWIFT enables quiet and artefact-free EEG-fMRI and awake fMRI studies in rat. NeuroImage, 206, p.116338.
Figures
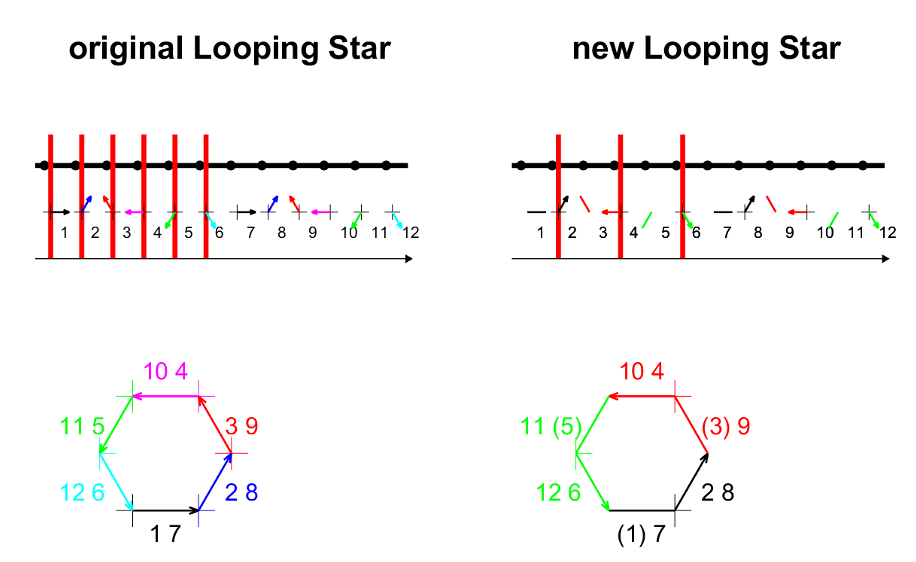
Figure 1: 2D visual representation of the previous and current implementations of Looping Star. The arrows indicate the coherences, the thick black line represents the gradient amplitude and red lines represent the RF pulses. It can be seen that the RF pulses are applied at the midpoint of the gradients in the newest version of Looping Star, separating out the signals from different coherences. Figure produced by Dr Florian Wiesinger.
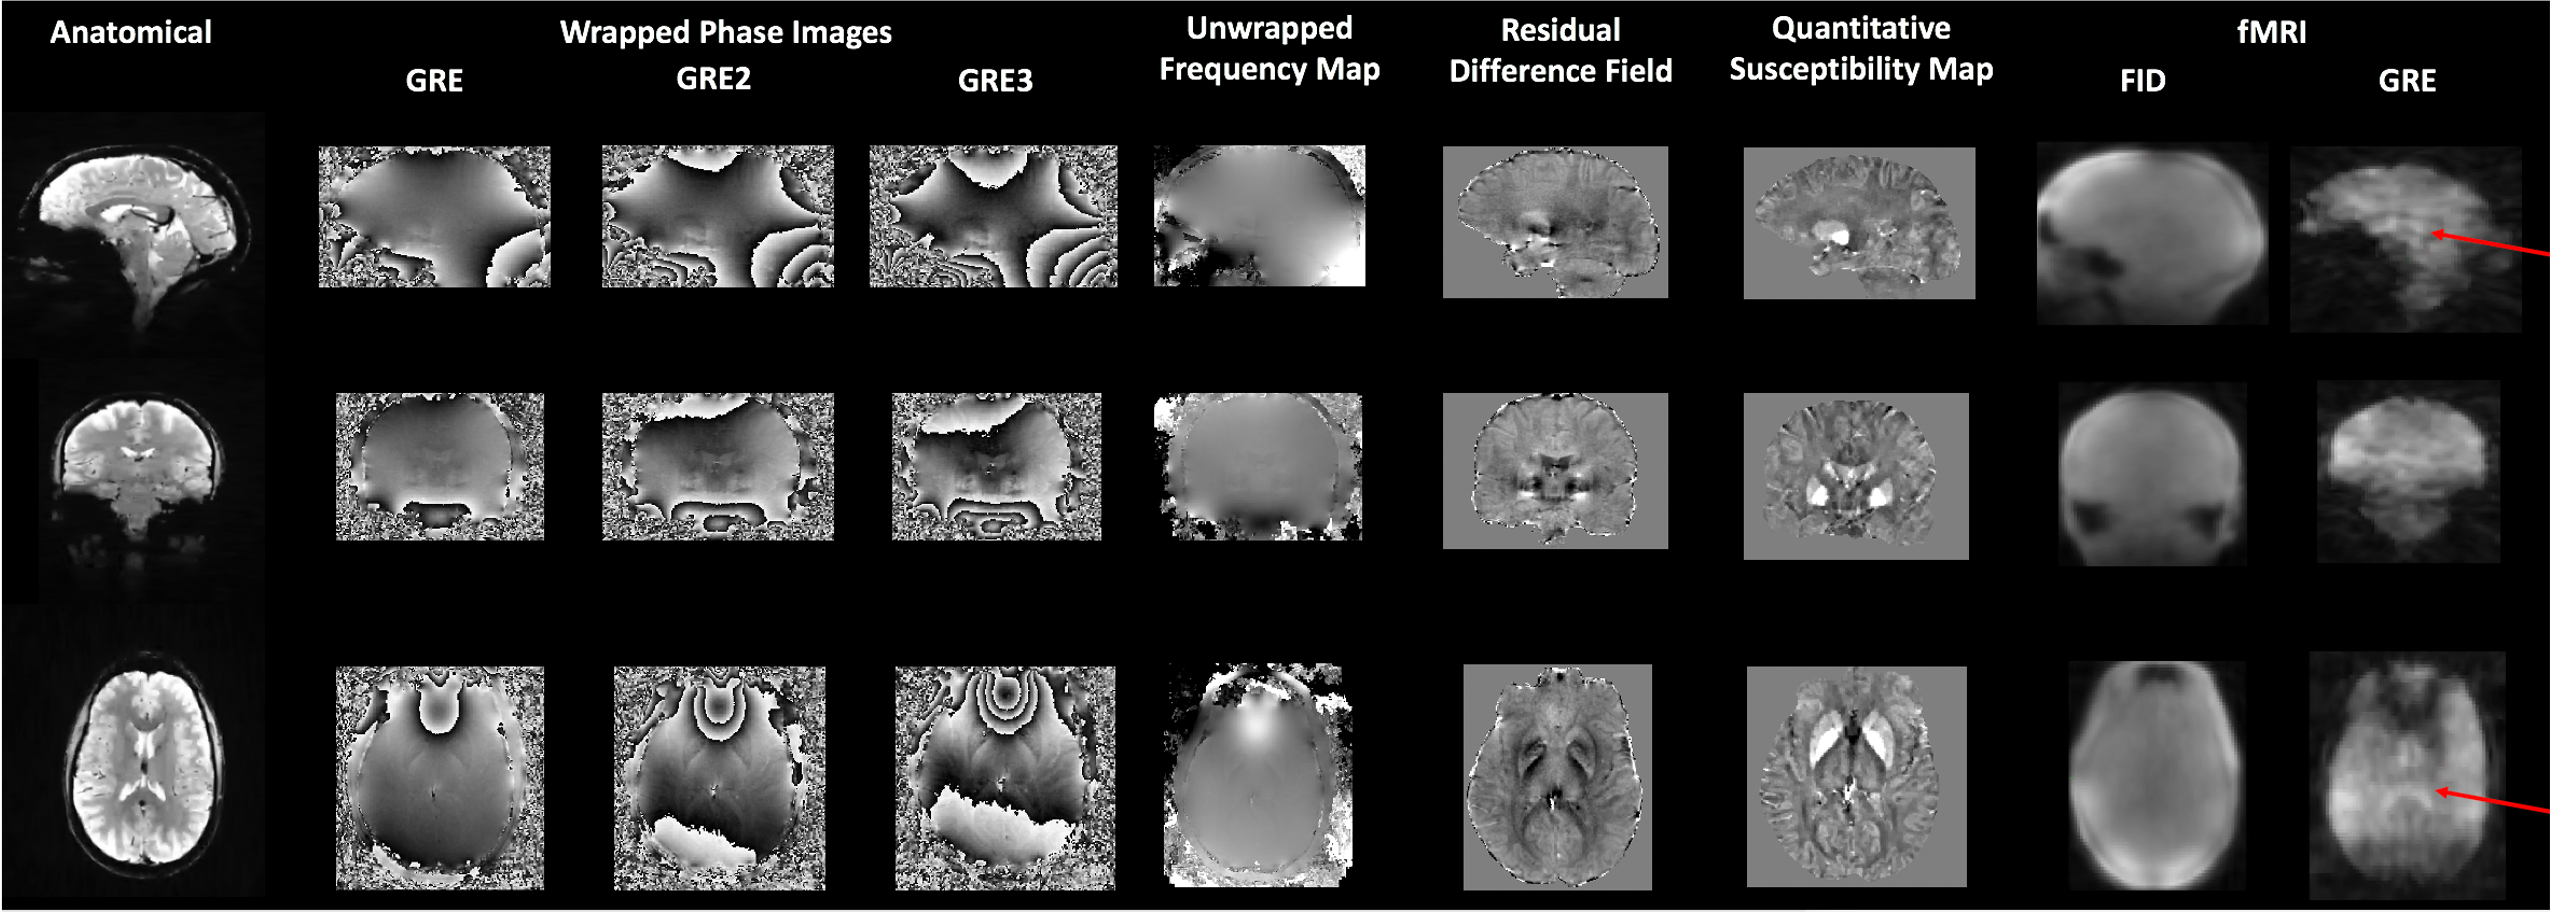
Figure 2: Output images from Looping Star acquisition techniques in a single participant. From left to right, the high resolution anatomical image, wrapped phase images, unwrapped frequency map, residual difference field, QSM maps and fMRI raw images are shown. Red arrows indicate clarity of ventricles in fMRI acquisition. QSM image range -0.1ppm to 0.1ppm.
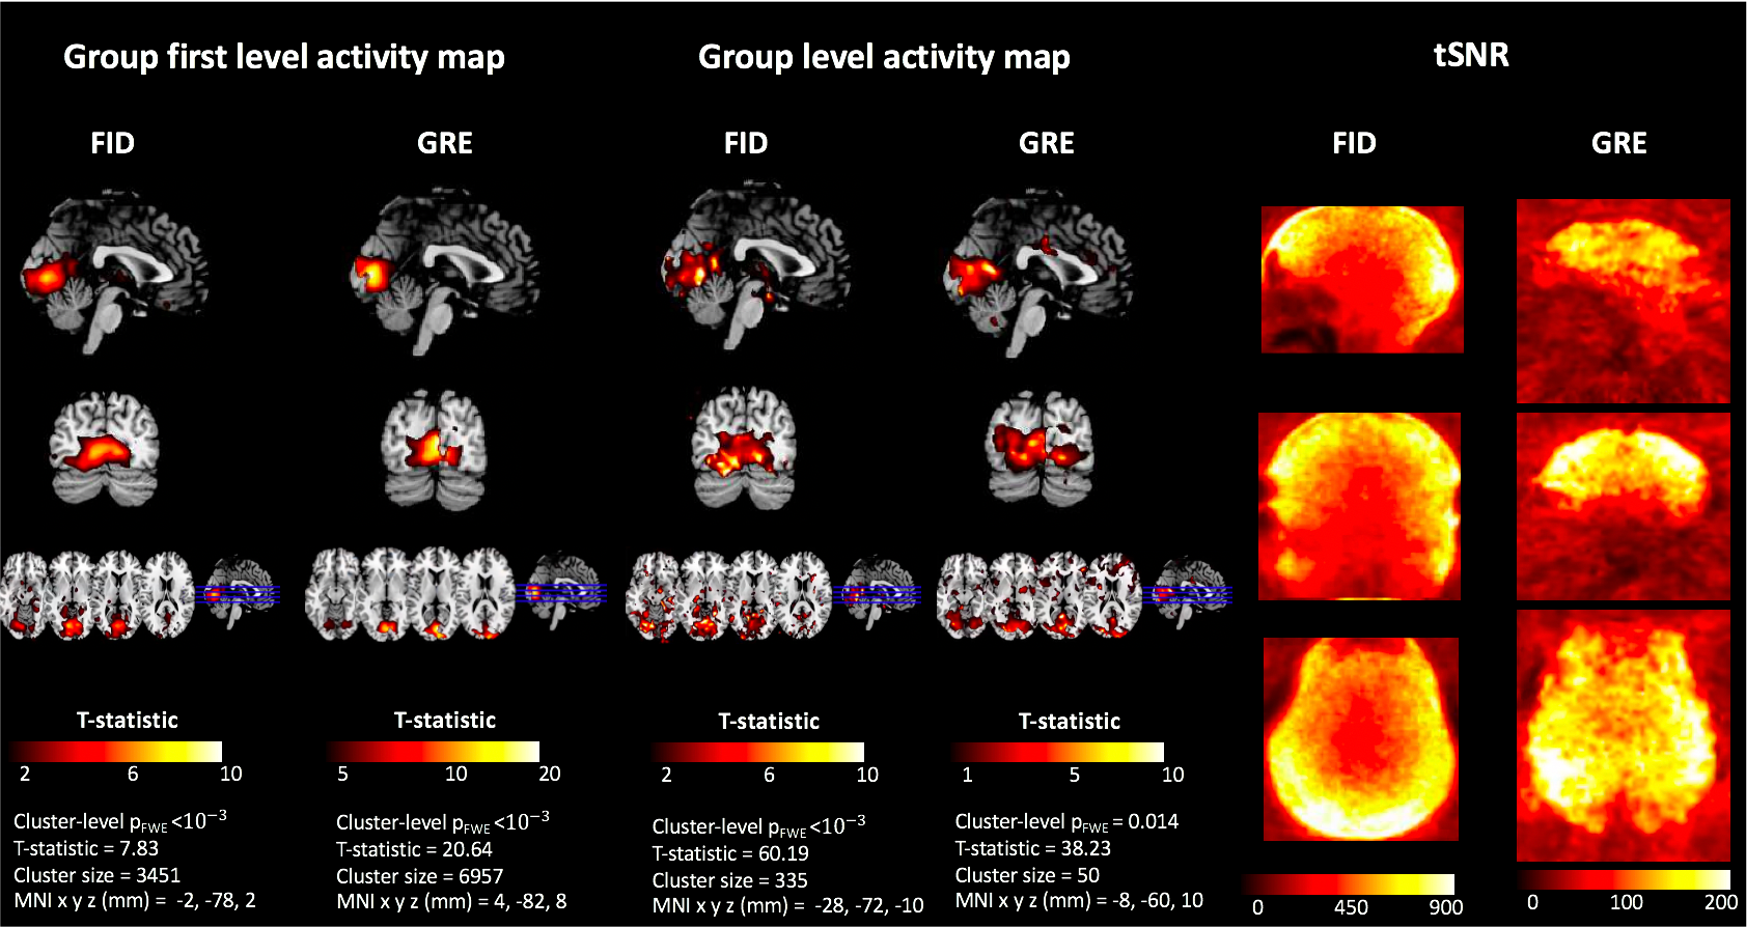
Figure 3: Output of fMRI analysis at group level and first level across participants for the FID and echo images. Significant (cluster level pFWE < 0.05) activity was identified in the visual cortex in both cases, with statistics listed below the figures. The tSNR maps of Looping Star are also illustrated on the right.