2673
A custom MR-compatible data glove for fMRI of the human motor cortex at 7T
Shota Hodono1,2, Donald Maillet1, Jin Jin2,3, David Reutens1,2, and Martijn A. Cloos1,2
1Centre for Advanced Imaging, The University of Queensland, Brisbane, Australia, 2ARC Training Centre for Innovation in Biomedical Imaging Technology, The University of Queensland, Brisbane, Australia, 3Siemens Healthcare Pty Ltd, Brisbane, Australia
1Centre for Advanced Imaging, The University of Queensland, Brisbane, Australia, 2ARC Training Centre for Innovation in Biomedical Imaging Technology, The University of Queensland, Brisbane, Australia, 3Siemens Healthcare Pty Ltd, Brisbane, Australia
Synopsis
We present a custom-built MR-compatible data glove to capture hand motion during concurrent fMRI experiments at 7
Introduction
Functional MRI at ultra high-field provides an elegant framework to study fine motor control1,2. However, it is often difficult to accurately monitor the subject’s hand motion during scanning. Therefore, even though the subject’s ability to follow instructions varies with attention and dexterity, the signal model used in the analysis commonly assumes a perfect task rendition. In this work, we present a custom-built MR-compatible data glove to capture hand motion with high spatiotemporal fidelity during concurrent fMRI experiments at 7 Tesla. In addition, we demonstrate that these measurements can be used to construct subject specific signal models for use in fMRI analysis.Methods
We built our data glove around a fire-retardant glove (OMP, Ronco Scrivia, Italy). Cotton pockets were stitched across the proximal interphalangeal joints, each holding a piezoresistive flex-sensor (SKU: SEN-1026). The sensors connect to a custom interface-board, holding fuses (TR5 372, 100 mA) and a non-magnetic RJ45 socket. The interface-board was mounted in a 3D-printed housing mounted on the back of the glove using Velcro. A Cat5/6 ethernet cable was used to carry the signals out of the magnet room through a custom-built filter panel. The other side of the filter was connected to an Arduino ZERO equipped with a custom interface shield. Each pair of twisted wires connects a single sensor to an ADC which quantifies the joint angle in terms of change in resistance in the sensor. The same interface also recorded the MR trigger signal for synchronization with the MR system. All the data are sent to a computer through a serial connection for real-time monitoring and storage.All components inside the magnet room were first screened for magnetic compatibility, and the complete assembly was checked for RF resonances around the proton frequency. A range of phantom measurements was performed to ensure safety. Most notably, thermal imaging was used to confirm that neither high SAR nor fast-switching sequences led to heating (15 min of diffusion-weighted SE-EPI at 100% SAR).
Two healthy volunteers were scanned (38 & 29 yo male). The study was approved by the local human research ethics committee in accordance with national guidelines, and written informed consent was obtained before the scan. SNR was assessed using the Kellmann method3. In addition, functional experiments were conducted4,5. Subject 1 was asked to make periodic flexing fingers motion (left hand only), subject 2 was asked to maintain isotonic extension for ~5sec before returning back to a comfortable rest position (left hand only). No visual cues were used to guide the timing of subjects’ hand movements, and appropriate fMRI signal models were directly derived from the motion measurements by thresholding the first order derivatives (Savitzky-Golay filter) of the joint angle with respect to time (Fig. 4a). Slice timing and motion correction were performed using SPM12 (Functional Imaging Laboratory, University College London, UK), and the GLM analysis was performed using FSL without spatial smoothing or clustering6.
All MR experiments were performed at 7 Tesla research system (Siemens Healthcare, Erlangen, Germany) using a 32-channel head coil (Nova Medical, Wilmington, USA).
Results & Discussion
In vitro B1 maps and SNRs with and without the data glove showed less than 5% change. Figure 2c-d shows the thermal images obtained pre- and post- high power fast switching. Temperature changes on the data glove and the cable remained below 2°C.No degradation in SNR was observed in the MR images (Fig. 3) and clean kinematic recordings (sampling rate ~15Hz per finger) were obtained (Fig. 4, 5e). Based on the recorded motion, five different motion states could be identified; (i) flexing, (ii) extending joints, (iii) sustained isotonic extension, (iv) sustained isotonic flexion, and (v) rest (Fig. 4, 5e).
Figure 5a shows the activation maps from subject 1, generated using our subject-specific signal models. All of the signal models clearly localize the left hand area on motor cortex (Fig. 5abc). Looking at the signal time series in these voxels, the signal model derived from flexing and extending motions only, showed a reduced amplitude during the first segment in which the fingers maintained isotonic extension for ~2s before flexing (Fig. 5d red). This suggests that holding the maintained isotonic extension significantly contributes to the observed BOLD signal.
Figure 5e shows recorded hand motion, the signal models, and the mean signal time series calculated within motor cortex with Z>5, from subject 2 performing a prolonged sustained isotonic flexion (~5sec). The measured BOLD response indeed correlates best with a model that treats the sustained isotonic extension motion states as an active state (Fig. 5e green).
In general, specific motor tasks and their associated rate of neuronal activation can have a non-trivial relation which can be further obscured by the hemodynamic response7. Iterative modeling of the signal based on precise motion measurement could provide a path forward to study these dynamics in more detail.
Conclusion
We presented custom built MR-compatible data glove to measure hand motion during concurrent fMRI of the human motor cortex at 7 Tesla without degradation of image quality. The ability to evaluate subject performance in real-time and create subject-specific BOLD signal models enables a wide range of experimental paradigms with improved data quality.Acknowledgements
This work was supported by ARC Future fellowship grant FT200100329; “Platform technology to decode motor control through ultra high-field MR”. The authors acknowledge the facilities of the National Imaging Facility at the Centre for Advanced Imaging, and thank Aiman Al-Najjar and Nicole Atcheson for their support during the experiments, and Ewald Weber for the use lending us his thermal camera.References
- Huber L, Handwerker DA, Jangraw DC, Chen G, Hall A, Stüber C, Gonzalez-Castillo J, Ivanov D, Marrett S, Guidi M, Goense J, Poser BA, Bandettini PA. High-Resolution CBV-fMRI Allows Mapping of Laminar Activity and Connectivity of Cortical Input and Output in Human M1. Neuron. 2017 Dec 20;96(6).
- Huber L, Finn ES, Handwerker DA, Bönstrup M, Glen DR, Kashyap S, Ivanov D, Petridou N, Marrett S, Goense J, Poser BA, Bandettini PA. Sub-millimeter fMRI reveals multiple topographical digit representations that form action maps in human motor cortex. Neuroimage. 2020 Mar;208:116463.
- Kellman P, McVeigh ER. Image reconstruction in SNR units: a general method for SNR measurement. Magn Reson Med. 2005 Dec;54(6):1439-47. doi: 10.1002/mrm.20713. Erratum in: Magn Reson Med. 2007 Jul;58(1):211-2.
- Moeller S, Yacoub E, Olman CA, Auerbach E, Strupp J, Harel N, Uğurbil K. Multiband multislice GE-EPI at 7 tesla, with 16-fold acceleration using partial parallel imaging with application to high spatial and temporal whole-brain fMRI. Magn Reson Med. 2010 May;63(5):1144-53.
- Larkman DJ, Hajnal JV, Herlihy AH, Coutts GA, Young IR, Ehnholm G. Use of multicoil arrays for separation of signal from multiple slices simultaneously excited. J Magn Reson Imaging 2001;13: 313–36.
- K.J. Worsley. Statistical analysis of activation images. Ch 14, in Functional MRI: An Introduction to Methods, eds. P. Jezzard, P.M. Matthews and S.M. Smith. OUP, 2001.
- Siero JC, Hermes D, Hoogduin H, Luijten PR, Petridou N, Ramsey NF. BOLD consistently matches electrophysiology in human sensorimotor cortex at increasing movement rates: a combined 7T fMRI and ECoG study on neurovascular coupling. J Cereb Blood Flow Metab. 2013 Sep;33(9):1448-56.
Figures
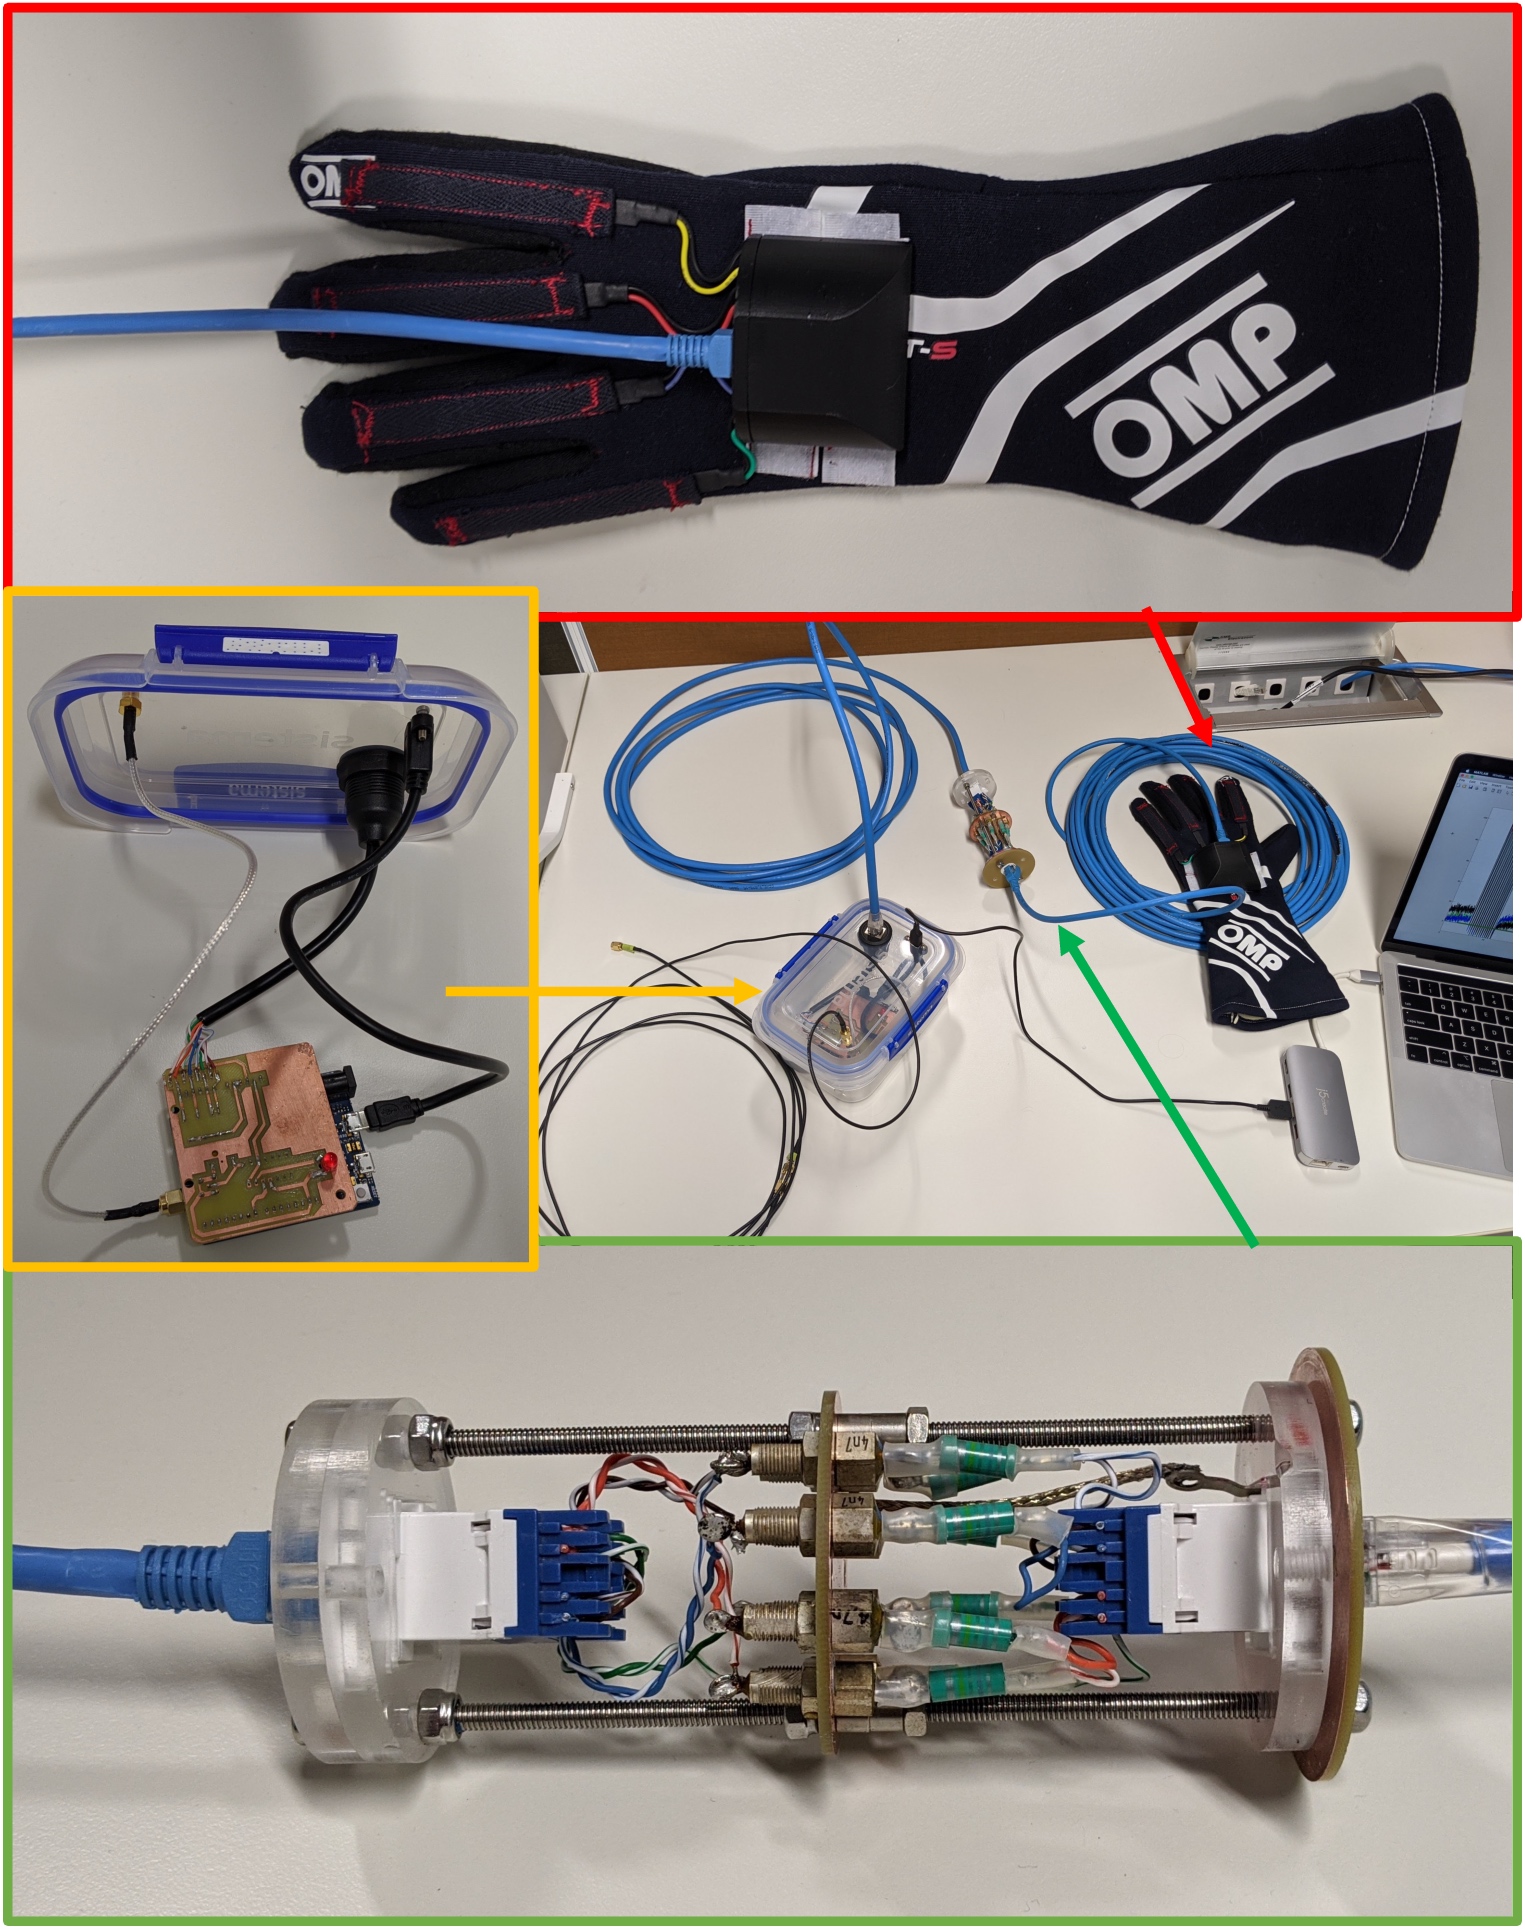
Our custom data glove setup. Red, yellow, and green arrows point at the data glove, container holding the interface assembly, and the custom-built filter respectively. The filter is placed in the waveguide tube between MR cosole room and MR scanner room. These components were connected through Cat5/6 cables. In addition, the interface box receives the MR trigger signal through an SMA connection.
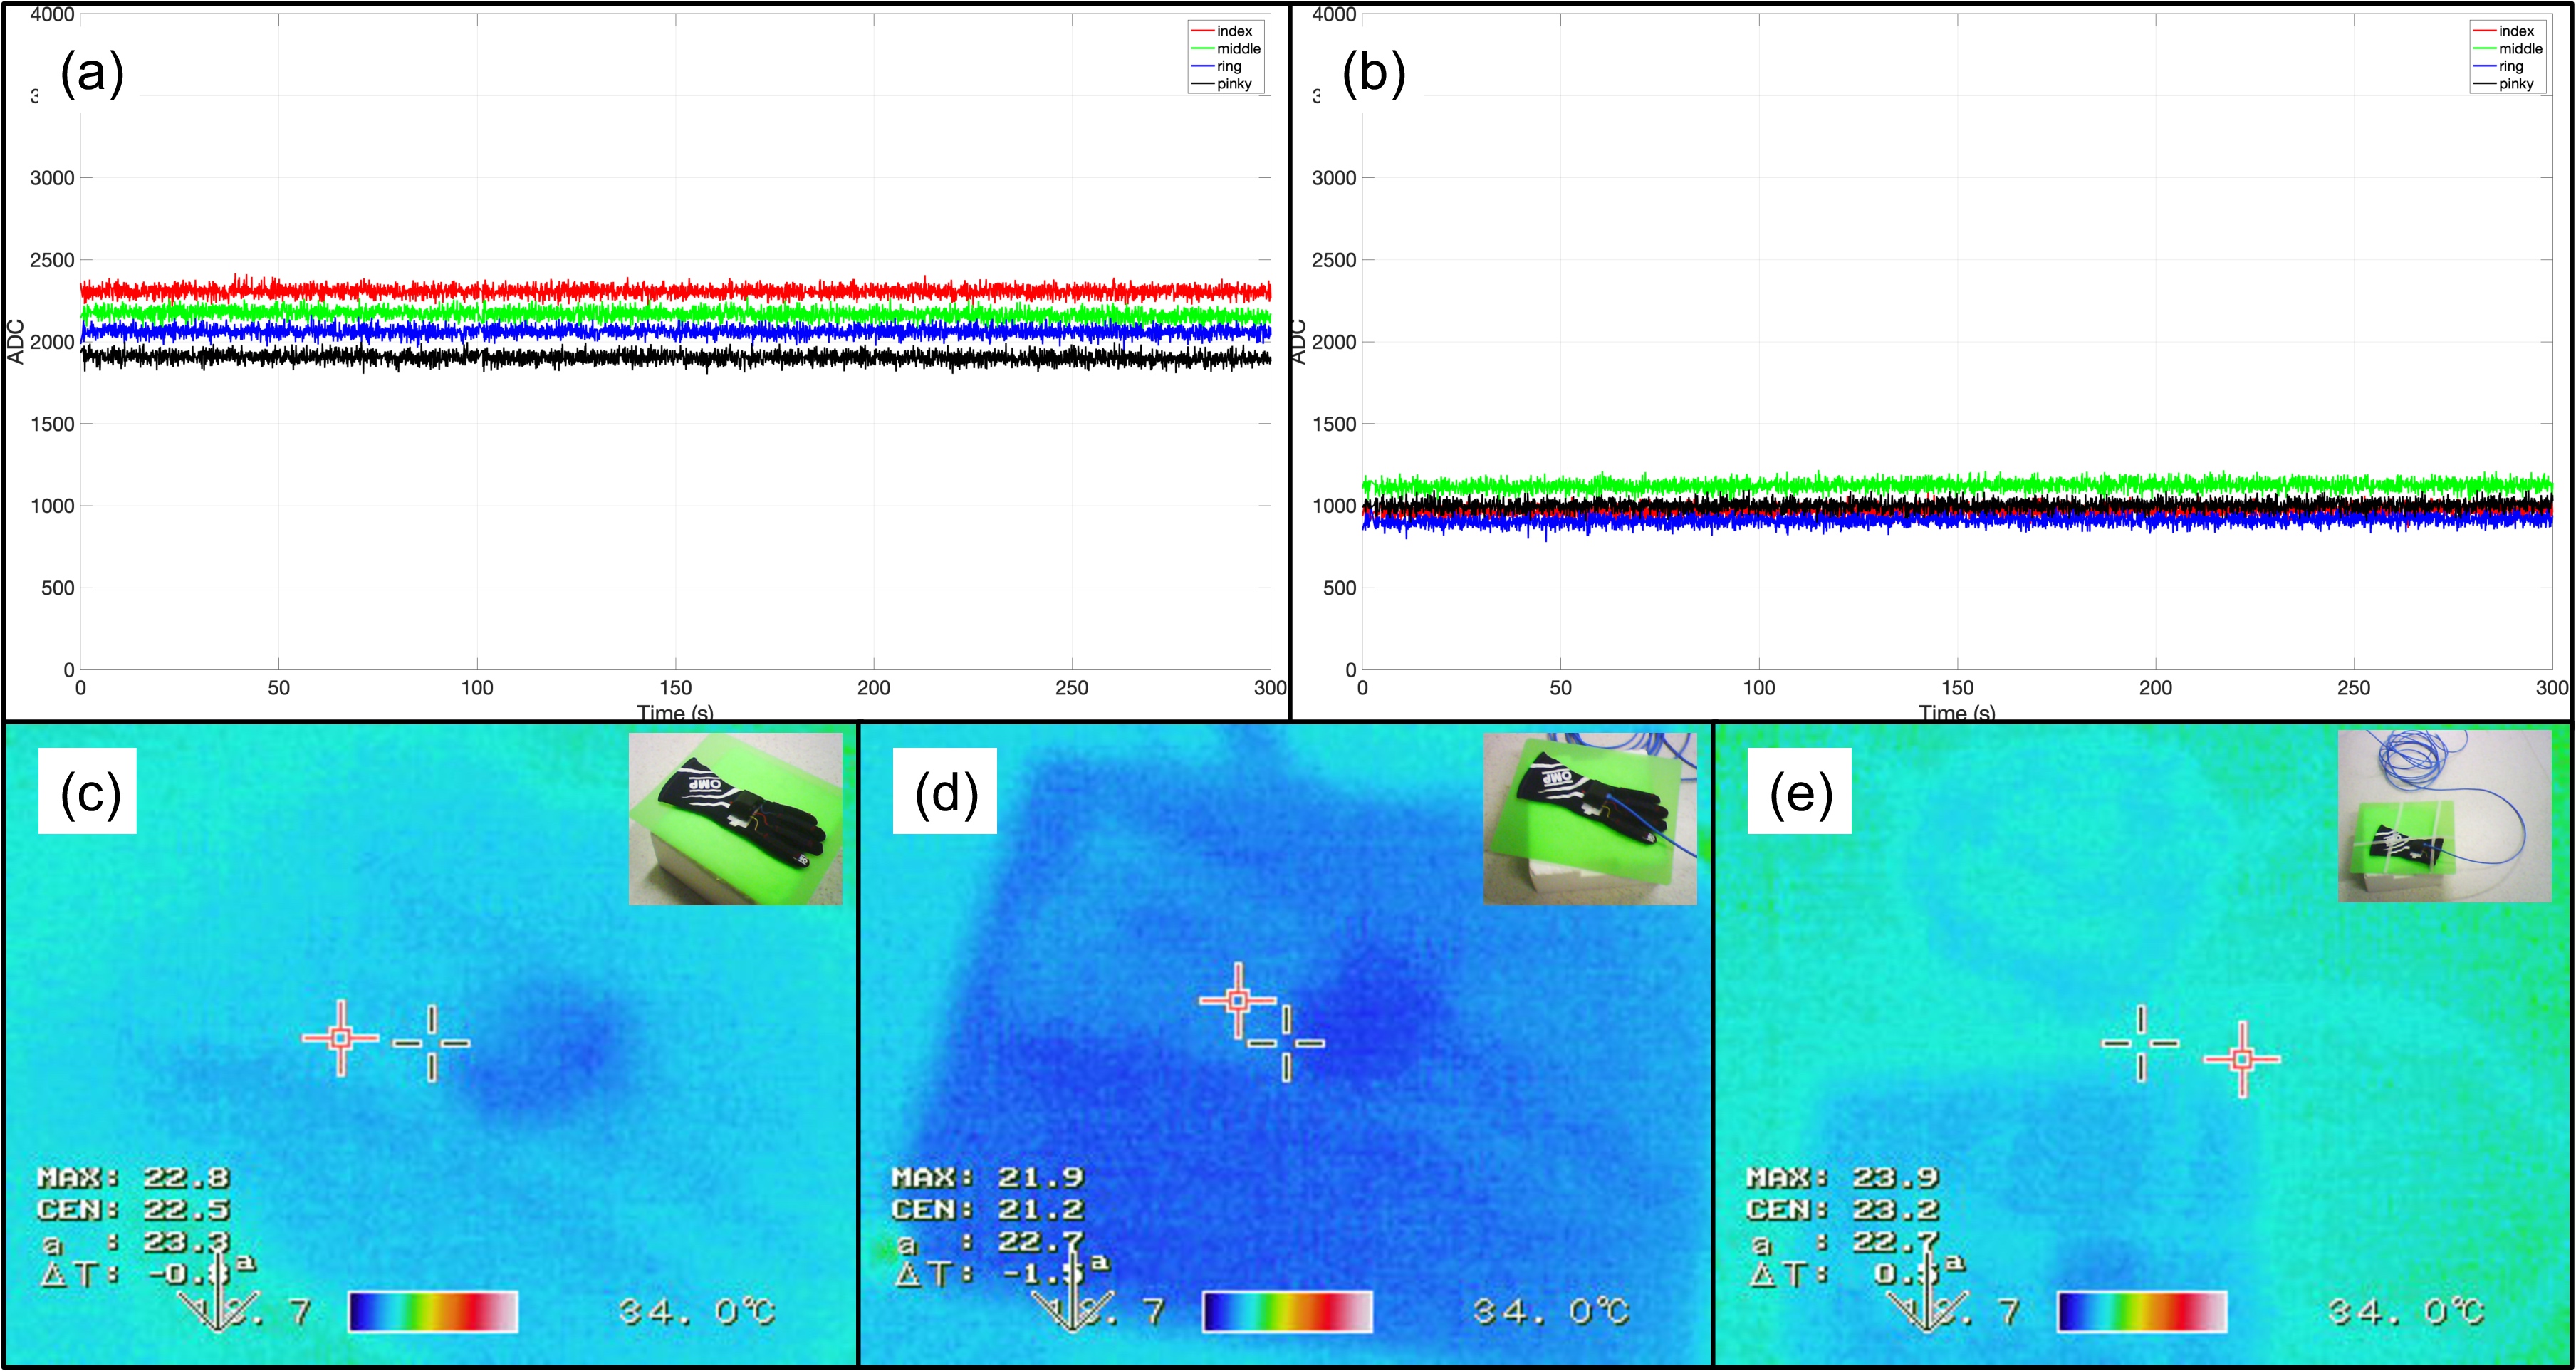
All safety tests were performed with two different positions. Once with the sensors on the data glove straight and once with the sensors in a bend condition. Panels (a) and (b) show sensor measurements during a 100% SAR Diffusion EPI sequence in the straight and bend position, respectively. Motion measurements showed no sign of artifacts from the fast-switching gradients or RF pulses. Panels (c), (d), and (e) show thermal images, before scan, after the scan with straight sensors, and after the scan with bend sensors, respectively. No significant temperature changes were observed.
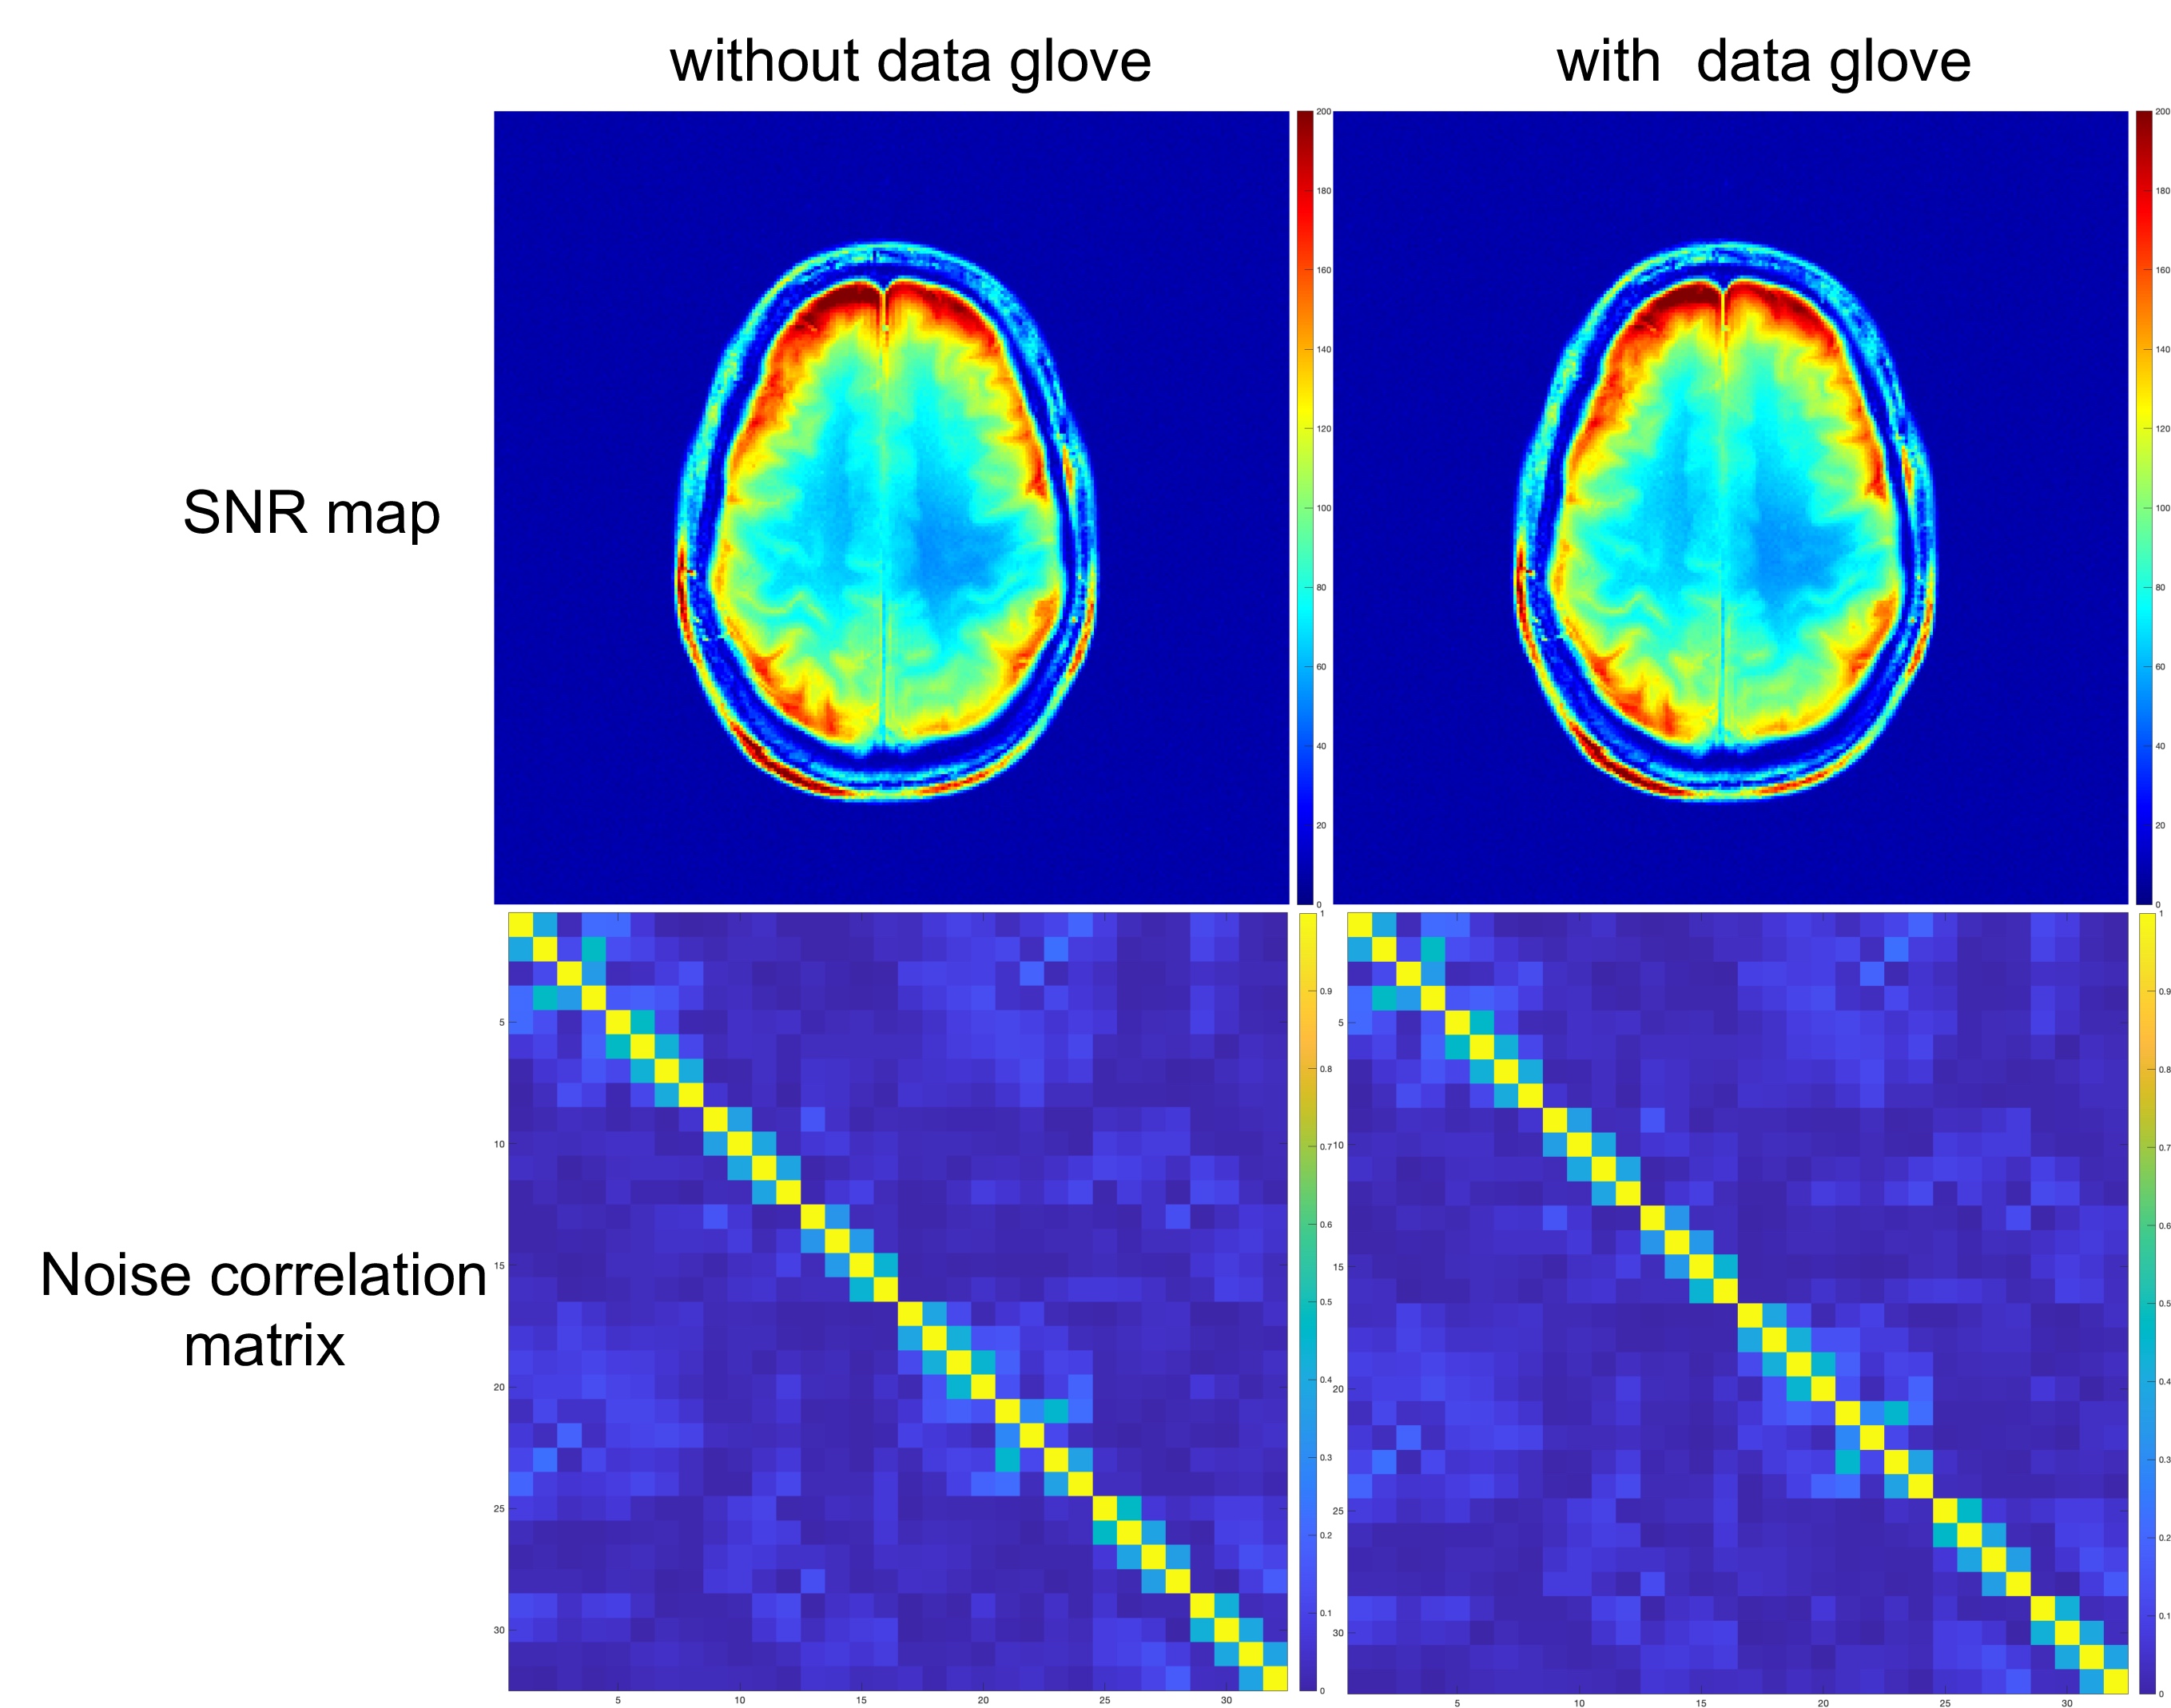
SNR maps and noise correlation matrix with and without data glove.
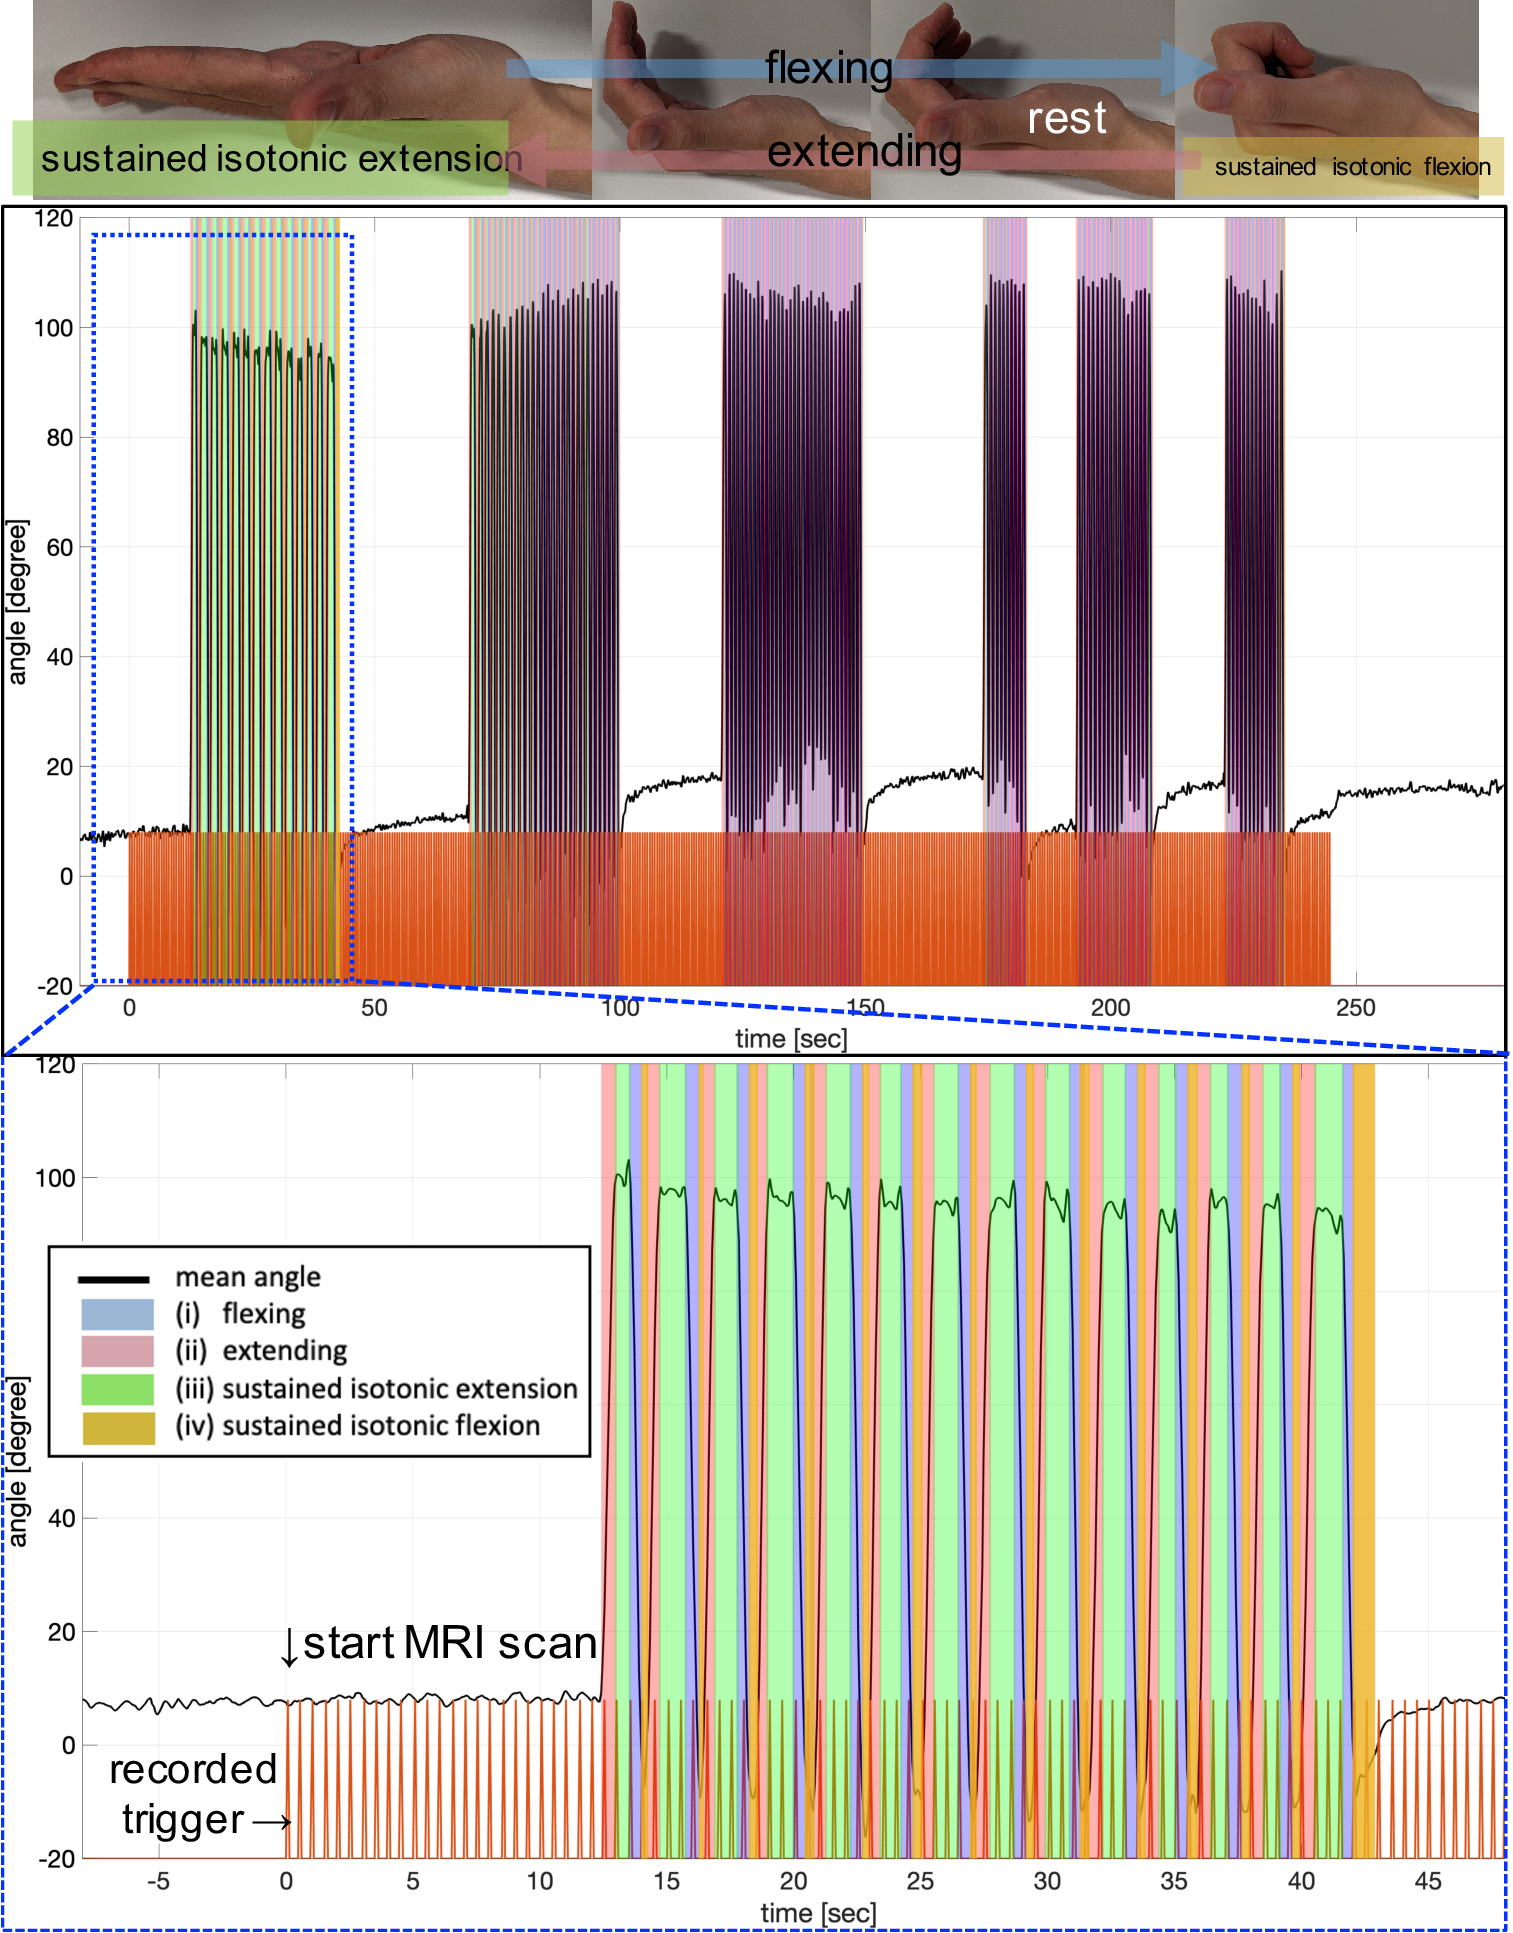
Recorded hand motion during an fMRI scan. The bottom figure shows a zoomed view of the first section. Different motion states are highlighted in the figures. The trigger signal from the MR system is also shown in the figure (orange line).
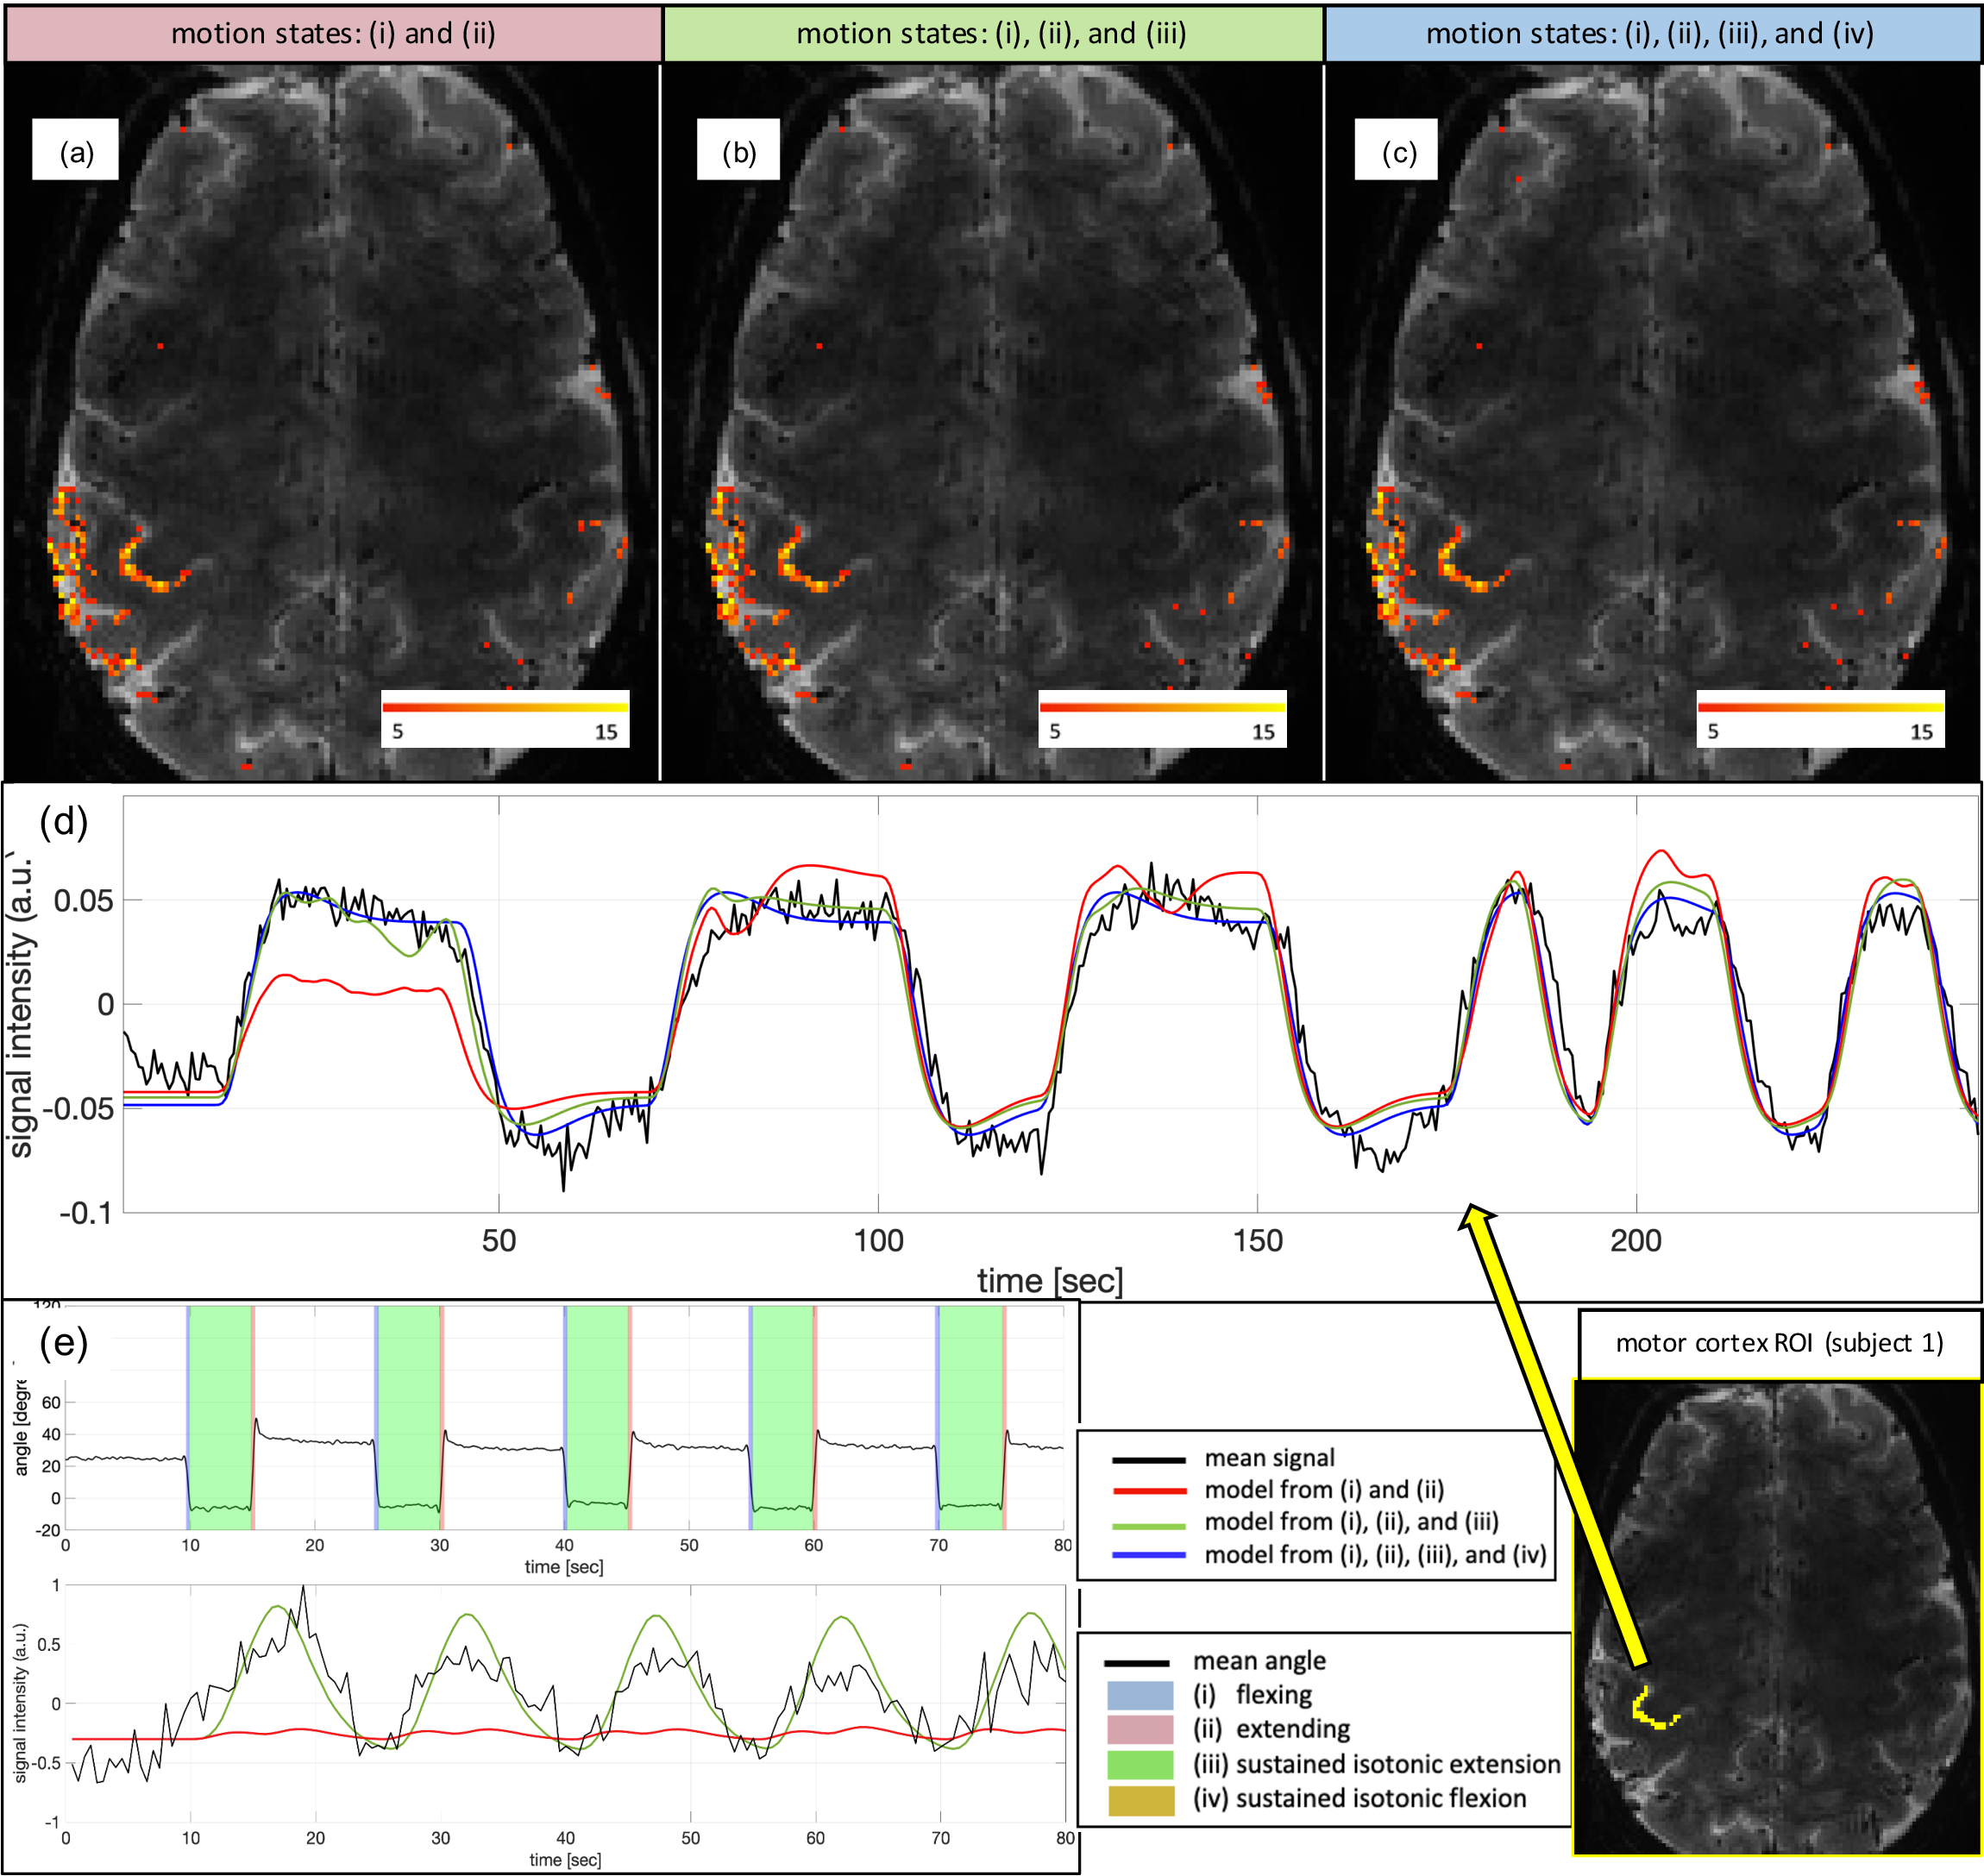
Activation map of subject 1 obtained by GLM using motion states (a) (i) and (ii), (b) (i), (ii) and (iii), (c) (i), (ii), (iii) and (iv). 2d GRE-EPI sequence was used with following parameters; TR = 0.5sec, TE = 24.6ms, flip-angle = 40°, 1.1mm isotropic resolution, 18 slices, 143mm x 143mm FOV, GRAPPA = 3, MB = 2, 490 TRs. (d) Signal time series and model predictions of subject 1. (e) Recorded hand motion, signal timeseries and model predictions of subject 2. The mean signal time series calculated within motor cortex with Z>5. The figure legend on the bottom right applies for both (d) and (e).