2672
Differentiation between cardiac amyloidosis and hypertrophic cardiomyopathy by texture analysis of T2-weighted CMR imaging1Radiology, West China Hospital, Chengdu, China, 2Radiology, West China Second University Hospital, Chengdu, China
Synopsis
We retrospectively included 100 cardiac amyloidosis (CA) and 217 hypertrophic cardiomyopathy (HCM) patients, aiming to elucidate the value of texture analysis (TA) in non-contrast T2-weighted CMR images of these patients. After the texture features were extracted, machine learning algorithms were used to select the optimal features. The results showed that TA was feasible and reproducible for detecting myocardial tissue alterations and differentiating CA from HCM, even in patients with similar hypertrophy. The radiomics model achieved a comparable diagnostic capacity to late gadolinium enhancement (LGE). Thus, TA might help eliminate the use of contrast agent in the diagnosis of these patients.
Introduction
Cardiac amyloidosis (CA) is a progressive and infiltrative cardiomyopathy with poor prognosis1. In certain clinical scenarios, it can still be a challenge to differentiate CA from hypertrophic cardiomyopathy (HCM), especially in patients contraindicated to gadolinium contrast agent 2. However, CA patients frequently suffer from impaired renal function, either due to amyloid deposition in the kidneys or reduced cardiac output from heart failure (HF). We hypothesized that texture features extracted from routinely acquired non-contrast T2-weighted cardiac magnetic resonance images (CMR) could provide great performance in differentiating CA and HCM.Methods
In this retrospective study, 100 CA (58.5±10.7 years; 41 (41%) females) and 217 HCM (50.7±14.8 years, 101 (46.5%) females) patients who underwent CMR scans were included. Texture analysis was performed on non-contrast T2-weighted CMR scans using 3D Slicer based on the Pyradiomics library3. Regions of interest were delineated by two radiologists independently on non-contrast T2-weighted imaging (T2WI). Stepwise dimension reduction and texture feature selection based on reproducibility4, machine learning algorithms5,6, and correlation analyses7 were performed to select features. Both the CA and HCM groups were randomly divided into a training dataset and a testing dataset (7:3). After the TA model was established in the training set, the diagnostic performance of the model was validated in the testing set and further validated in a subgroup of patients with similar hypertrophy matched by LV mass index as well as age, sex and maximum wall thickness (MWT). Statistical analysis during the construction of the radiomics signature was performed in R (version 4.0.1; R Foundation for Statistical Computing, Vienna, Austria)8 with RStudio (version 1.3.959; RStudio, Boston, Mass)9. Other statistical analyses were conducted with SPSS (Version 19; IBM, Armonk, NY).Results
Demographic and clinical characteristics of the included subjects were presented in Table 1. In total, 837 texture features were initially extracted. The multistep texture feature selection and dimension reduction process (Figure 1) resulted 7 most important and independent texture features used for model fitting (Figure 2). TA model of the 7 selected features provided a diagnostic accuracy of 86.0% (AUC=0.915; 95% CI: 0.879-0.951) in the training dataset and 79.2% (AUC=0.842; 95% CI: 0.759-0.924) in the testing dataset (Figure 3). The differential diagnostic accuracy in the similar hypertrophy subgroup was 82.2% (AUC=0.864, 95% CI: 0.805-0.922) (Table 2). The significance of the difference between the AUCs of the TA model and late gadolinium enhancement (LGE) was verified by Delong’s test (p=0.996). All seven texture features showed significant differences between CA and HCM (all p<0.001).Discussion
Texture analysis is a postprocessing method to identify subtle tissue alterations and can be applied to standard and routinely acquired clinical CMR sequences. It comprehensively and elaboratively analyze the spatial distributions of pixel gray levels in images, which further derives substantial quantitative texture features characterizing the underlying tissue texture10. The selected texture features of CA in our study suggested that CA had finer textural texture than HCM on T2WI. And the HCM group showed coarser texture. The possible reason for this might be correlated with the more pronounced myocardial edema present in CA11. The coarse texture of HCM might reflect tissue inhomogeneity, such as myocardial disarray and fibrosis. Thus, TA seemed to be a useful quantitative tool for the identification of tissue alterations.Texture features in combination with robust mathematical models could represent reliable diagnostic tools12. Our study demonstrated that the optimal combination of texture features had an accuracy of 86% for differentiating between CA and HCM. Because HCM often shows extremely and heterogeneously increased wall thickness. We further validated the diagnostic capacity of the TA model in patients with similar hypertrophy matched by LV mass index. This subgroup analysis showed that the TA model still had a great discriminative capacity with high sensitivity and specificity for CA and HCM.
LGE is of great value in the diagnosis and differentiation of CA and HCM in clinical setting. However, the required administration of a gadolinium agent has limited some patients from undergoing this examination. In our study, the TA model constructed with texture features extracted from non-contrast T2WI achieved a comparable result to LGE in discriminating CA from HCM. Thus, TA of T2WI might help eliminate the need for contrast agent administration in these patients.
Conclusion
Our study demonstrated that texture analysis based on non-contrast T2-weighted images could feasibly differentiate CA from HCM, even in patients with similar hypertrophy. The selected final texture features could achieve a comparable diagnostic capacity to LGE.Acknowledgements
No acknowledgement found.References
1. Falk Rodney H. Diagnosis and management of the cardiac amyloidoses. Circulation. 2005;112(13):2047.
2. Thibaud, Damy, Bruno, et al. Prevalence and clinical phenotype of hereditary transthyretin amyloid cardiomyopathy in patients with increased left ventricular wall thickness. Eur Heart J. Published online 2016.
3. van Griethuysen JJM, Fedorov A, Parmar C, et al. Computational Radiomics System to Decode the Radiographic Phenotype. Cancer Res. 2017;77(21):e104-e107. doi:10.1158/0008-5472.CAN-17-0339
4. Khan JN, Singh A, Nazir SA, Kanagala P, Gershlick AH, Mccann GP. Comparison of cardiovascular magnetic resonance feature tracking and tagging for the assessment of left ventricular systolic strain in acute myocardial infarction. Eur J Radiol. 2015;84(5):840-848.
5. Kursa MB, Rudnicki WR. A deceiving charm of feature selection: The microarray case study. In: Man-Machine Interactions 2. Springer; 2011:145–152.
6. Tibshirani R. Regression shrinkage and selection via the lasso: a retrospective. J R Statal Soc Ser B Statal Methodol. 2011;73(3).
7. Kuhn M. Caret: classification and regression training. ascl. Published online 2015:ascl–1505.
8. Team RC, others. R: A Language and Environment for Statistical Computing. Vienna, Austria; 2013.
9. Team Rs, others. RStudio: integrated development for R. RStudio Inc Boston MA URL Httpwww Rstudio Com. 2015;42:14.
10. Cendes GCastellanolBonilhalMLif. Texture analysis of medical images. Clin Radiol. Published online 2004.
11. Kotecha T, Martinez-Naharro A, Treibel TA, et al. Myocardial Edema and Prognosis in Amyloidosis. J Am Coll Cardiol. 2018;71(25):2919-2931. doi:10.1016/j.jacc.2018.03.536
12. Wang S, Summers RM. Machine learning and radiology. Med Image Anal. 2012;16(5):933-951.
Figures
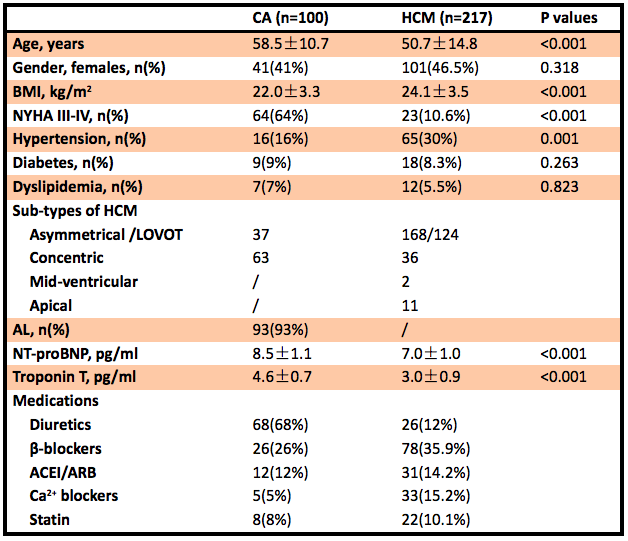
Table 1 Demographic and clinical characteristics of the included subjects.
CA: cardiac amyloidosis; HCM: hypertrophic cardiomyopathy; AL: light-chain amyloidosis.
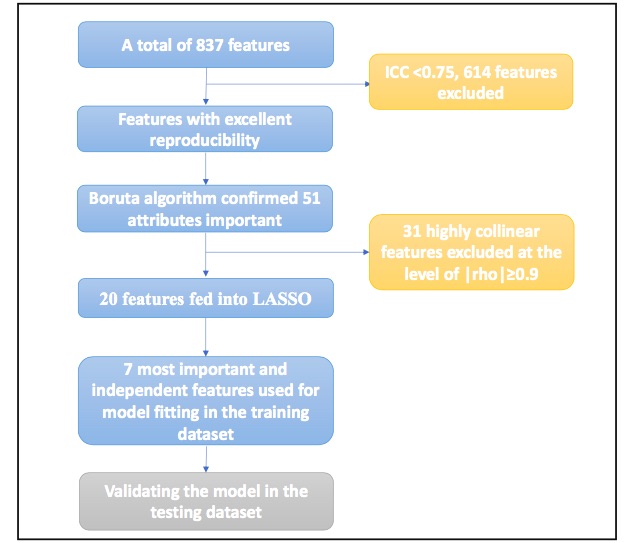
Figure1 Feature selection and dimension reduction process.
ICC: intraclass correlation coefficient, LASSO: the least absolute shrinkage and selection operator.
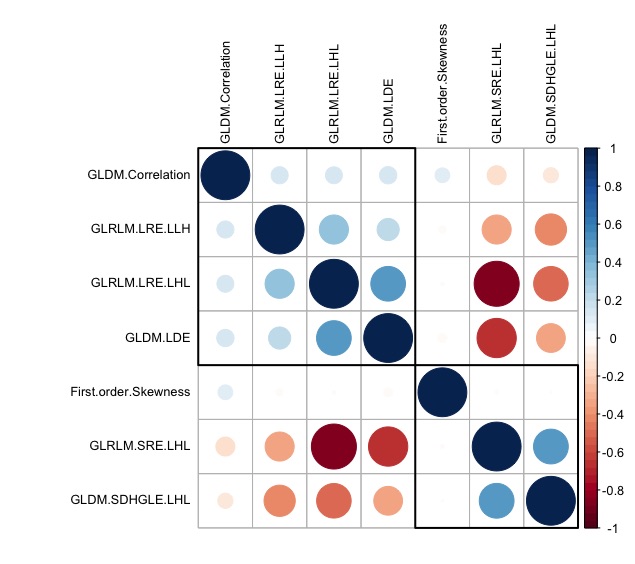
Figure 2 Correlogram of the relationship among the selected texture features.
Smaller and/or lighter circles represent lower correlation. On the contrary, larger and/or darker circles indicate higher correlation. GLRLM: gray level run length matrix, GLDM: gray level dependence matrix, GLCM: gray level co-occurrence matrix; LRE: Long Run Emphasis; SRE: Short Run Emphasis; SDHGLE: Small Dependence High Gray Level Emphasis; LDE: Large Dependence Emphasis; H: high wavelet filter; L: low wavelet filter
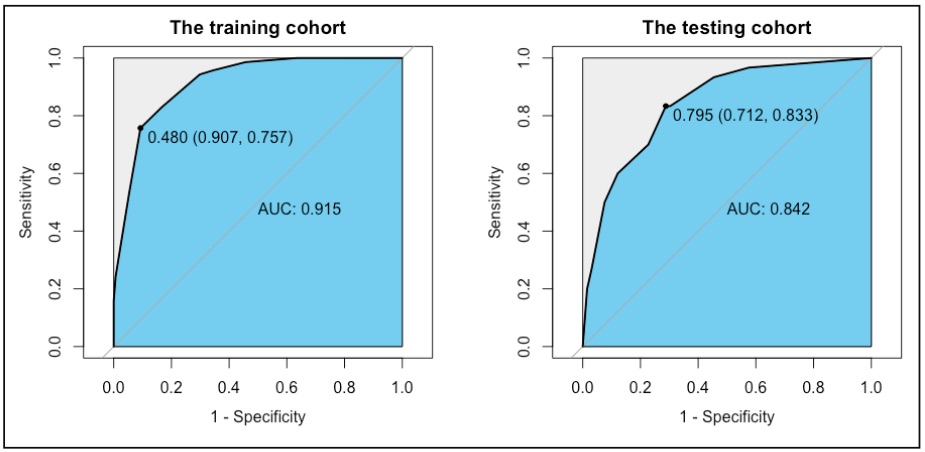
Figure 3 Receiver operating characteristic curves (ROC) for the radiomics model in differentiating cardiac amyloidosis (CA) from hypertrophic cardiomyopathy (HCM) in the training and testing cohorts.
AUC: area under the ROC curve.
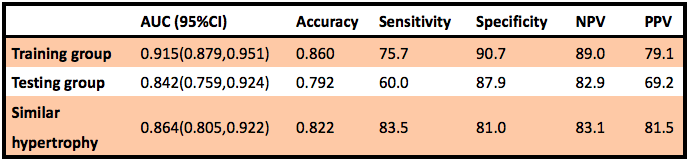
Table 2 Diagnostic capacity of the selected tissue features for discriminating CA and HCM.
AUC: the area under the curve, PPV: positive predictive value, NPV: negative predictive value