2671
Cardiac metabolism assessed by MR Spectroscopy to classify the diabetic and obese heart: a Random Forest and Bayesian network study
Ina Hanninger1, Eylem Levelt2,3, Jennifer J Rayner2, Christopher T Rodgers2,4, Stefan Neubauer2, Vicente Grau1, Oliver J Rider2, and Ladislav Valkovic2,5
1Oxford Institute of Biomedical Engineering, Oxford, United Kingdom, 2Radcliffe Department of Medicine, University of Oxford Centre for Clinical Magnetic Resonance Research, Oxford, United Kingdom, 3University of Leeds, Leeds, United Kingdom, 4Wolfson Brain Imaging Centre, Cambridge, United Kingdom, 5Slovak Academy of Sciences, Institute of Measurement Science, Bratislava, Slovakia
1Oxford Institute of Biomedical Engineering, Oxford, United Kingdom, 2Radcliffe Department of Medicine, University of Oxford Centre for Clinical Magnetic Resonance Research, Oxford, United Kingdom, 3University of Leeds, Leeds, United Kingdom, 4Wolfson Brain Imaging Centre, Cambridge, United Kingdom, 5Slovak Academy of Sciences, Institute of Measurement Science, Bratislava, Slovakia
Synopsis
In this study, Random Forest classification was used on data from 197 subjects to discriminate between non-diabetic, diabetic, and obese patients using 31P-MRS and 1H-MRS measurements of cardiac energetics, along with MRI measures of cardiac function. Achieving 91.67%, 73.08% and 88.89% test accuracies, SHAP feature importances indicate a higher predictive impact of metabolic metrics for classifying the diabetic heart compared to global function metrics. Bayesian networks generated through structure learning of the data further suggests a potential causal association of increased visceral fat, increased LVMass resulting in decreased PCr/ATP, and increased cardiac lipid levels attributed to these disease states.
Purpose
With the rapid global increase in obesity and type II diabetes mellitus (T2DM), and given its relationship with heart failure, furthering our understanding of the associated cardiovascular remodeling and metabolic changes is becoming increasingly important. Besides structural and functional changes, e.g. in left ventricle (LV) mass and ejection fraction (EF), the metabolism of the heart is also affected by obesity and T2DM 1. Increased myocardial lipid accumulation and lipotoxicity can be non-invasively assessed using proton (1H)-MRS, and decreased phosphocreatine to adenosine-triphosphate ratio (PCr/ATP) -- which indicates disruptions to the creatine kinase reaction in the heart -- can similarly be assessed with phosphorus (31P)-MRS 2. However, the mechanism behind these pathologies is not fully understood.As a novel way to draw inferences from medical data, machine learning techniques -- as compared to traditional statistical analysis -- are particularly useful for finding generalizable predictive patterns in data where there is a large number of input variables and limited data points 3.We have therefore explored the feasibility of Random Forests to discriminate between non-diabetic, diabetic, and obese patients using metabolic MRS data; of SHAP (SHapley Additive exPlanation) values to compare the relative predictive impact of these metrics; and of Bayesian networks to provide further insight into the pathophysiology of these disease states.
Method
Over the last 5 years, 197 participants (74 healthy BMI<30, 55 obese (BMI>30) non-diabetic, 68 diabetic) were enrolled in our institute for CMRS scanning at 3T to acquire measurements of PCr/ATP and cardiac lipid content. This data was collected along with stroke volume (SV), LVMass, LVEF, visceral fat, cholesterol, BMI, age, sex, systolic blood pressure (SBP), diastolic BP (DBP), blood glucose and cholesterol measures. The mean and standard deviation for each variable by subgroup is summarised in Table 1.A Random Forest classifier was trained with a stratified test-train split of 25-75 on these datasets (omitting definitional variables like glucose or BMI), to differentiate between 3 pairs of subgroups: healthy vs obese patients, healthy vs T2D patients, and obese non-diabetic vs obese diabetic patients with BMI>30 (n=28). Entropy was used as the impurity measure on 500 estimators with a max tree depth of 4, implemented using the Sklearn Python library. Once the models were trained, SHAP values were computed and plotted to rank the relative contributions of each feature to the classification. As a way to infer causal relations between features via probabilistic conditional dependence, Bayesian networks were generated via the NOTEARS structure learning algorithm4 using the Causalnex library with minor optimization constraints.
Results and Discussion
The hold-out test accuracy, cross validated (CV) test accuracy, and area under curve (AUC) scores for each Random Forest classification are summarised in Table 2. Figure 1(a,b) depicts the SHAP value plots for the Random Forest discrimination between healthy vs obese, and healthy vs T2D patients. Omitting adiposity measures, cardiac metabolism parameters (having low PCr/ATP and high cardiac lipids) are the top two discriminators for obesity, followed by SBP, blood glucose and cholesterol in decreasing order. Between healthy and T2D, the highest importance features besides age and BMI were visceral fat mass, SV, and again, cardiac lipid content and PCr/ATP. Finally, for discriminating between obese patients, with and without diabetes, besides age and BMI, the features contributing most to the models prediction of diabetes was visceral fat mass, cardiac lipid content, PCr/ATP and LV concentric remodelling (Figure 1c). The relationships seen between obesity/T2DM, PCr/ATP, myocardial lipid and BP have been frequently observed in literature 1,5; however the fact that cardiac metabolic parameters were found to be stronger classifiers of obesity than cardiac function is particularly novel. This suggests that varying degrees of cardiac function can be observed in obesity, while low PCr/ATP and high cardiac lipids are almost always present.Bayesian networks depicted in Figure 2(a,c) show the central relationship between BMI and total fat mass and visceral fat mass. It is well established that visceral fat mass is a greater determinant of adverse outcomes than subcutaneous mass. Elevated visceral fat mass has been linked to subacute inflammation and hyperinsulinemia, both of which have been previously shown to be correlated with LV mass and concentric LV remodelling 5. The relationship between LV mass and myocardial energetics is also consistent with reports of energetic impairment in all forms of hypertrophy. Supporting the results of the SHAP analysis, the fact that these associations have been independently learned from the data by the Bayesian networks (via conditional independence as a form of causal inference) allows us to substantiate the causal link between diabetes and visceral fat to concentric LV remodelling and energetic impairment.
Conclusion
With Random Forests we have been able to classify between healthy, diabetes and obese patient subgroups using cardiac metabolic and function parameters achieving test accuracies of 91.67%, 73.08% and 88.89%. Using SHAP values and Bayesian networks as explainability tools, we have demonstrated the informativeness of CMRS metrics in the identification of a diabetic and obese patient heart, alluding to its potential as an early diagnostic tool for the onset of cardiac disease.Acknowledgements
No acknowledgement found.References
- Levelt E, Mahmod M, Piechnik SK, Ariga R, Francis JM, Rodgers CT, Clarke WT, Sabharwal N, Schneider JE, Karamitsos TD, Clarke K, Rider OJ, Neubauer S. Relationship Between Left Ventricular Structural and Metabolic Remodeling in Type 2 Diabetes. Diabetes. 2016 Jan;65(1):44-52. doi: 10.2337/db15-0627. Epub 2015 Oct 5. PMID: 26438611; PMCID: PMC4890658.
- Rial B, Robson MD, Neubauer S, Schneider JE. Rapid quantification of myocardial lipid content in humans using single breath-hold 1H MRS at 3 Tesla. Magn Reson Med. 2011 Sep;66(3):619-24. doi: 10.1002/mrm.23011. Epub 2011 Jun 30. PMID: 21721038; PMCID: PMC3427889.
- Bzdok, D., Altman, N. & Krzywinski, M. Statistics versus machine learning. Nat Methods 15, 233–234 (2018). https://doi.org/10.1038/nmeth.4642
- Zheng, X., Aragam, B., Ravikumar, P., & Xing, E. P. (2018). DAGs with NO TEARS: Continuous optimization for structure learning (NeurIPS 2018, Spotlight).
- Rayner JJ, Banerjee R, Holloway CJ, Lewis AJM, Peterzan MA, Francis JM, Neubauer S, Rider OJ. The relative contribution of metabolic and structural abnormalities to diastolic dysfunction in obesity. Int J Obes (Lond). 2018 Mar;42(3):441-447. doi: 10.1038/ijo.2017.239. Epub 2017 Oct 4. Erratum in: Int J Obes (Lond). 2019 Aug;43(8):1652. PMID: 28974742; PMCID: PMC5880580.
Figures
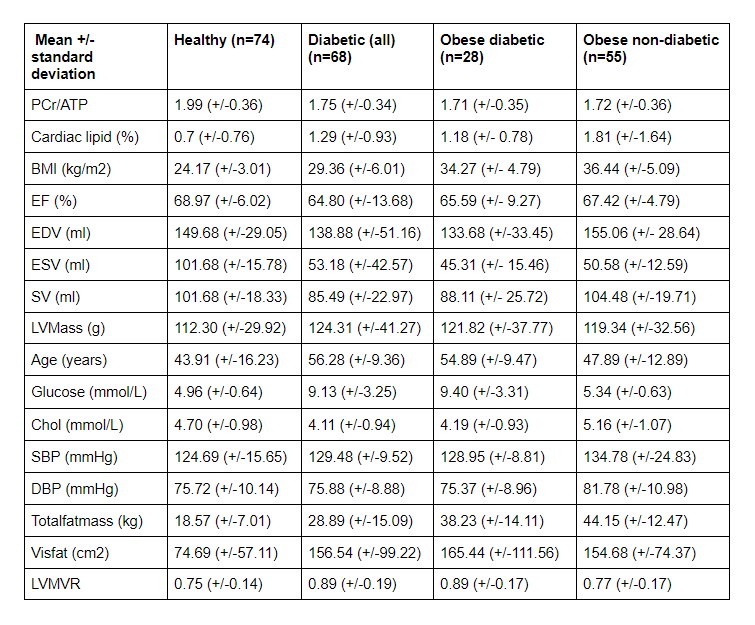
Table 1: Mean and standard deviations of each feature variable by patient subgroup
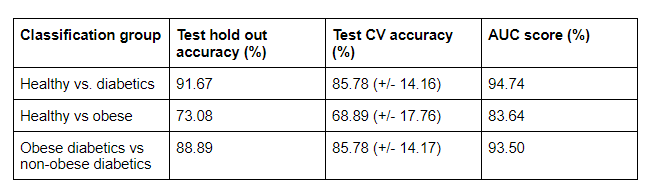
Table 2: Hold-out test accuracy, CV test accuracy (given as the mean and standard deviation with k=15 folds), and area under curve (AUC) scores for each Random Forest classification group
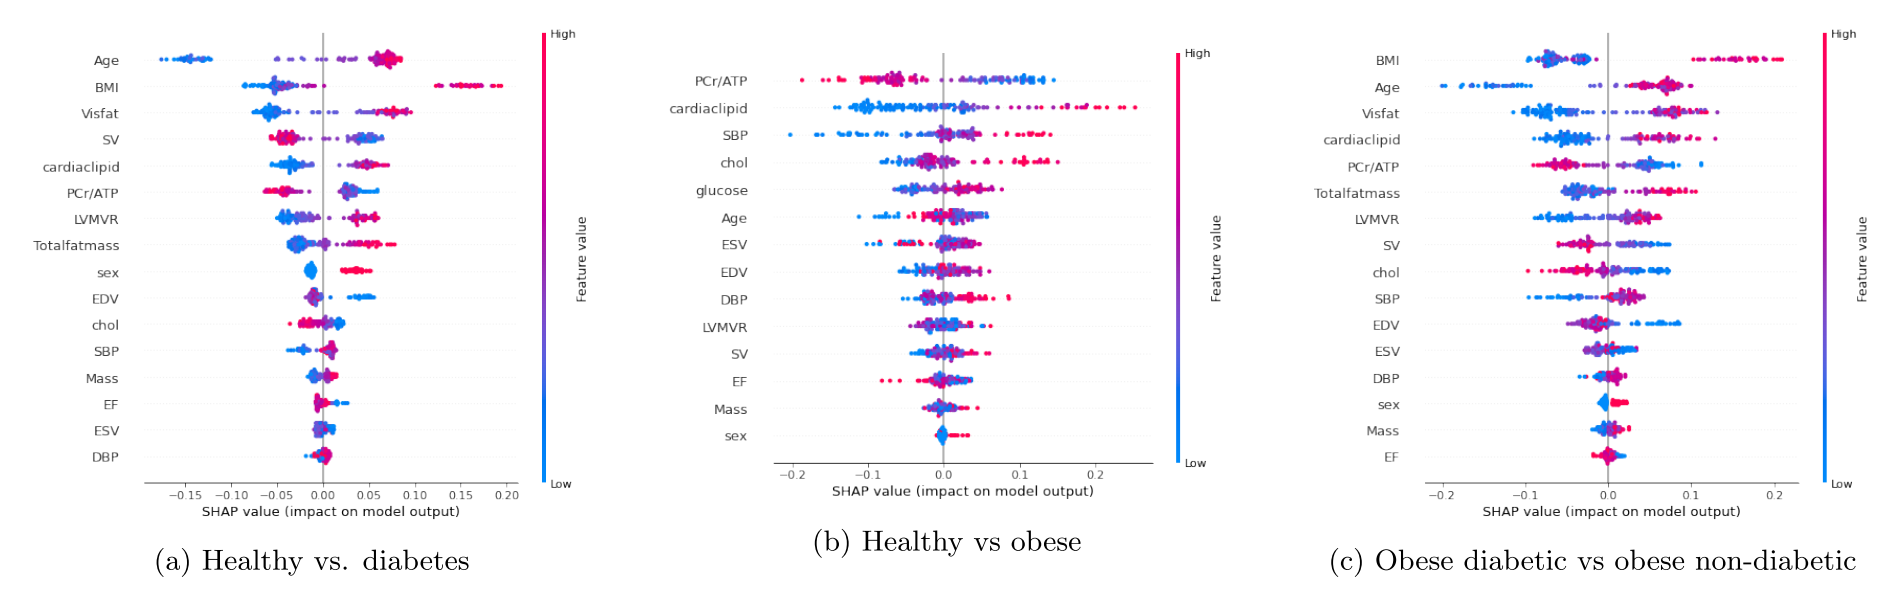
Figure 1(a,b,c): SHAP value plots computed for each Random Forest classification, representing a rank of feature importances. The x-axis gives the SHAP value, i.e. the impact on the model output (for a positive classification). Red indicates higher feature values, while blue indicates lower values.
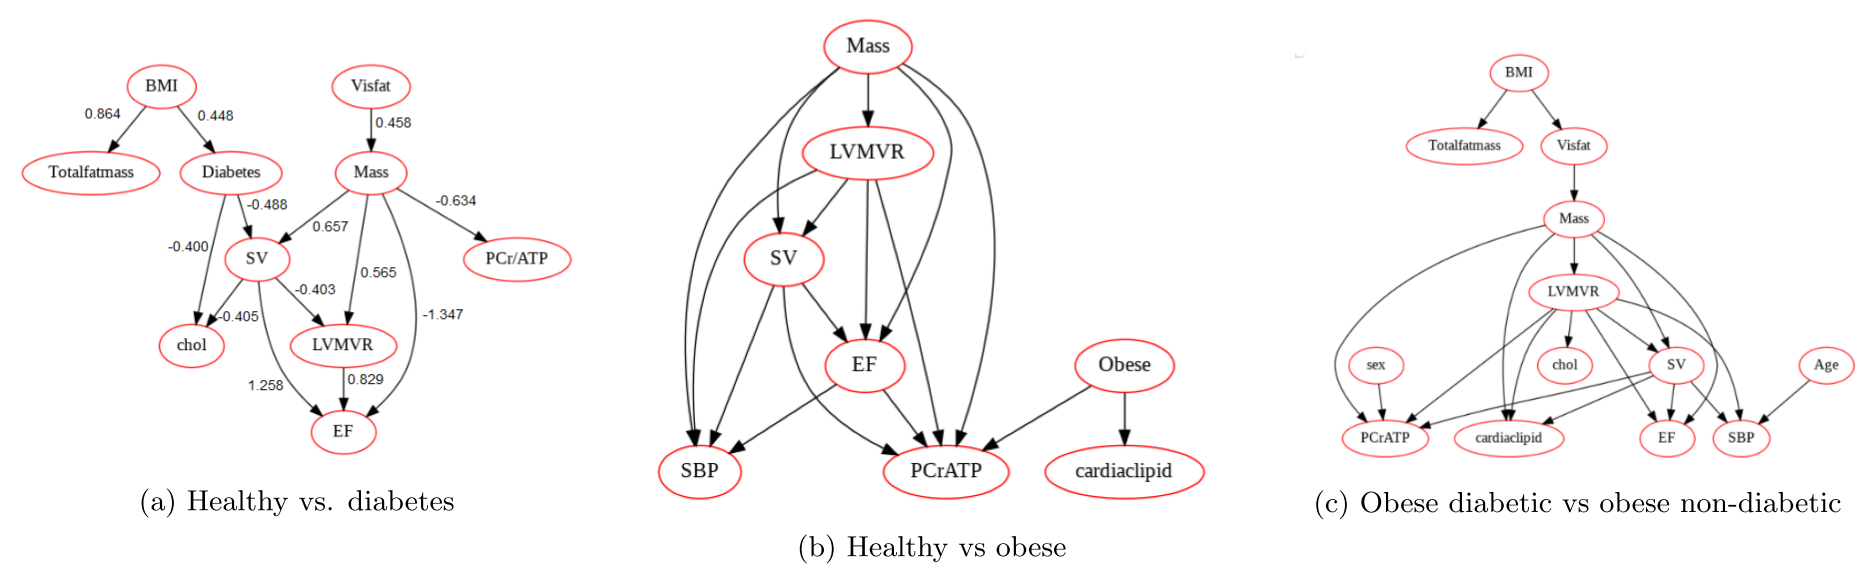
Figure 2(a,b,c): Bayesian networks learned through NOTEARS structure learning algorithm for each subgroup pair of the data. Each node represents a feature variable, and each directed edge encodes causal influence in the form of conditional probability dependence.