2669
Automated Segmentation of the Left Atrium from 3D Late Gadolinium Enhancement Imaging using Deep Learning1Radiology, Northwestern University, Feinberg School of Medicine, Chicago, IL, United States, 2Biomedical Engineering, Northwestern University, Evanston, IL, United States, 3Electrical and Computer Engineering, Northwestern University, Evanston, IL, United States, 4Cardiology, Northwestern University, Feinberg School of Medicine, Chicago, IL, United States
Synopsis
Left atrial (LA) late gadolinium enhancement (LGE) imaging is essential for detecting fibrosis in patients with atrial fibrillation. Unfortunately, slow manual segmentation of LA LGE limits its use in the clinic. The purpose of this study was to develop a fully automated segmentation method for LA LGE images with deep learning. We tested two different U-net architectures that used either 2D or 3D image inputs for training. Our results demonstrate that 3D inputs are superior to 2D, and the 3D U-Net is a promising method to explore further for clinical translation of LA LGE fibrosis quantification.
Introduction
Left atrial (LA) late gadolinium enhancement (LGE) has shown potential for quantification of LA fibrosis and predicting atrial fibrillation (AF) recurrence following ablation [1-3]. One major limitation for using LA fibrosis quantification for patient care is lengthy image processing that is primarily driven by manual segmentation (~15-30 min). Fortunately, deep learning (DL) has been shown to be a promising method for automating segmentation in MRI [4-7] as it can be more robust and faster compared with manual image segmentation. In this study, we sought to develop a fully automated LA wall segmentation method from 3D LA LGE images using DL, assess differences between 2D and 3D U-Net architectures, and evaluate their performance compared with inter-rater variability.Methods
Human Subjects: The study included 27 patients (mean age 60 ± 15 years; 21 males; 6 females) with AF, 8 patients (mean age 67 ± 11 years; 4 males; 4 females) without AF, and 11 healthy controls (mean age 26 ± 2 years; 5 males; 6 females). All subjects underwent previously described 3D LA LGE [8] at 1.5T (MAGNETOM Aera, Siemens).Pulse Sequence & Image Reconstruction: Relevant pulse sequence parameters for 3D LA LGE included FOV=288 mm x 288 mm x 114 mm, spatial resolution=1.5 mm x 1.5 mm x 2.2 mm, flip angle= 40°, receiver bandwidth= 740Hz/pixel, 18,200 radial spokes, scan time=350 heartbeats. The reference 3D LA LGE data were reconstructed using the XD-GRASP framework, as previously described [9].
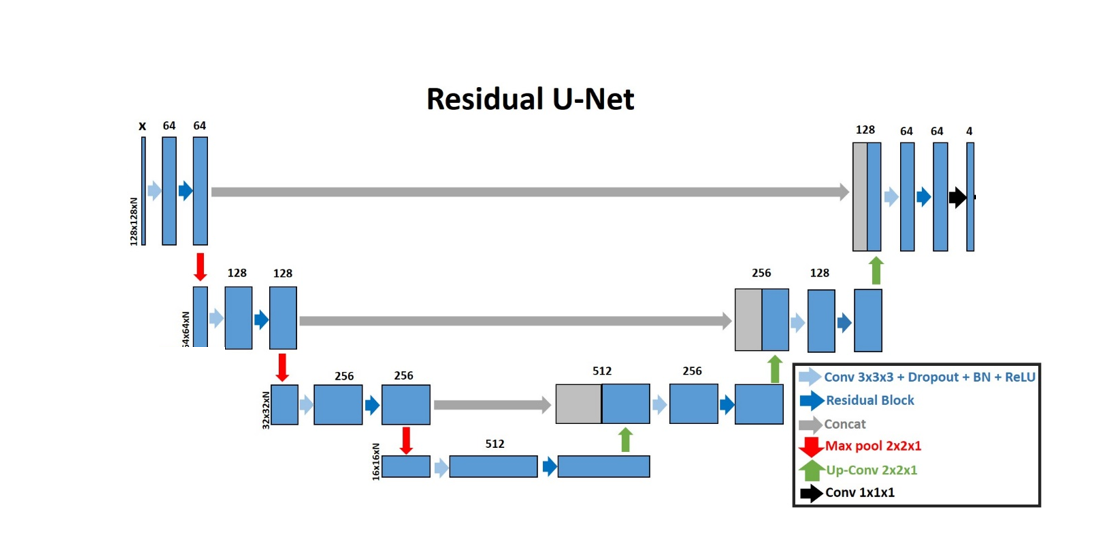
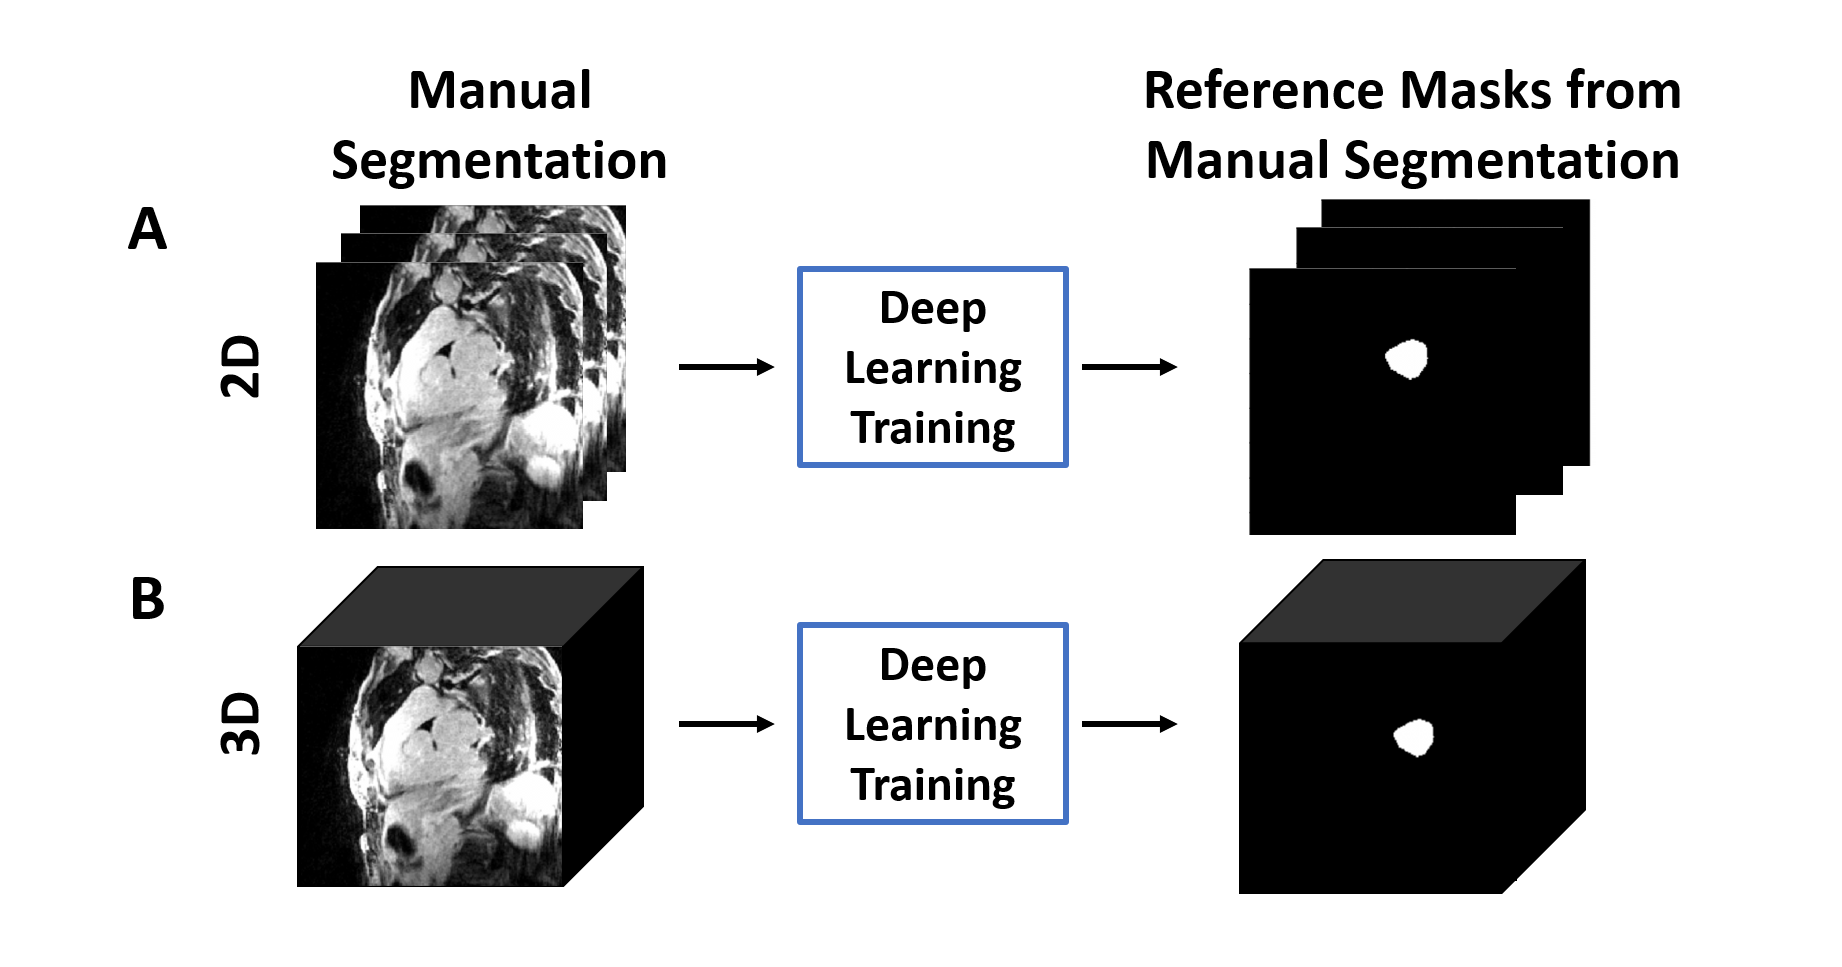
Image Processing: LA wall contours were manually drawn in each axial plane using ADAS 3D (Galgo Medical, Barcelona, Spain) by two raters, one with 4 years of experience as a cardiac MR researcher and one with 6 months experience. The U-net architecture [10] was used for segmentation (see Figure 1). LA LGE images were used as input, and manual contours were used as reference to train two different U-Net architectures: 1) 4-channel network, which used 2D slices as an input (Figure 2A), and 2) 4-channel network which used 3D volumes as the input (Figure 2B). We used 2D pooling (2x2x1) which allows for an arbitrary number of slices, and crossentropy with Sørensen–Dice (DICE) and Hausdorff distance as the loss terms. Of the 46 total subjects in the study, 30 were randomly selected for training, and the remaining 16 were used for testing the networks. The reference segmentation for the DL training was performed by the more experienced rater, while both raters segmented the testing data sets. In total, we used 1,560 manually annotated 2D images (22 patients with AF, 3 patients without AF, and 5 healthy volunteers, 52 slices per subject) for training, and the remaining 832 manually annotated 2D images (5 patients with AF, 5 patients without AF, and 6 healthy volunteers, 52 slices per subject) for testing. The 2D U-Net took 50 min to train, while the 3D U-Net took 2.5 hours to train.
Quantitative and Statistical Analyses: For each U-Net, we calculated the DICE index with respect to the manual contour; similarly, we calculated the DICE index to evaluate inter-rater agreement. We performed appropriate statistical analyses to compare groups (ANOVA for three groups, paired t-test for two groups).
Results
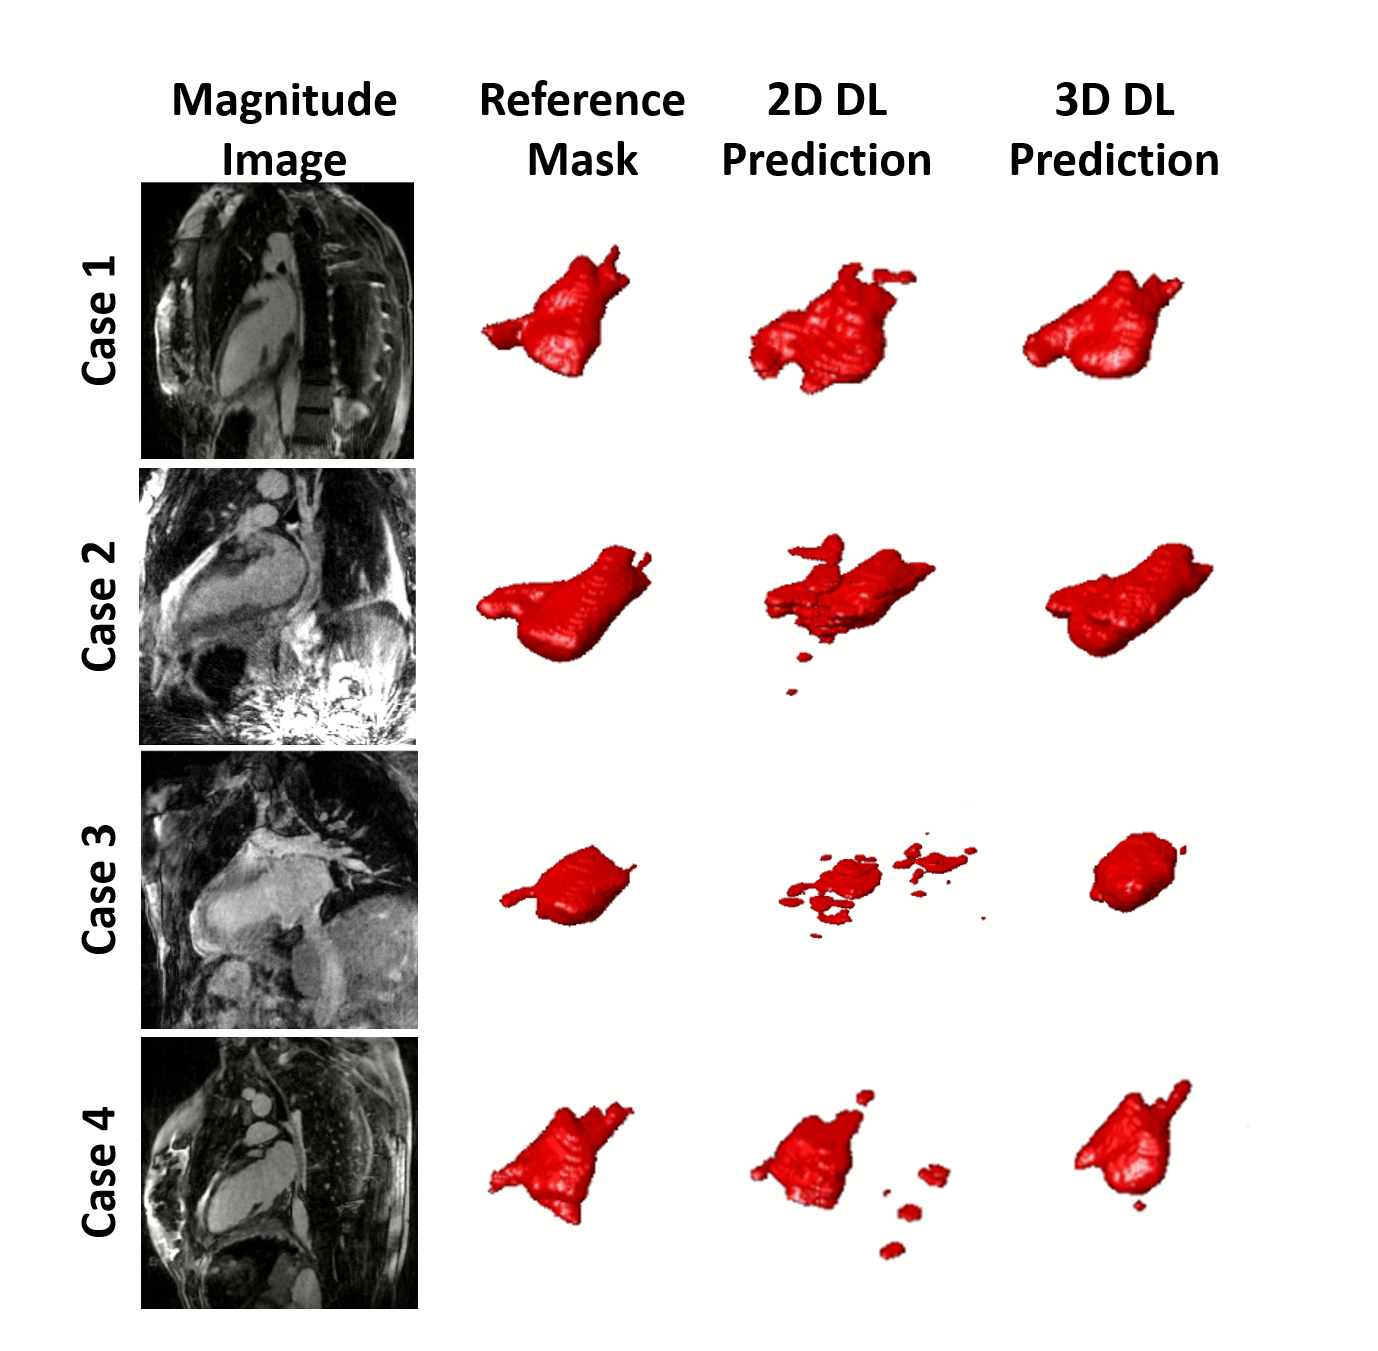
The mean segmentation time for U-Net (2 s) was 480- and 1110-times shorter (p < 0.001) than the more experienced rater (16 ± 2 min) and the newer rater (37 ± 10 min), respectively. Figure 3 shows results from 4 representative cases, in which the 3D U-Net was qualitatively better than the 2D U-Net. The DICE scores were not significantly (p > 0.05) different between 2D U-Net (0.65 ± 0.26), 3D U-Net (0.73 ± 0.18), and inter-rater agreement (0.79 ± 0.18).Discussion
This study demonstrates use of 2D and 3D residual U-Nets for automatic segmentation of the LA wall in 3D LGE images. The automatic segmentation was 480-1110 times faster than manual segmentation and, therefore, is a much more efficient method for clinical translation. While DICE scores were not statistically different between the segmentations generated by the 2D and 3D U-Nets, qualitatively the 3D U-Net produced a better result. Visually, it can be seen that an area of difficulty for the DL network to accurately segment is the left atrial appendage (LAA). Manual segmentation of the 3D LGE images allows for better delineation of the LAA which is why the inter-reader DICE is higher than that of either of the DL networks. Therefore, a greater focus on the LAA in the DL training must be considered. Future investigation will include more datasets for training and testing, as well as evaluation of reproducibility in LA fibrosis quantification using DL compared with manual segmentation.Acknowledgements
This work was supported in part by the following grants: National Institutes of Health (R01HL116895, R01HL138578, R21EB024315, R21AG055954, R01HL151079) and American Heart Association (19IPLOI34760317)References
1. Oakes, R.S., et al., Detection and Quantification of Left Atrial Structural Remodeling With Delayed-Enhancement Magnetic Resonance Imaging in Patients With Atrial Fibrillation. Circulation, 2009. 119(13): p. 1758-U123.
2. Marrouche, N.F., et al., Association of Atrial Tissue Fibrosis Identified by Delayed Enhancement MRI and Atrial Fibrillation Catheter Ablation The DECAAF Study. Jama-Journal of the American Medical Association, 2014. 311(5): p. 498-506.
3. Kheirkhahan, M., et al., Left atrial fibrosis progression detected by LGE-MRI after ablation of atrial fibrillation. Pace-Pacing and Clinical Electrophysiology, 2020. 43(4): p. 402-411.
4. Fahmy, A.S., et al., Three-dimensional Deep Convolutional Neural Networks for Automated Myocardial Scar Quantification in Hypertrophic Cardiomyopathy: A Multicenter Multivendor Study. Radiology, 2020. 294(1): p. 52-60.
5. Fahmy, A.S., et al., Automated analysis of cardiovascular magnetic resonance myocardial native T1 mapping images using fully convolutional neural networks. J Cardiovasc Magn Reson, 2019. 21(1): p. 7.
6. Ngo, T.A., Z. Lu, and G. Carneiro, Combining deep learning and level set for the automated segmentation of the left ventricle of the heart from cardiac cine magnetic resonance. Med Image Anal, 2017. 35: p. 159-171.
7. Yang, X.L., Z. Zeng, and S. Yi, Deep convolutional neural networks for automatic segmentation of left ventricle cavity from cardiac magnetic resonance images. Iet Computer Vision, 2017. 11(8): p. 643-649.
8. Gunasekaran, S., et al., Accelerated 3D Left Atrial Late Gadolinium Enhancement in Patients with Atrial Fibrillation at 1.5 T: Technical Development. Radiol Cardiothorac Imaging, 2020. 2(5): p. e200134.
9. Gunasekaran S, H.H.H.-V., R Passman, D Lee, D Kim Self-Navigated, Free-Breathing 3D Left Atrial Late Gadolinium Enhancement MRI with Stack-of-Stars k-space Sampling and GRASP Reconstruction: A Preliminary Study for Quantification of Atrial Fibrosis. in ISMRM. 2019. Montreal, QC, Canada.
10. Cheng, J.L., et al., Fully convolutional attention network for biomedical image segmentation. Artificial Intelligence in Medicine, 2020. 107.
Figures