2665
Intracranial aneurysm segmentation using a deep convolutional neural network1Center for Biomedical Imaging Research, Department of Biomedical Engineering, Tsinghua University, Beijing, China, 2Johns Hopkins University, Baltimore, MD, United States
Synopsis
Intracranial aneurysms are abnormal dilations of the cerebral arteries that have a prevalence of 5-8% in the general population. In this study, we successfully segmented IAs from dual inputs (TOF-MRA and T1-VISTA) using the hyperdense net with higher accuracy than a single input. The maximum diameter measurements for IAs derived from our segmentation was consistent with the maximum diameters obtained from the criterion standard (DSA). We showed that larger aneurysms were easier to segment by the deep learning model. In the future, we will test other deep learning models on aneurysm segmentation and compare these results with the hyperdense net.
Introduction
Intracranial aneurysms (IAs) are abnormal dilations of the cerebral arteries that have a prevalence of 5-8% in the general population.1 Digital subtraction angiography (DSA) is considered to be the standard for evaluating IA location and morphology;2 however, DSA is an invasive procedure. Magnetic resonance (MR) is a promising noninvasive imaging modality, which provides morphological, functional and hemodynamical data of IAs without intervention and radiation. Time-of-flight MR angiography (TOF-MRA) is one of the most useful MR methods for assessing morphological information.3 Previous studies have neglected the flow-based characteristics of TOF-MRA, which may produce flow artifacts4 and underestimate aneurysm size.5 Compared with TOF-MRA, black-blood MR imaging (BB-MRI) better delineates the boundaries of an IA and produces more accurate size measurements.5 In this study, to integrate the advantages from both TOF-MRA and BB-MRI, we trained a CNN to segment IAs using dual inputs and validated the outperformance of dual inputs compared to a single input. We also compared IA maximum diameters, which we automatically measured using a dual input model, with diameters measured by DSA as the gold standard. Finally, we studied the performance of our CNN model for different IA sizes.Methods
Study Population:Patients (n=96) with unruptured IAs detected by DSA were consecutively recruited.
Experiment 1: Dual-input intracranial aneurysm segmentation.
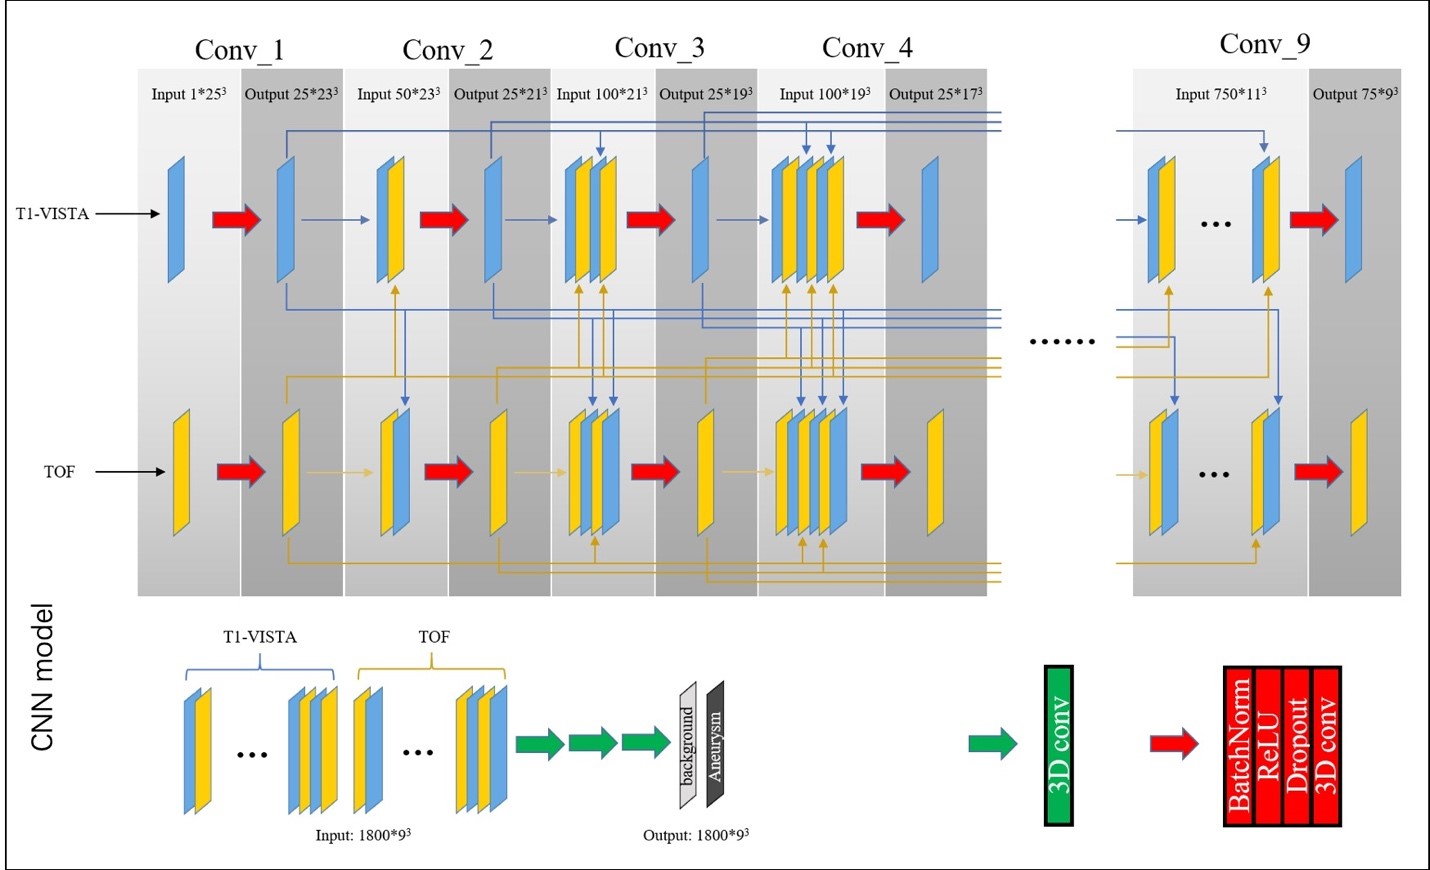
The TOF-MRA image was rigidly registered to the T1-VISTA image. Patients were randomly separated into a training set (66 patients, 70%) and a test set (25 patients, 30%). The hyperdense net (Fig. 1), a recently developed CNN for multi-modal medical image segmentation, was used to segment the aneurysms.6 Performance metrics including DSC, sensitivity, specificity and PPV were expressed as mean ± SE. Paired Student’s t-tests were used to compare segmentation performance across different image contrast inputs.
Experiment 2: Maximum diameter comparison with the criterion standard (DSA).
The relationship between the label, segmentation results and DSA was investigated using linear regression analysis (R2). Statistical significance was defined as a P-value < 0.05.
Experiment 3: Influence of factors on segmentation.
The maximum diameter and volume of each aneurysm were chosen as surrogates to study the role of aneurysm size on segmentation performance.
Results
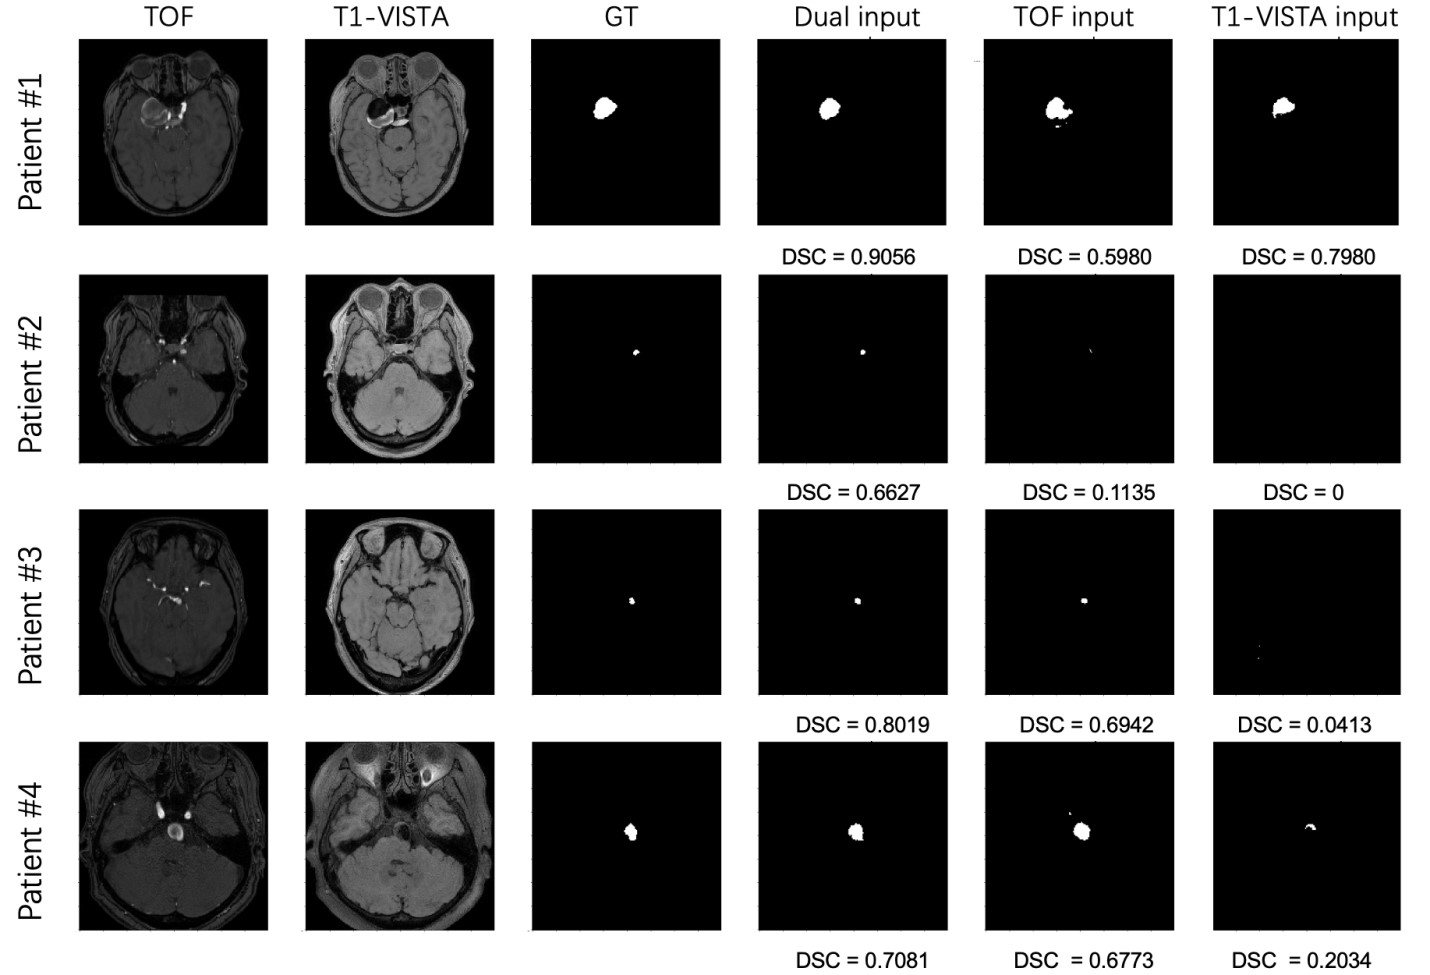
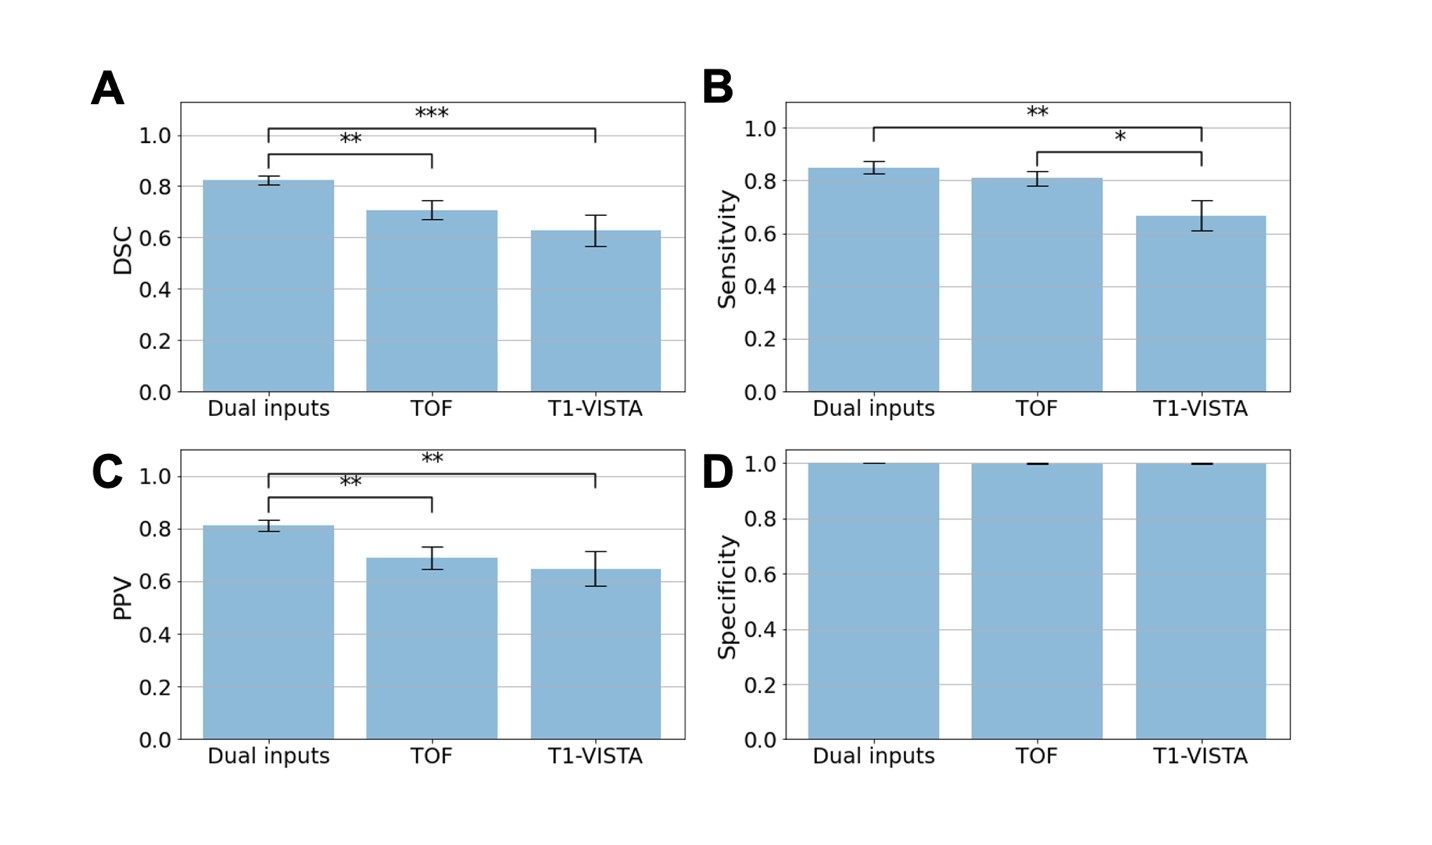
Four patients with aneurysms that varied in size from small to large are shown in Fig. 2.The statistical comparison of models with different contrast inputs for segmenting aneurysms is shown in Fig. 3A. The model with dual inputs had a mean DSC of 0.82 ± 0.02, which was higher than TOF-MRA alone (0.71 ± 0.04, p < 0.005) and T1-VISTA alone (0.63 ± 0.06, p < 0.0005). In Fig. 3B and 3C, the sensitivity (0.85 ± 0.02) and PPV (0.81 ± 0.02) of the best performing model with dual inputs significantly outperformed TOF-MRA alone (sensitivity: 0.81 ± 0.03; PPV: 0.69 ± 0.04) and T1-VISTA alone (sensitivity: 0.67 ± 0.06; PPV: 0.65 ± 0.06). In Fig. 3D, the three models all had a specificity of ~1 because of the extreme class imbalance between the aneurysm label and the background.
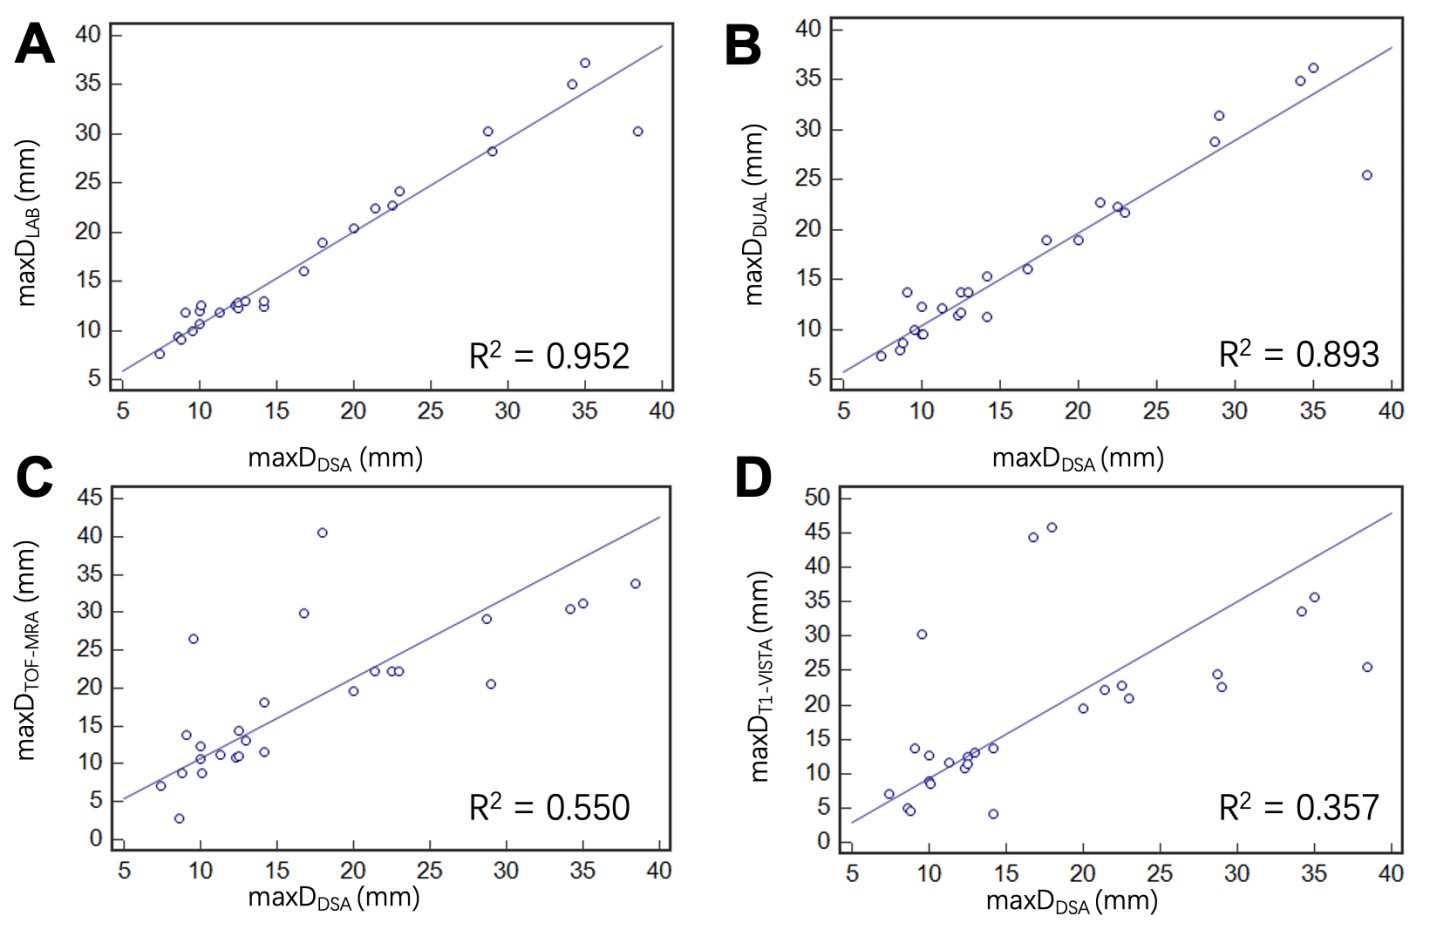
To further validate the hyperdense net segmentation performance, we automatically calculated the maxDDual, maxDTOF-MRA and maxDT1-VISTA for all cases in the test set and compared these values with the maxDDSA. In Fig. 4A, a high correlation between the maxDLAB and maxDDSA confirmed the utility of our segmentation label. Agreement between the quantitative measurements using MR imaging contrasts (label/result) and DSA is summarized in scatter plots/regression lines in Fig. 4.
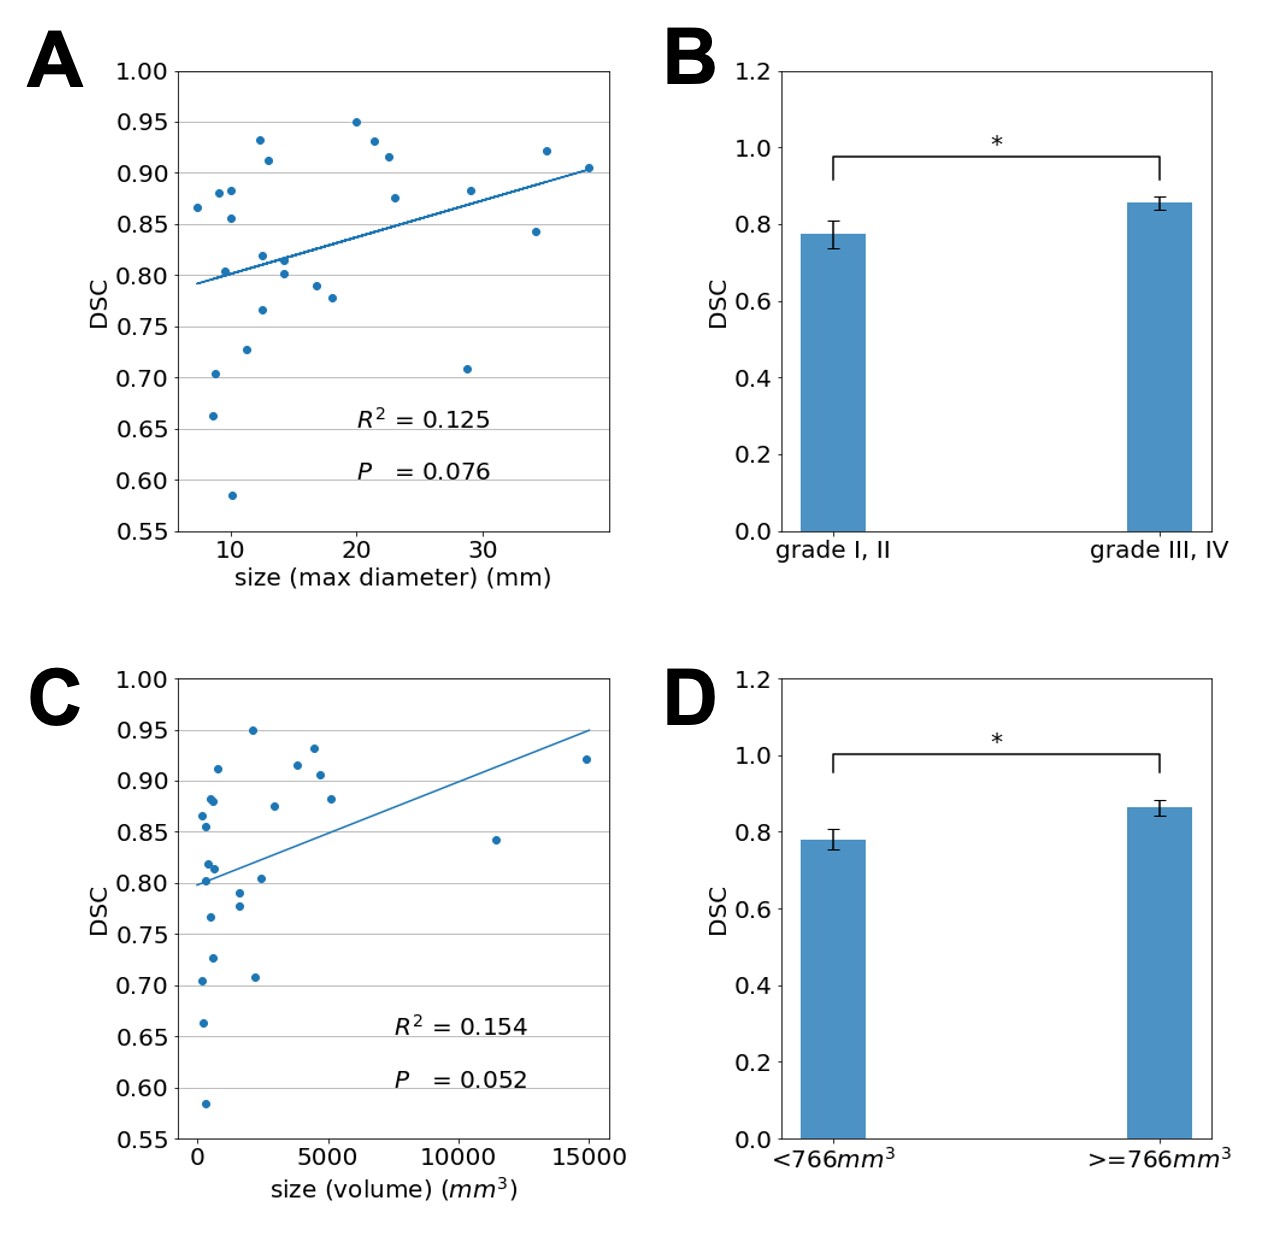
In Fig. 5A, the DSC of each aneurysm (y axis) is shown with the corresponding maximum aneurysm diameter measured using the label, which shows that the segmentation performance of the model with dual inputs was positively associated with the maximum aneurysm diameter. Based on the maximum diameter of each aneurysm, patients were further divided into two categories: grade I/II representing aneurysms with a low risk for rupture and grade III/IV representing aneurysms with a high risk for rupture based on ISUIA7 criteria. Fig. 5B shows that the average DSC for grade III and IV aneurysms (0.86) was significantly higher (p = 0.03) than the average DSC for grade I and II aneurysms (0.77). These observations were consistent with the trend depicted in Fig. 5A. Similarly, in Fig. 5C, the DSCs were positively correlated with aneurysm volumes. In Fig. 5D, patients were separated into two categories using the median aneurysm volume (766 mm3) as the threshold. The average DSC of patients with larger aneurysm volumes (0.86) was significantly higher (p = 0.02) than the average DSC for smaller aneurysms (0.78). In general, these results demonstrate that large aneurysms are easier to segment.
Discussion and Conclusion
In this study, we successfully segmented IAs from dual inputs (TOF-MRA and T1-VISTA) using the hyperdense net with higher accuracy than a single input. The maximum diameter measurements for IAs derived from our segmentation was consistent with the maximum diameters obtained from the criterion standard (DSA). We showed that larger aneurysms were easier to segment by the deep learning model. In the future, we will test other deep learning models on aneurysm segmentation and compare these results with the hyperdense net.Acknowledgements
All authors have no conflicts of interest to report.References
1. Rinkel GJ, Djibuti M, Algra A, et al. Prevalence and risk of rupture of intracranial aneurysms: a systematic review. Stroke 1998;29:251–6.
2. Leffers AM, Wagner A. Neurologic complications of cerebral angiography. A retrospective study of complication rate and patient risk factors. Acta Radiol 2000;41:204 –10.
3. Cirillo M, Scomazzoni F, Cirillo L, et al. Comparison of 3D TOF-MRA and 3D CE-MRA at 3T for imaging of intracranial aneurysms. Eur J Radiol 2013;82:e853-9.
4. Derdeyn CP, Graves VB, Turski PA, et al. MR angiography of saccular aneurysms after treatment with Guglielmi detachable coils: preliminary experience. AJNR Am J Neuroradiol 1997;18:279–86.
5. Zhu C, Wang X, Eisenmenger L, et al. Surveillance of unruptured intracranial saccular aneurysms using noncontrast 3D-black-blood MRI: comparison of 3D-TOF and contrast-enhanced MRA with 3D-DSA. AJNR Am J Neuroradiol 2019;40:960-6.
6. Dolz J, Gopinath K, Yuan J, et al. HyperDense-Net: a hyper-densely connected CNN for multi-modal image segmentation. IEEE Trans Med Imaging 2019;38:1116-26.
7. Wiebers DO, Whisnant JP, Huston J III, et al. Unruptured intracranial aneurysms: natural history, clinical outcome, and risks of surgical and endovascular treatment. Lancet 2003;362: 103–10.
Figures