2659
Exploring feature space of MR vessel images with limited data annotations through metric learning and episodic training1University of Science and Technology of China, Hefei, China, 2Department of Electrical and Computer Engineering, University of Washington, Seattle, WA, United States, 3Department of Radiology, University of Washington, Seattle, WA, United States, 4Department of Surgery, University of Washington, Seattle, WA, United States
Synopsis
Popliteal vessel wall features hidden in the Osteoarthritis Initiative (OAI) dataset warrant further investigation. However, if the number of annotations is insufficient, deep learning-based feature map analysis from MRI images may overfit and fail to generate a meaningful feature space. We designed a metric learning network combined with an episodic training method to overcome the problem of limited annotations, and demonstrated its ability to learn a meaningful feature embedding. Based on our feature map, we proposed an iterative workflow and identified vessel wall images with high probability of diseases from 1974 cases.
Introduction
Vascular diseases can cause severe disability and death. Vessel wall MR imaging techniques can be used to better understand the formation and progression of vascular diseases and can aid in diagnosis [1, 2, 3]. MR images of the knee from the Osteoarthritis Initiative (OAI) dataset also show high-quality vessel wall information, which can serve as a valuable resource for vessel analysis and clinical diagnosis [4]. However, manual screening for vascular diseases in large datasets such as OAI is not feasible and therefore this task calls for automated detection. We developed a CNN method to address this task.With the powerful feature extraction ability of deep learning, we can utilize the latent features of these MR vessel images from the feature embedding layer of convolutional neural network structure. However, common learning algorithms usually require a large amount of annotated data. With few annotations provided in the OAI dataset, it is particularly challenging to train a model that can identify vascular diseases.
Instead of directly learning the classification of vessel images, we designed a metric learning network to embed MR images into meaningful feature space, thus overcoming the overfitting problems caused by limited data.
Methods
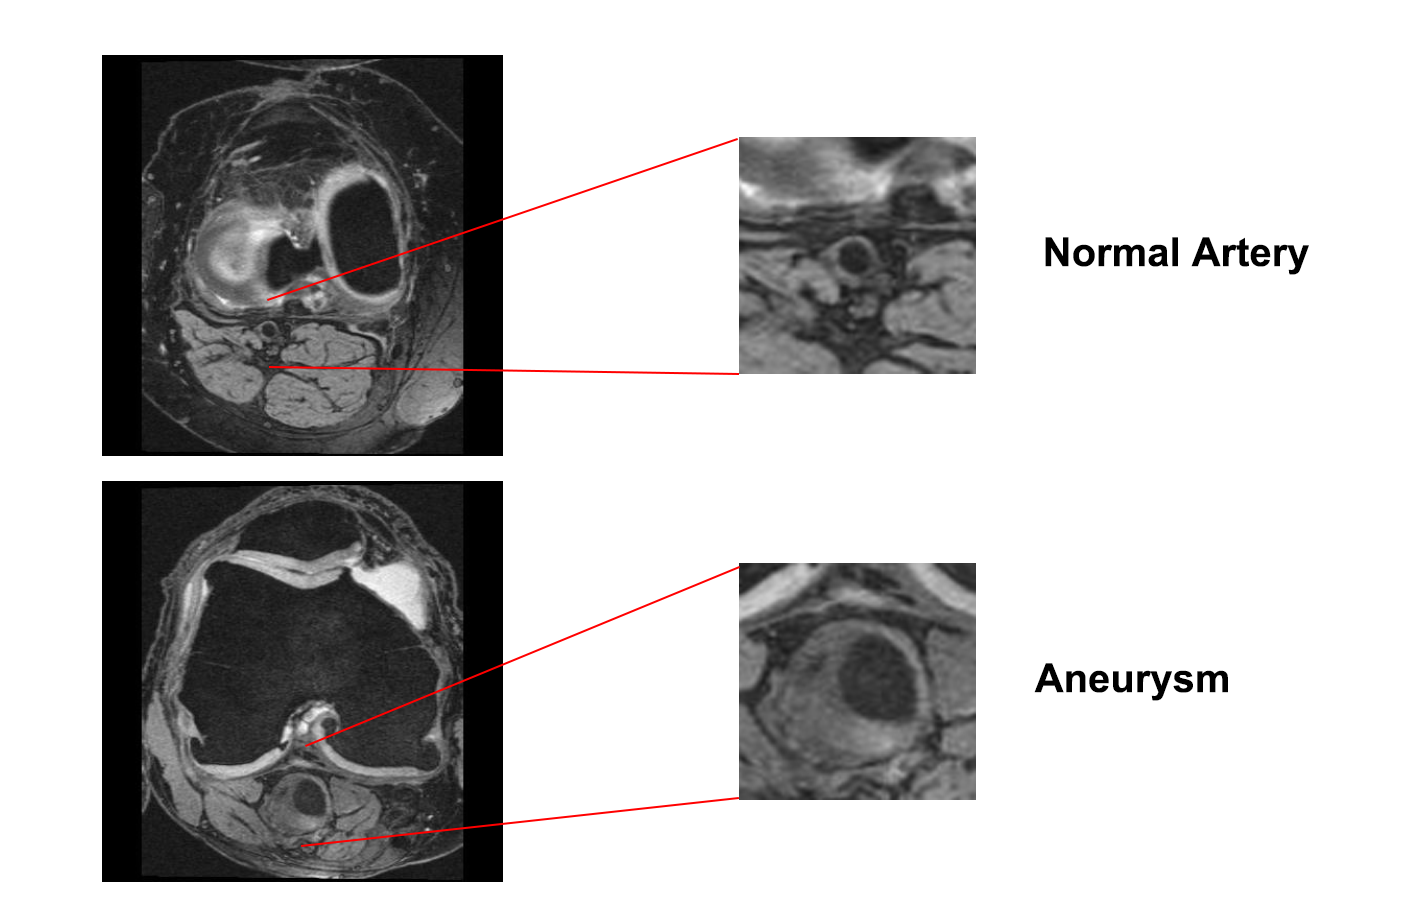
Dataset371 samples of MRI scans were annotated by human experts, among which 72 scans were confirmed as abnormal (aneurysm, ectasia, plaque, etc.). We initiated a training procedure using 477 slices from 17 scans with aneurysms due to their distinct appearance from normal arteries (see Figure 1). We chose 699 slices from 30 scans with normal vessel wall as negative data.
We used artery detections from [5] to crop vessel wall patches with a size of 128*128. For slices with failed detection results, we used the closest slices successfully detected to compute the average coordinates. The rest of the annotated scans was used to visualize and test the feature space.
Network Structure
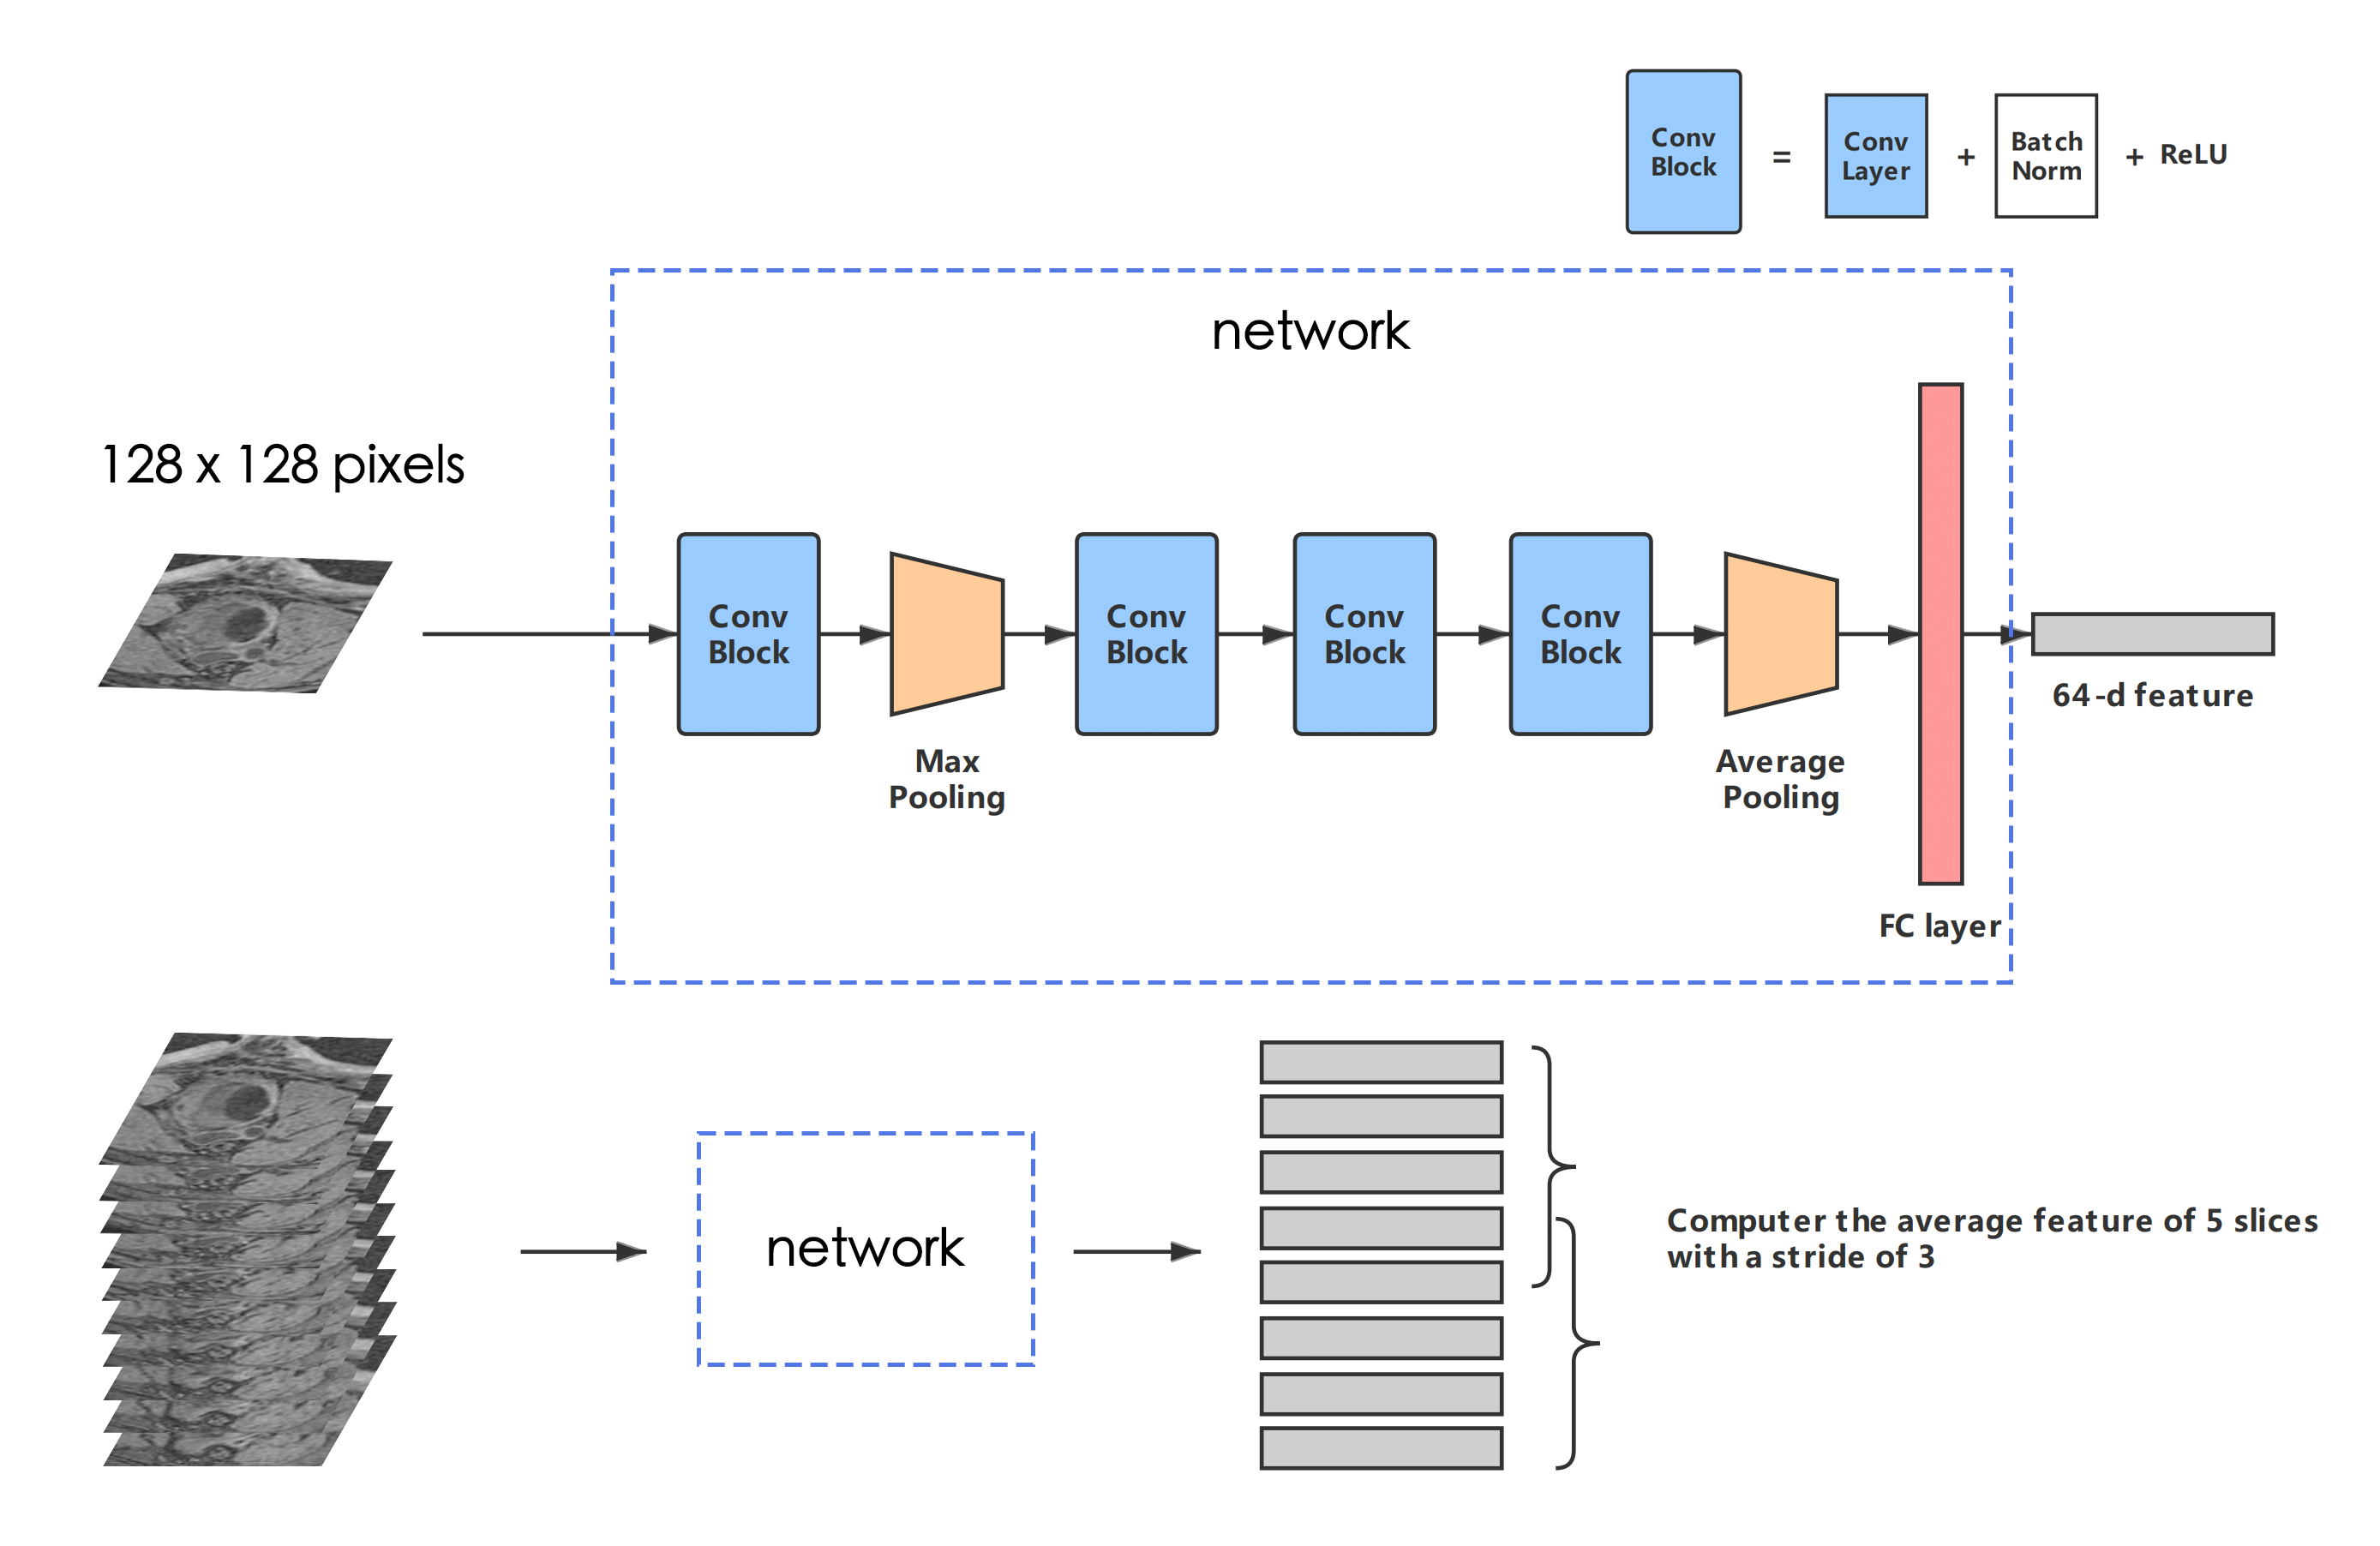
To avoid the overfitting problem caused by limited training data, we designed a small network with 4 convolution blocks following a fully connected layer. The output is a 64-dimension feature embedding. (See Figure 2)
Episodic Training
To balance the negative and positive data, we randomly selected 16 aneurysm slices, 16 normal slices, and 32 query slices to form one training episode [6] every time. During training, the network computes the features of all 64 slices in an episode, and the features of normal and abnormal slices will be used to measure and predict the type of query slices. We chose cosine similarity as the measurement criterion, and computed the average triplet loss [7] for backpropagation.
Inference
To identify potential abnormal samples in the unlabeled dataset, we first generated feature vectors for all the slices in each sample, and computed the average feature from every 5 consecutive slices in the scan, with a stride of 3 (see Figure 2). The same procedure was used on labeled data to generate support clusters. Then we measured the similarity between the feature of unknown samples with those of support clusters, and use top K scores to determine whether the sample has abnormal vessel wall.
Workflow
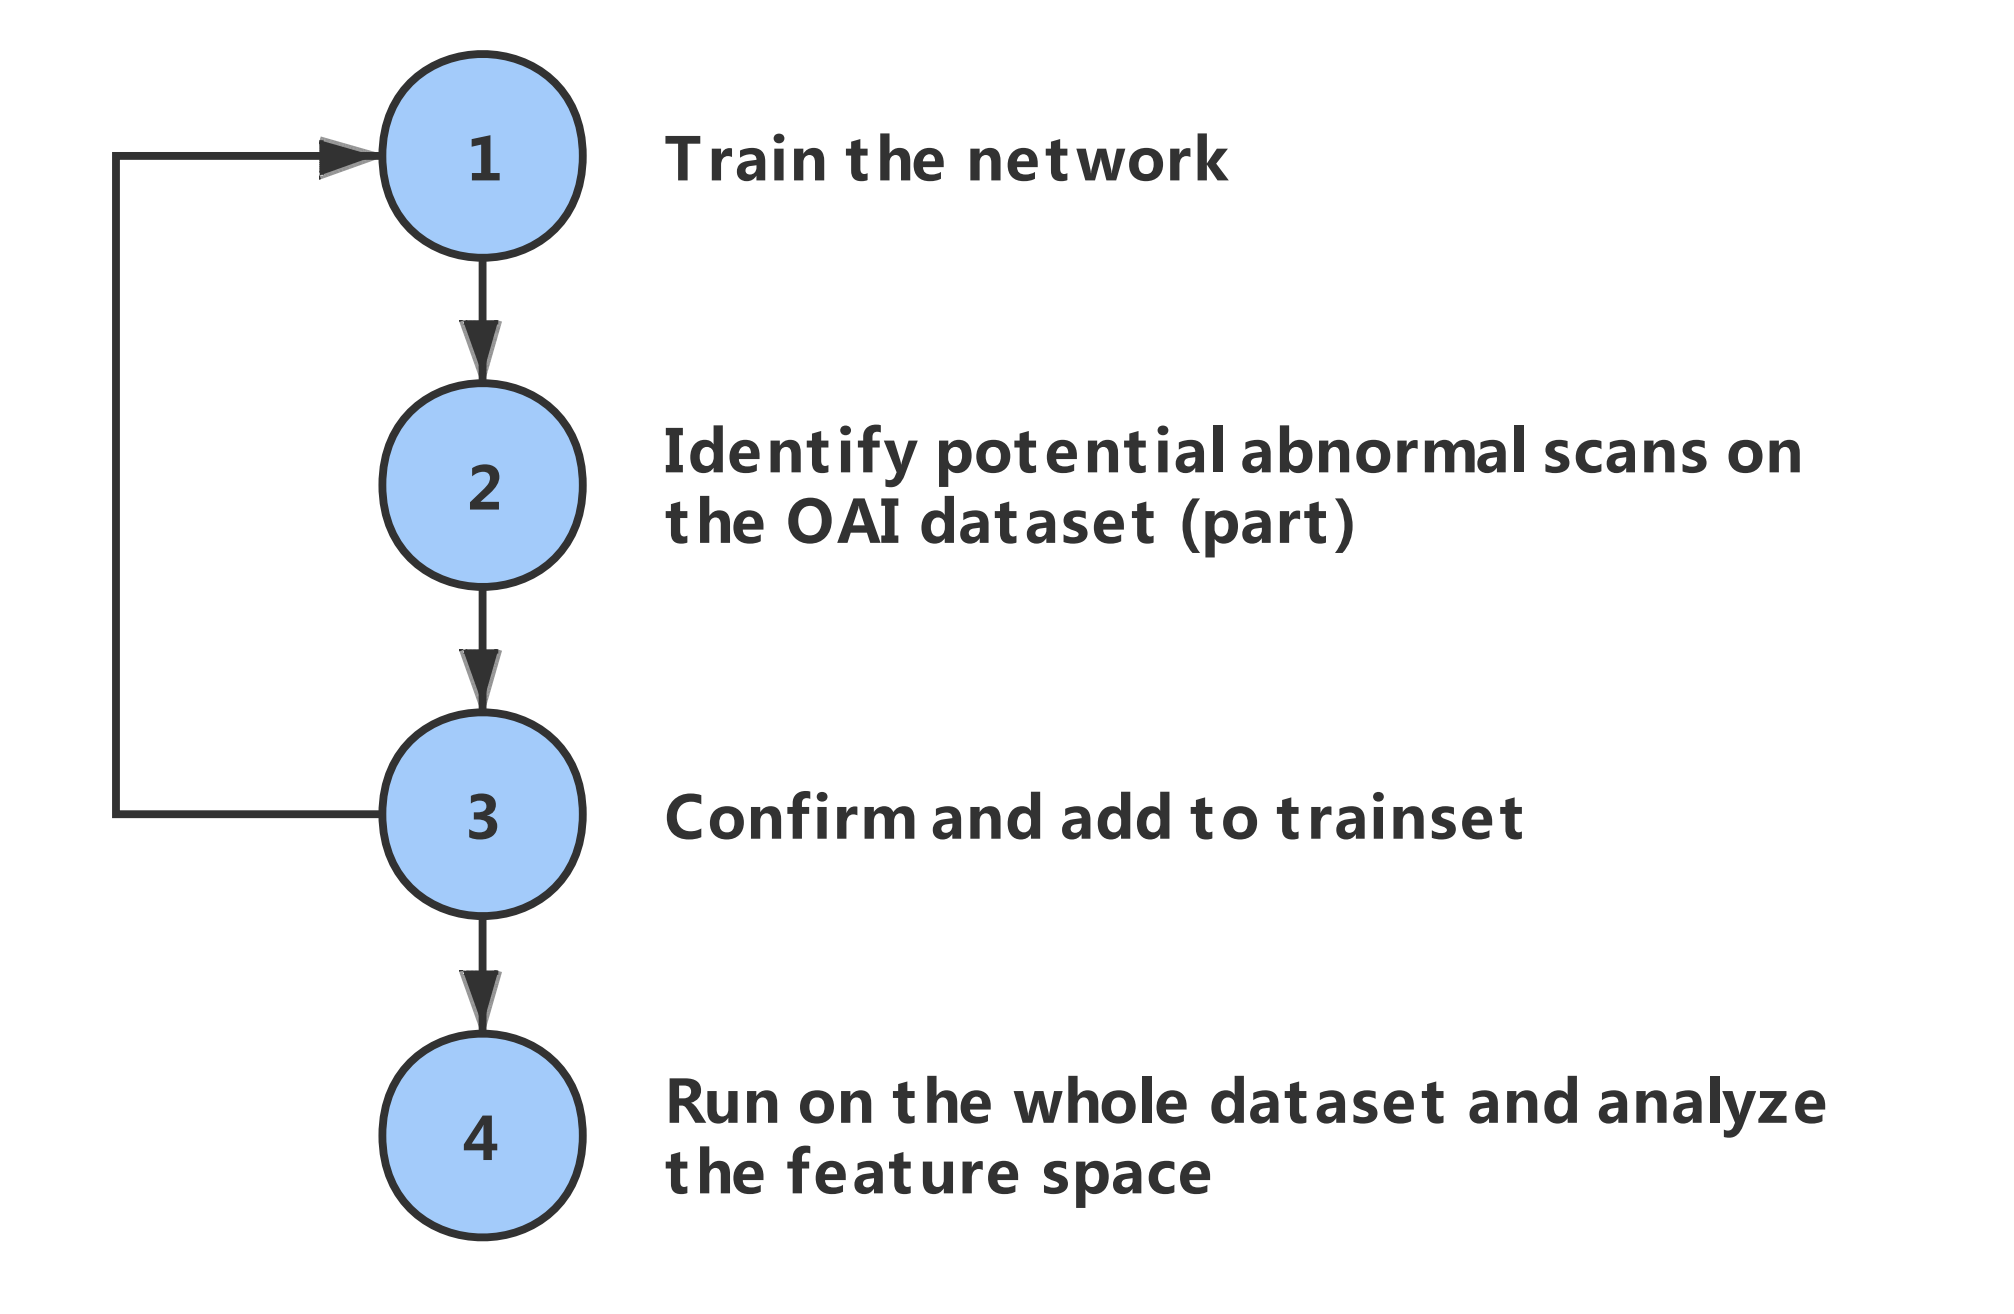
To find more abnormal samples and make our model robust, we proposed a potential workflow, as shown in Figure 3. We first trained the model with existing labeled data, then used the above inference method to identify potential samples on part of the dataset. After confirmation by human experts, these samples can be added to the training set to improve the model's performance. By iteratively repeating these 3 steps, we can enrich our dataset, which guarantees the training of more robust networks.
Validation
To test the ability of our workflow for identifying new categories of vascular disease, we chose 30 normal and 7 ectasia samples from the rest of annotated data. Feature maps for normal and ectasia vessel wall patches were generated. The distances of ectasia patches between the cluster center of all normal and abnormal (aneurysm) patches were used to evaluate the effectiveness of our feature map generation method.
We also applied our inference method to 1974 unknown samples in the OAI dataset.
Results
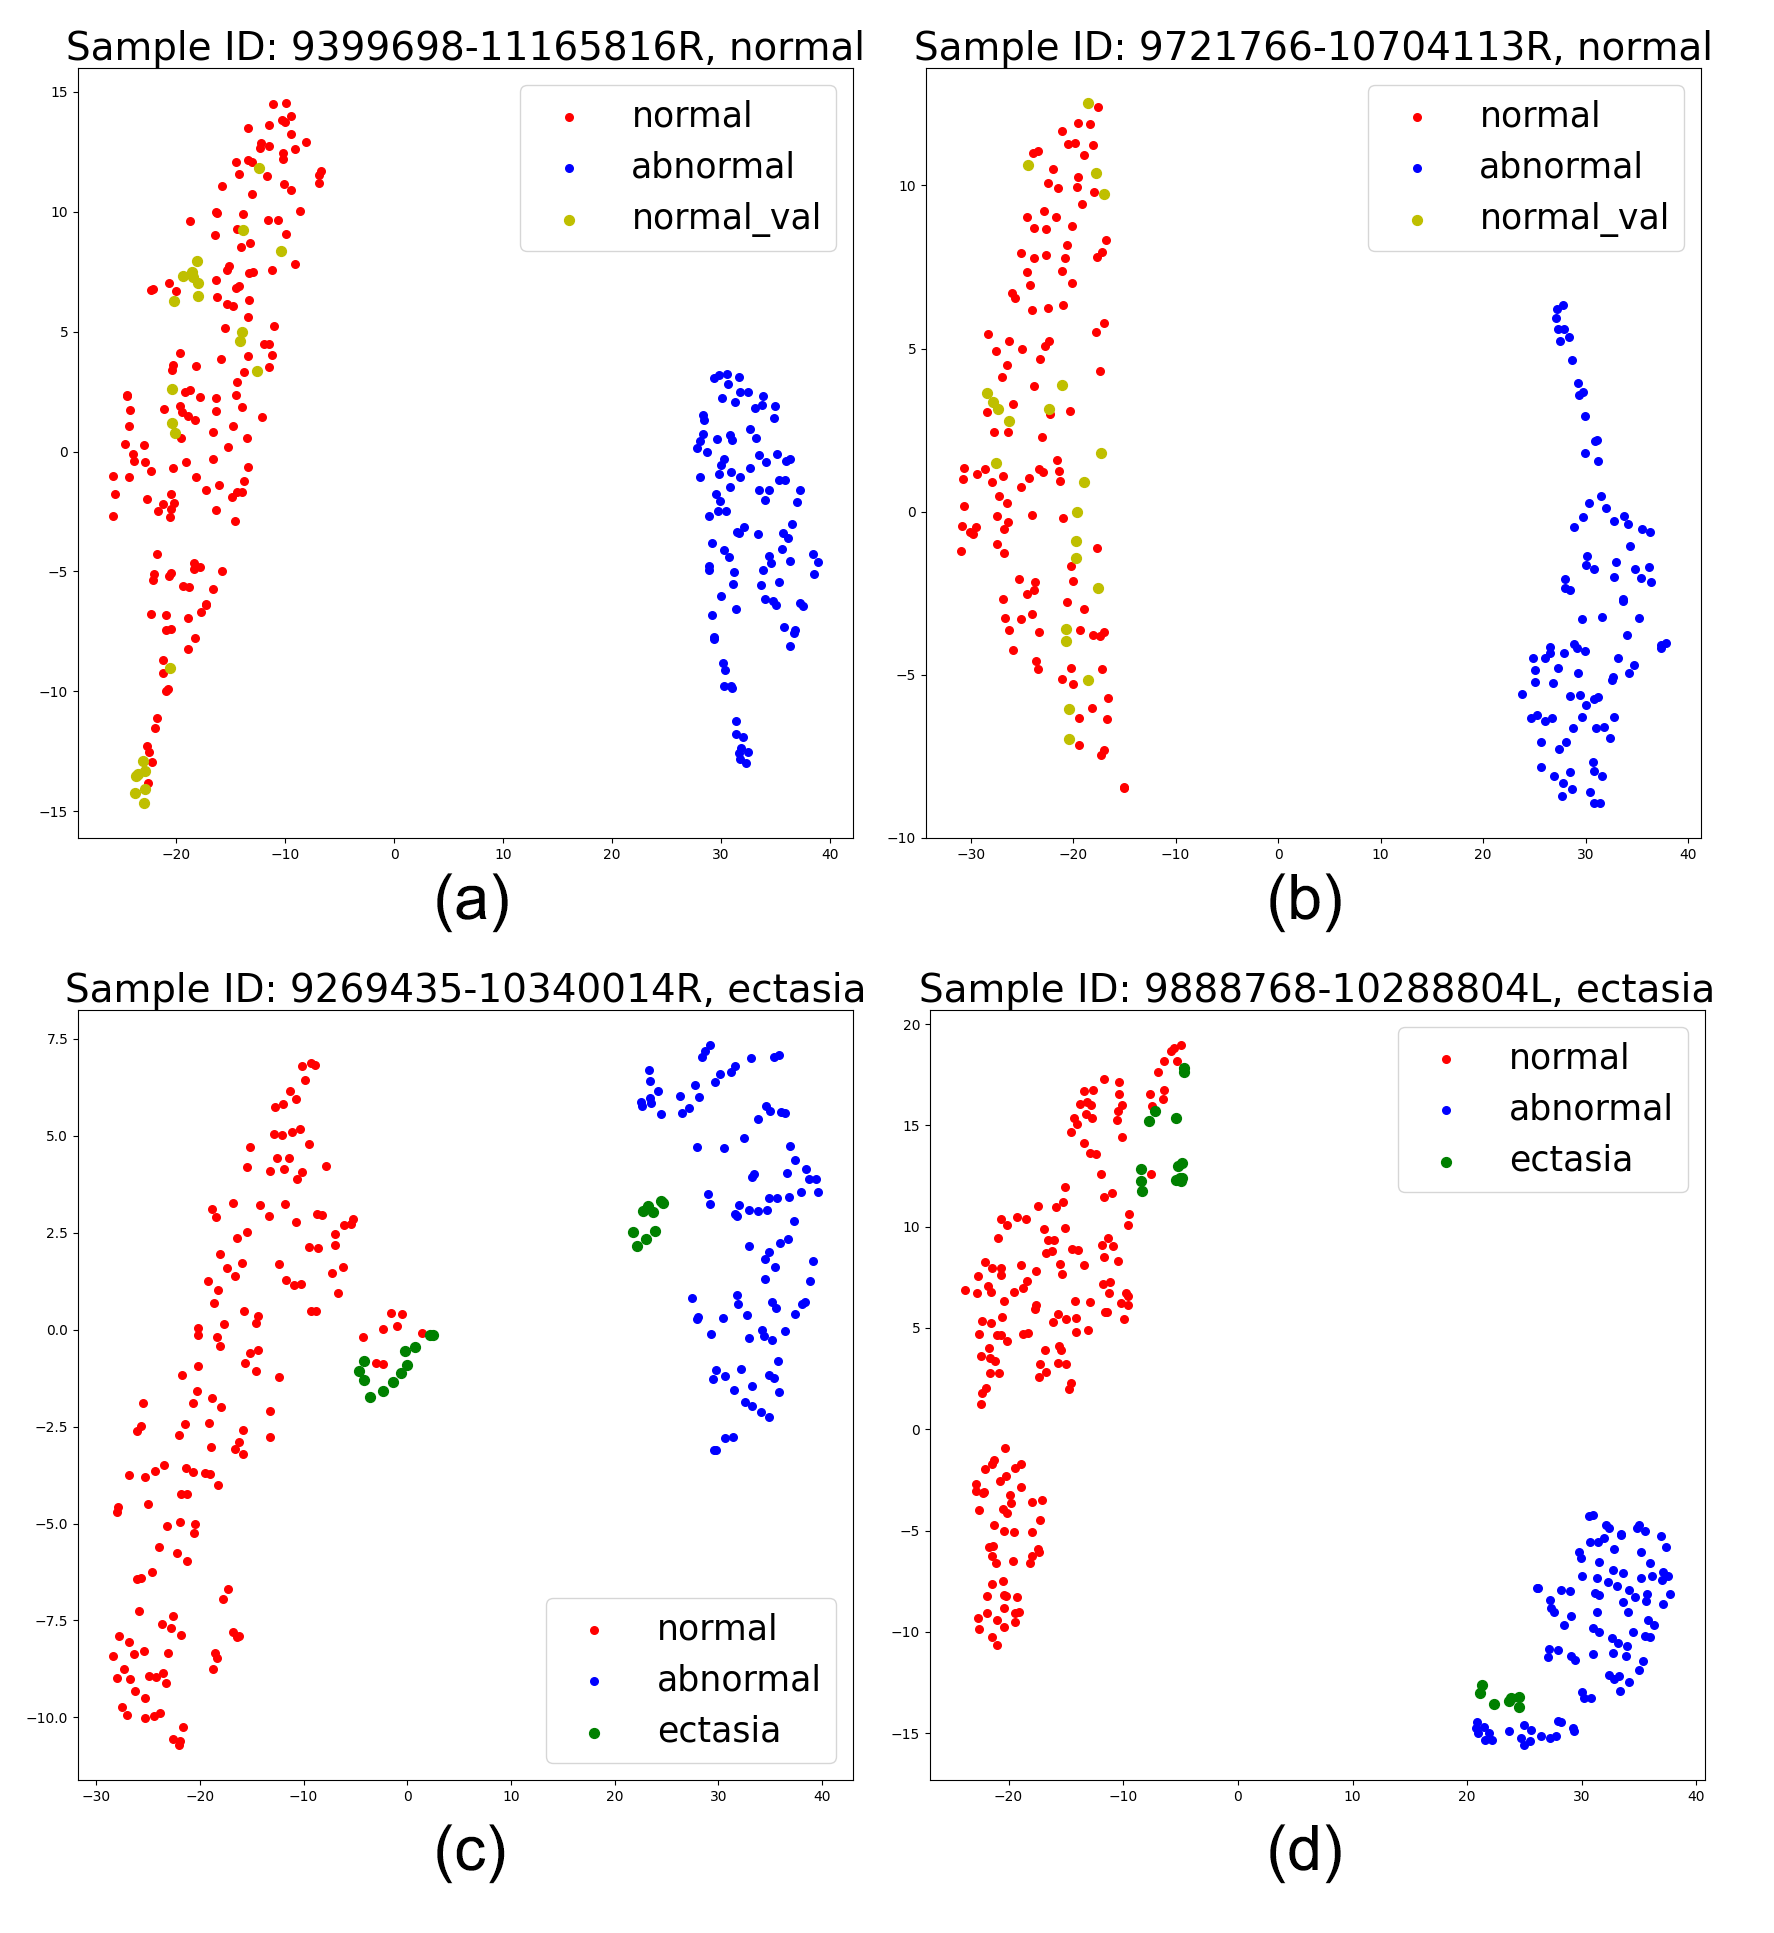
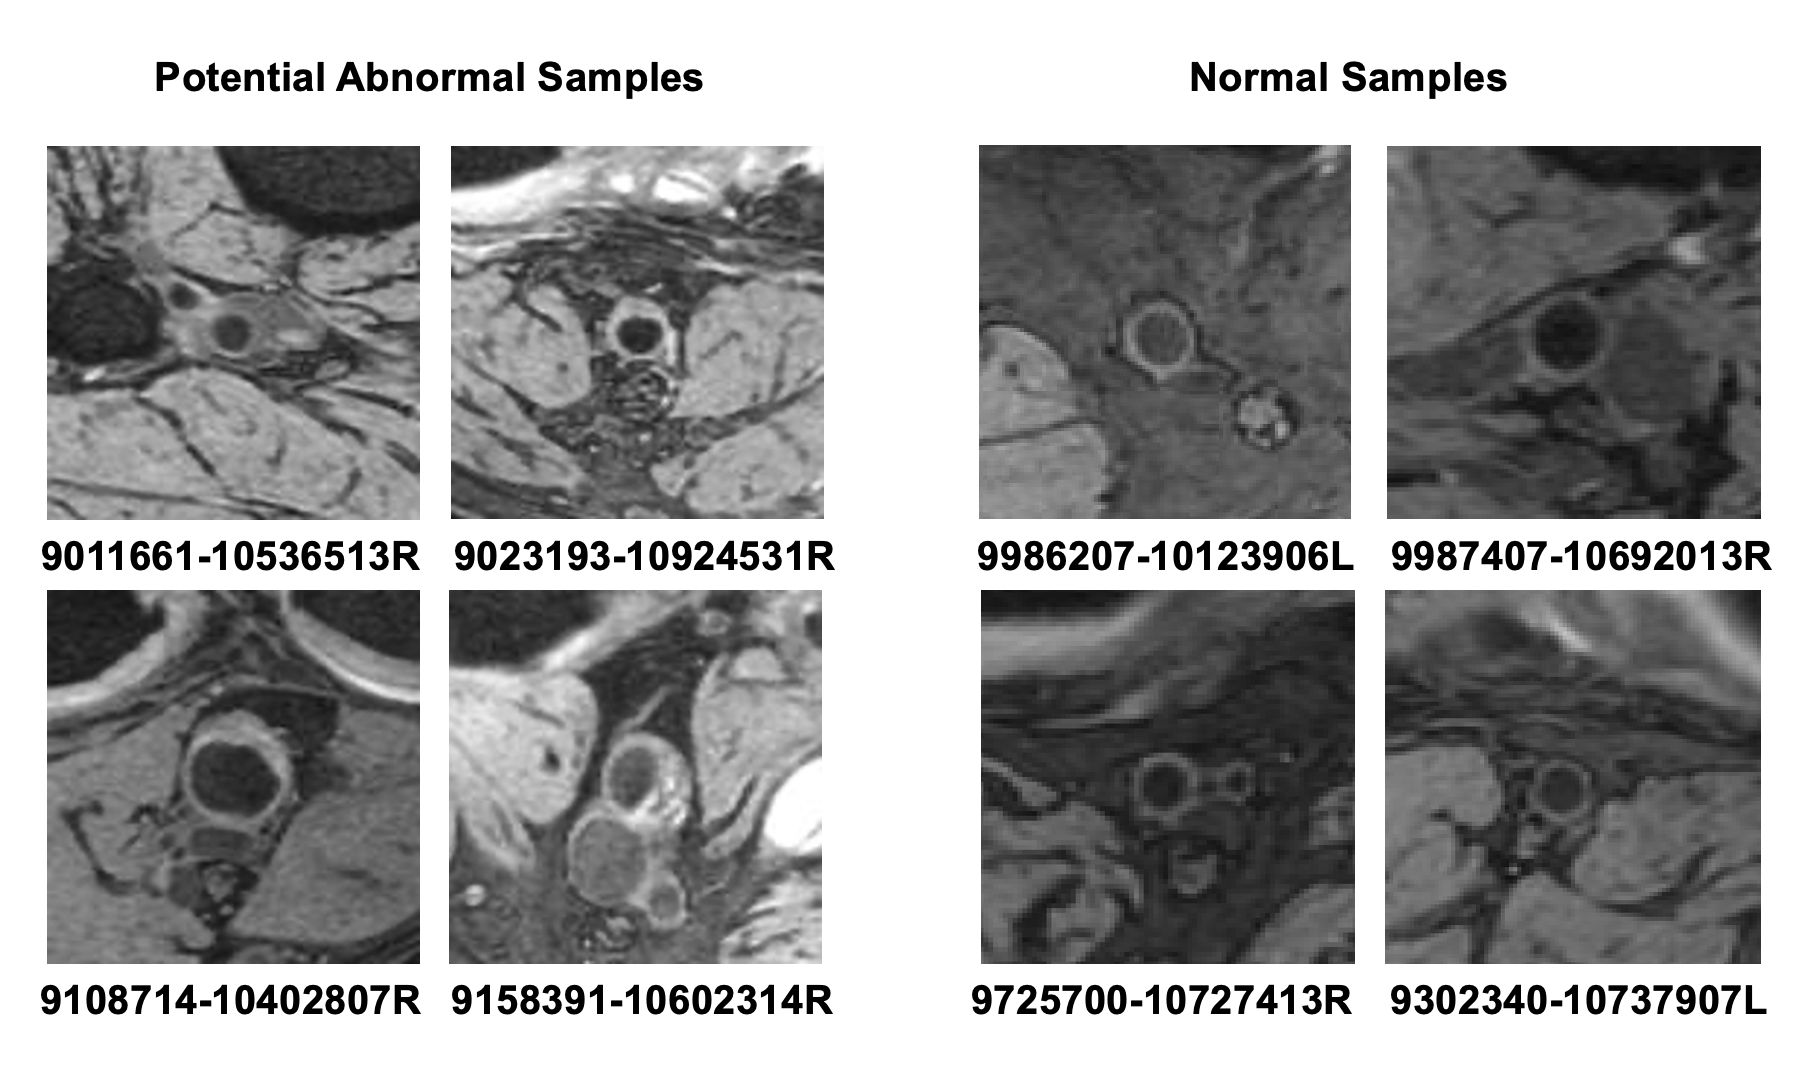
The mean(±SD) distance of all ectasia patches between the abnormal cluster center was 0.5669 (±0.2923), while the mean distance of these patches between the normal cluster center was 1.5807 (±0.2197). The p-value of 2 distance lists was 7.435e-31, demonstrating that we achieved a meaningful feature space after training. The feature map visualized by t-SNE [5] in Figure 4 also shows the meaningful distribution we realized.From the 1974 unknown samples in the OAI dataset, 116 potential abnormal samples were identified. Some samples are shown in Figure 5.
Discussion and Conclusion
Using a metric learning network and trained with data-balanced episodes, our method generates a meaningful feature space for popliteal vessel wall patches extracted from the large OAI dataset. The feature embedding was shown to be effective and useful in identifying potential artery slices with vascular diseases in the large OAI dataset with few manual annotations. The robustness of our method can be further improved by iteratively including more training samples using the proposed workflow. This approach can be extended to other vascular features and diseases where labels or training sets are of limited data.Acknowledgements
This research is supported by grants from American Heart Association (18AIML34280043).References
[1] Küker, Wilhelm, et al. "Vessel wall contrast enhancement: a diagnostic sign of cerebral vasculitis." Cerebrovascular Diseases 26.1 (2008): 23-29.
[2] Edjlali, Myriam, et al. "Vessel wall MR imaging for the detection of intracranial inflammatory vasculopathies." Cardiovascular Diagnosis and Therapy 10.4 (2020): 1108.
[3] Wu, Jiayi, et al. "Deep morphology aided diagnosis network for segmentation of carotid artery vessel wall and diagnosis of carotid atherosclerosis on black‐blood vessel wall MRI." Medical physics 46.12 (2019): 5544-5561.
[4] Liu, Wenjin, et al. "Understanding Atherosclerosis Through an Osteoarthritis Data Set: From Knee to Vessel." Arteriosclerosis, thrombosis, and vascular biology 39.6 (2019): 1018-1025.
[5] Chen, Li, et al. "Fully automated and robust analysis technique for popliteal artery vessel wall evaluation (FRAPPE) using neural network models from standardized knee MRI." Magnetic Resonance in Medicine (2020).
[6] Vinyals, Oriol, et al. "Matching networks for one shot learning." Advances in neural information processing systems. 2016.
[7] Schroff, Florian, Dmitry Kalenichenko, and James Philbin. "Facenet: A unified embedding for face recognition and clustering." Proceedings of the IEEE conference on computer vision and pattern recognition. 2015.
[8] Maaten L van der, Hinton G. Visualizing High-Dimensional Data Using t-SNE. J Mach Learn Res 2008;9:2579–2605.
Figures