2658
Deep Learning-Based ESPIRiT Reconstruction for Accelerated 2D Phase Contrast MRI: Analysis of the Impact of Reconstruction Induced Phase Errors1Department of Radiology, Stanford University, Palo Alto, CA, United States, 2Department of Bioengineering, Stanford University, Palo Alto, CA, United States, 3Department of Electrical Engineering, Stanford University, Palo Alto, CA, United States, 4Cardiovascular Institute, Stanford University, Stanford, CA, United States
Synopsis
2D PC-MRI Compressed sensing (CS) and deep learning (DL) reconstruction techniques may introduce a reconstruction induced phase bias, distinct from eddy current-induced background phase offsets, which may impact the accuracy of flow measurements if not corrected. Herein, we analyzed this reconstruction induced phase bias to determine the maximum acceleration factor that could be used with CS and DL reconstruction frameworks for 2D PC-MRI while minimizing errors in peak velocity and total flow within ±5%.
Introduction
2D Phase Contrast MRI (PC-MRI) is used to quantify blood flow throughout the cardiovascular system. Compressed sensing (CS) and deep learning (DL) enable highly under-sampled data acquisitions that can reduce breath-hold durations or increase spatio-temporal sampling1-5. Eddy current-induced fields contribute background phase offsets in 2D PC-MRI that can lead to errors6,7 in the measured phase, $$$\phi$$$: $$\phi=\phi_{V} + \phi_{E},$$ where $$$\phi_{V}$$$ is the phase from velocity and $$$\phi_{E}$$$ is eddy current-induced phase error. Errors from $$$\phi_{E}$$$ can contribute velocity offsets of several cm/s, thereby significantly impacting the accuracy of flow measurements if not corrected to ≤0.6cm/s8. An important, and overlooked, aspect of PC-MRI reconstruction algorithms is the impact on background phase offsets. Measurement accuracy can be impacted at a clinically significant level if the reconstruction introduces a phase bias, $$$\phi_{R}$$$, such that: $$\phi=\phi_{V} + \phi_{E} + \phi_{R}.$$ The non-linear nature of CS and DL reconstruction methods may produce a non-uniform $$$\phi_{R}$$$ throughout the image (i.e., inside vessel ROIs vs. static tissue), which makes correction difficult, if not impossible.When evaluating PC-MRI reconstruction methods, strict error criteria should be placed on clinically relevant measures, such as total flow and peak velocity, to ensure that $$$\phi_{R}$$$ is minimized to provide accurate clinical measurements. Herein, we analyzed how CS and DL reconstructions impact $$$\phi_{R}$$$. The objective of this work was to evaluate reconstruction induced phase bias and to determine the maximum acceleration factor for CS and DL reconstruction frameworks for 2D PC-MRI while minimizing errors on peak velocity and total flow within ±5%.
Methods
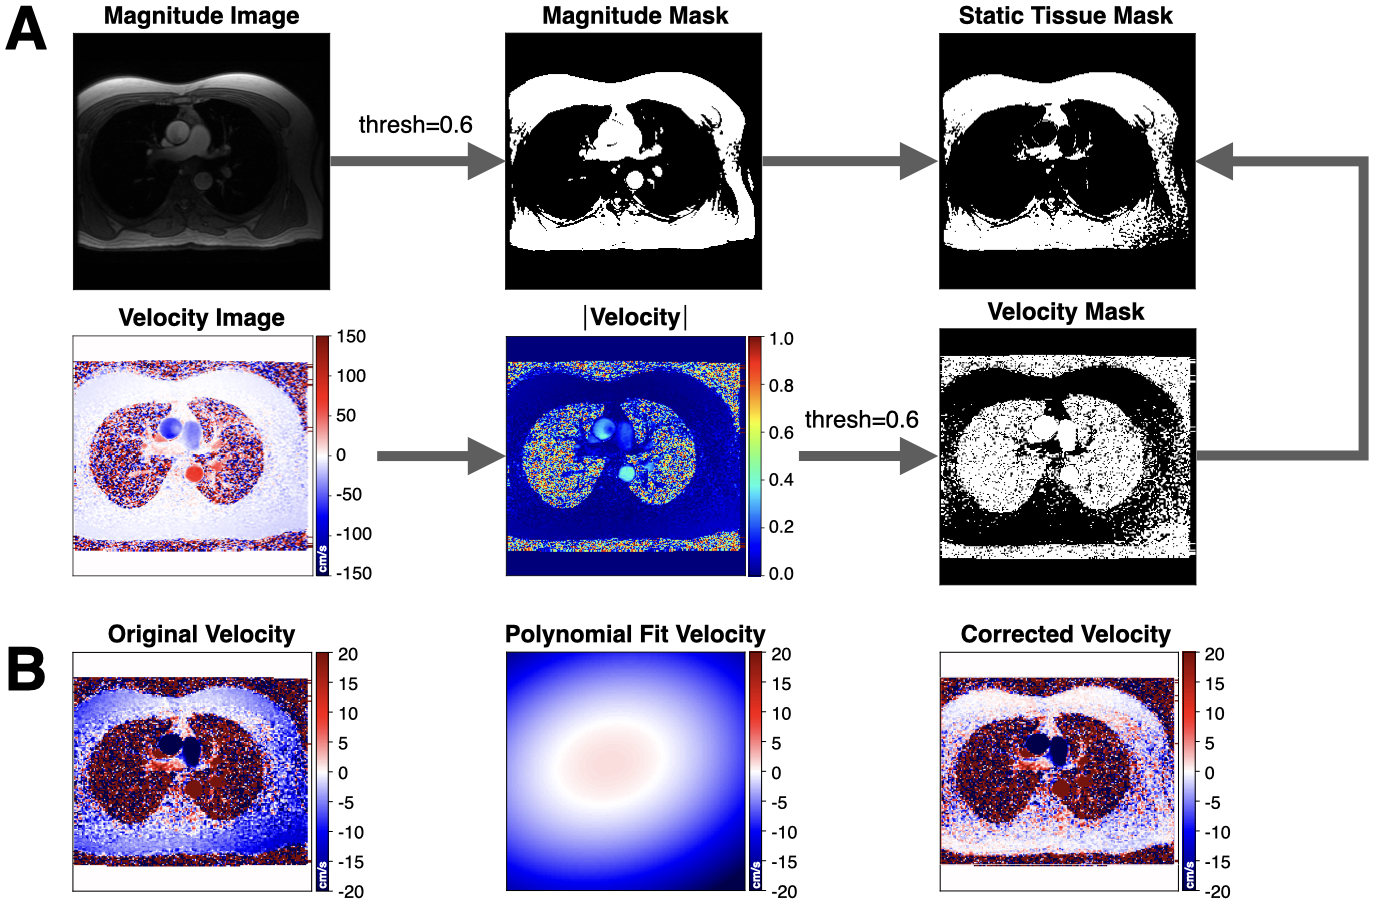
Fully sampled (FS) 2D PC-MRI datasets were acquired at 1.5T (n=171) and 3T (n=23) (GE Healthcare), with IRB approval and consent. Two previously described DL-ESPIRiT reconstruction frameworks were used to reconstruct a pair of 2D PC-MRI velocity encodings5. First, we used a DL-ESPIRiT network trained using the two PC-MRI velocity encodings, separately, which we denote as PC-DLE. Second, we used the output of PC-DLE to reconstruct the first velocity encoding, $$$I_{1}$$$, and a second network to reconstruct a complex difference (CD) image, which we denote as CD-DLE. CD-DLE aims to take advantage of the higher sparsity of the CD image relative to the individual velocity encoded images. CD-DLE was used to estimate the second velocity encoding: $$$I_{2}=CD+I_{1}$$$. Phase difference processing, $$$\angle(I_{1} \times I_{2}^{*})$$$, was used to generate the final velocity. Datasets were divided into splits of 155/10/29 (training/validation/testing) for training both networks with 10 iteration steps, 2 residual blocks, and 96 feature maps. Each network training required ~108 hours using two 24GB NVIDIA Titan RTX video cards with an NVLink Bridge. We also reconstructed images using a parallel imaging and CS algorithm known as L1-ESPIRiT (L1E)2 using the Berkeley Advanced Reconstruction Toolbox (BART, v0.4.04)9.FS datasets were retrospectively under-sampled using a variable density k-t pattern with rates ranging from 5-10x and then reconstructed using L1E, PC-DLE and CD-DLE. Reconstructed images were masked to isolate regions of flow and static tissue. A 2nd degree polynomial6 was fit to the background phase within the static tissue mask and used to estimate the background phase within the vessel ROI (Fig. 1).
To quantify the value of $$$\phi_{R}$$$, within static tissue and the vessel ROI, we computed the median and upper and lower 95% confidence intervals (95%-CIs) after a pixel-by-pixel subtraction of $$$\phi$$$ for L1E, PC-DLE and CD-DLE vs. FS. We also performed static tissue background correction and reported measures of total flow and peak velocity (calculated as the mean value of the top 5% of all pixels contained in the ROIs). Per the recommendation of Gatehouse et al.8, an accuracy threshold of ±5% was used to determine the maximum acceleration rate that could be achieved for each of the tested reconstruction methods, relative to the FS data. Specifically, we required that the 95%-CIs must be contained within the ±5% threshold (i.e., 95% of the data points must be within ±5% error).
Results
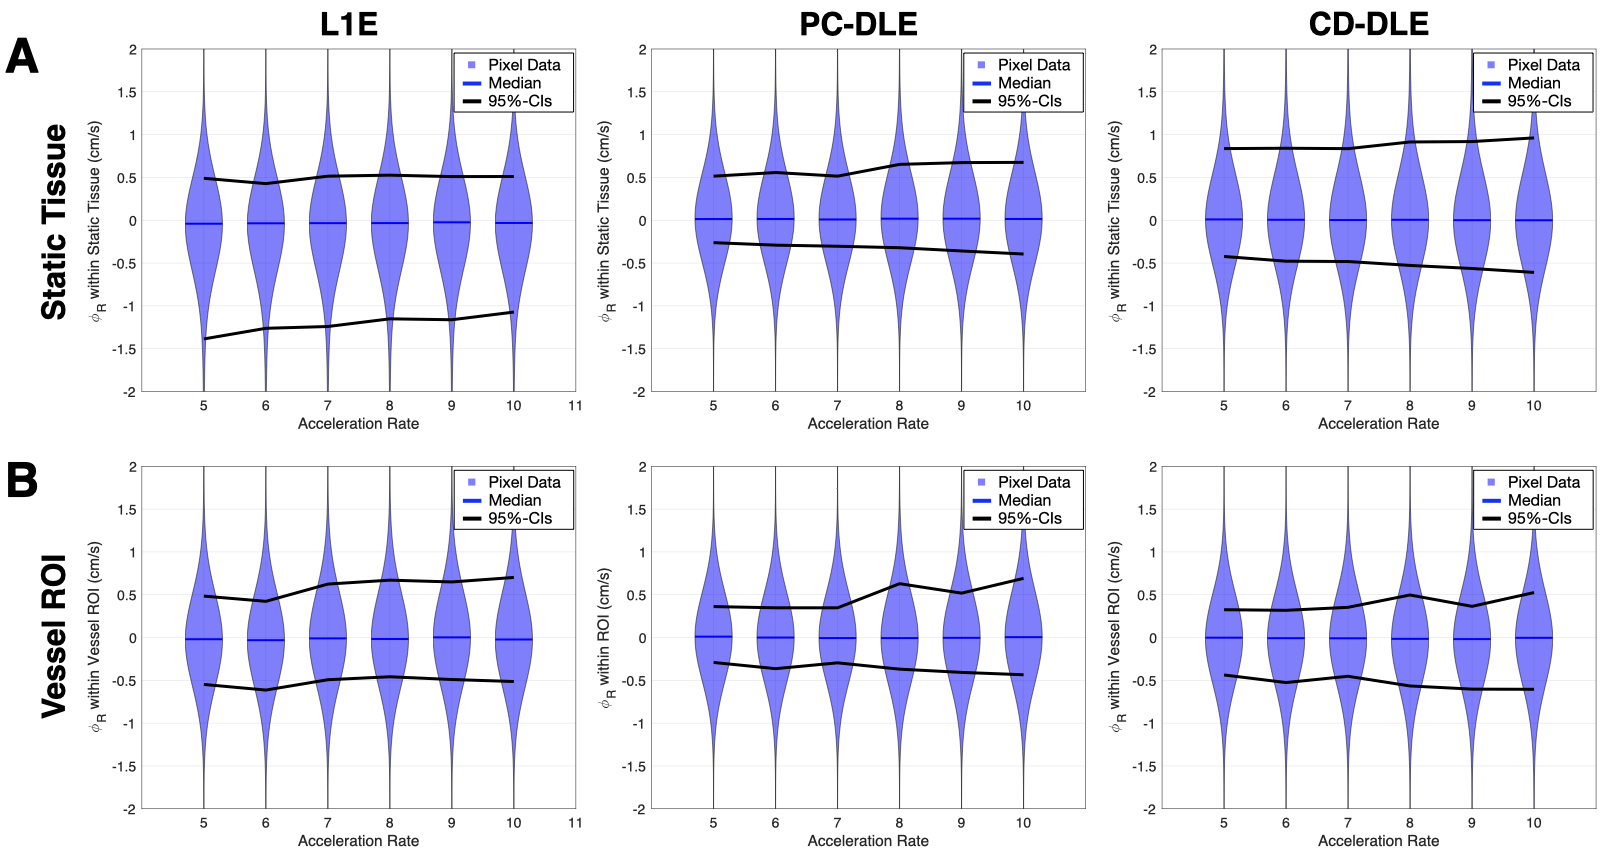
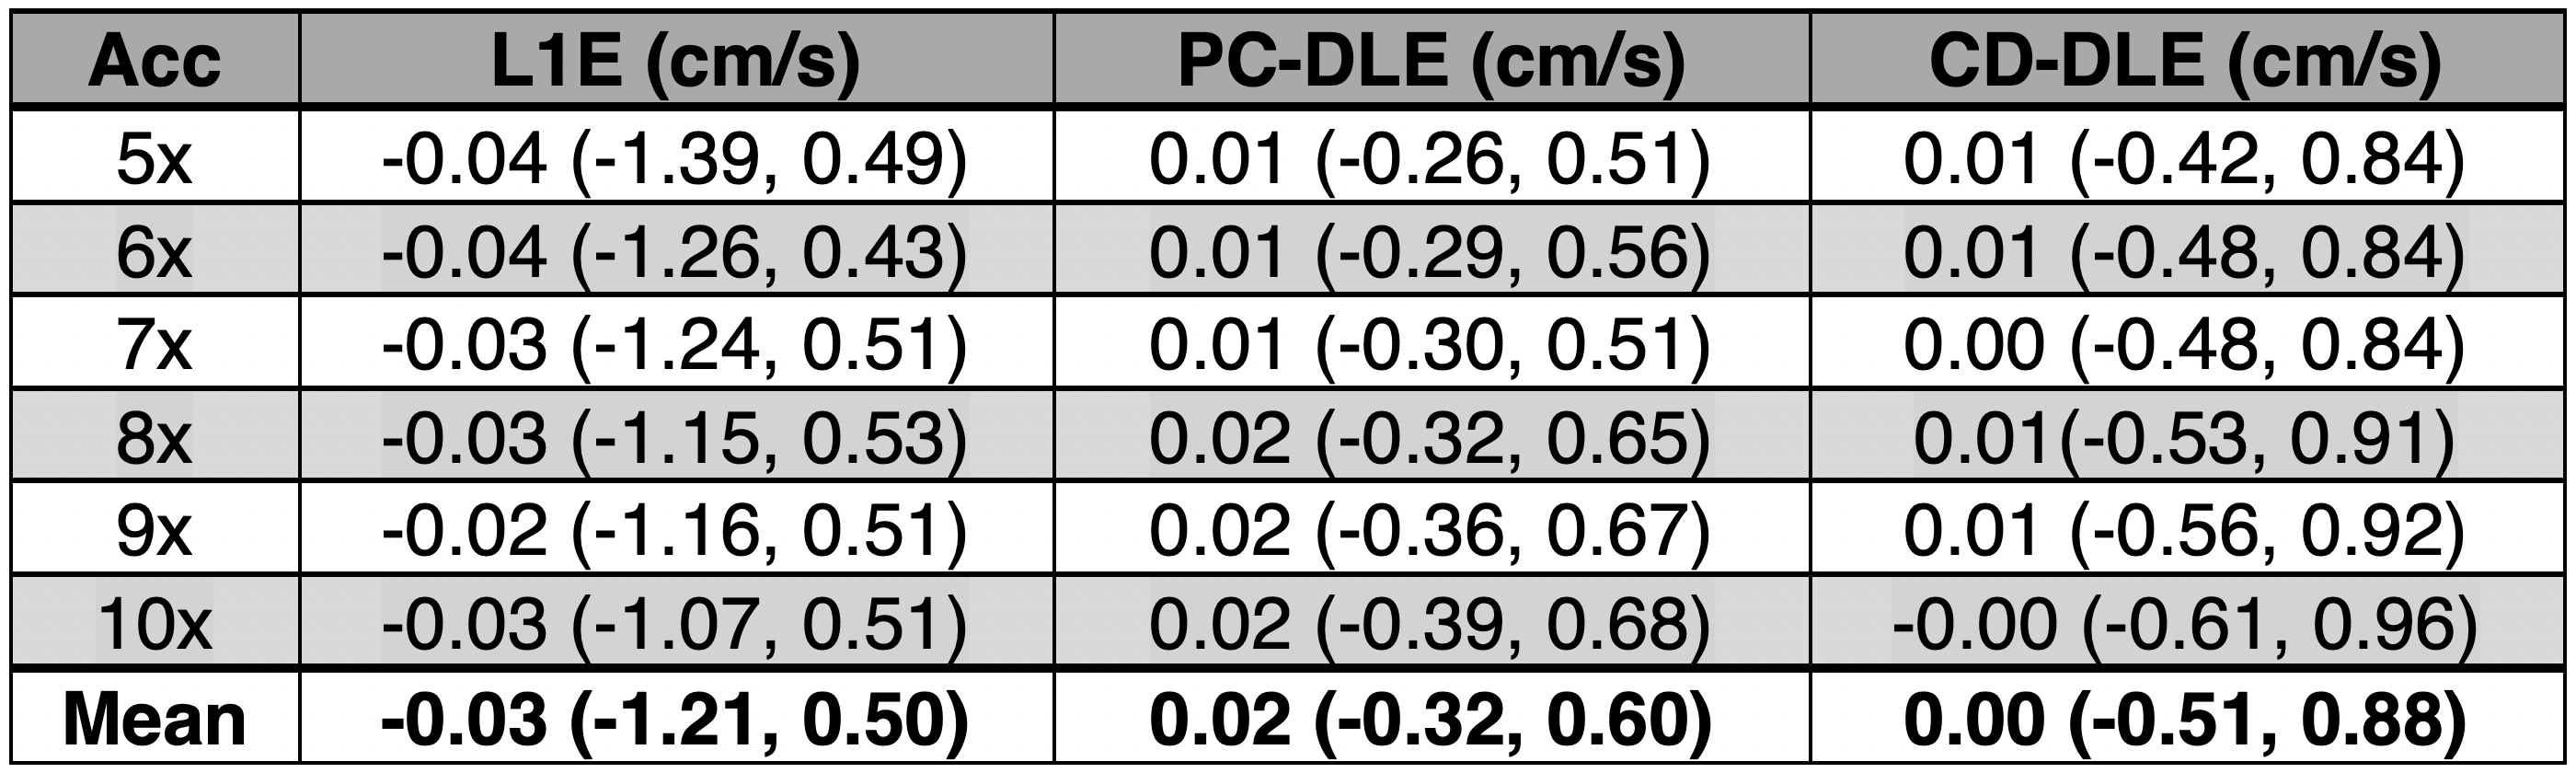
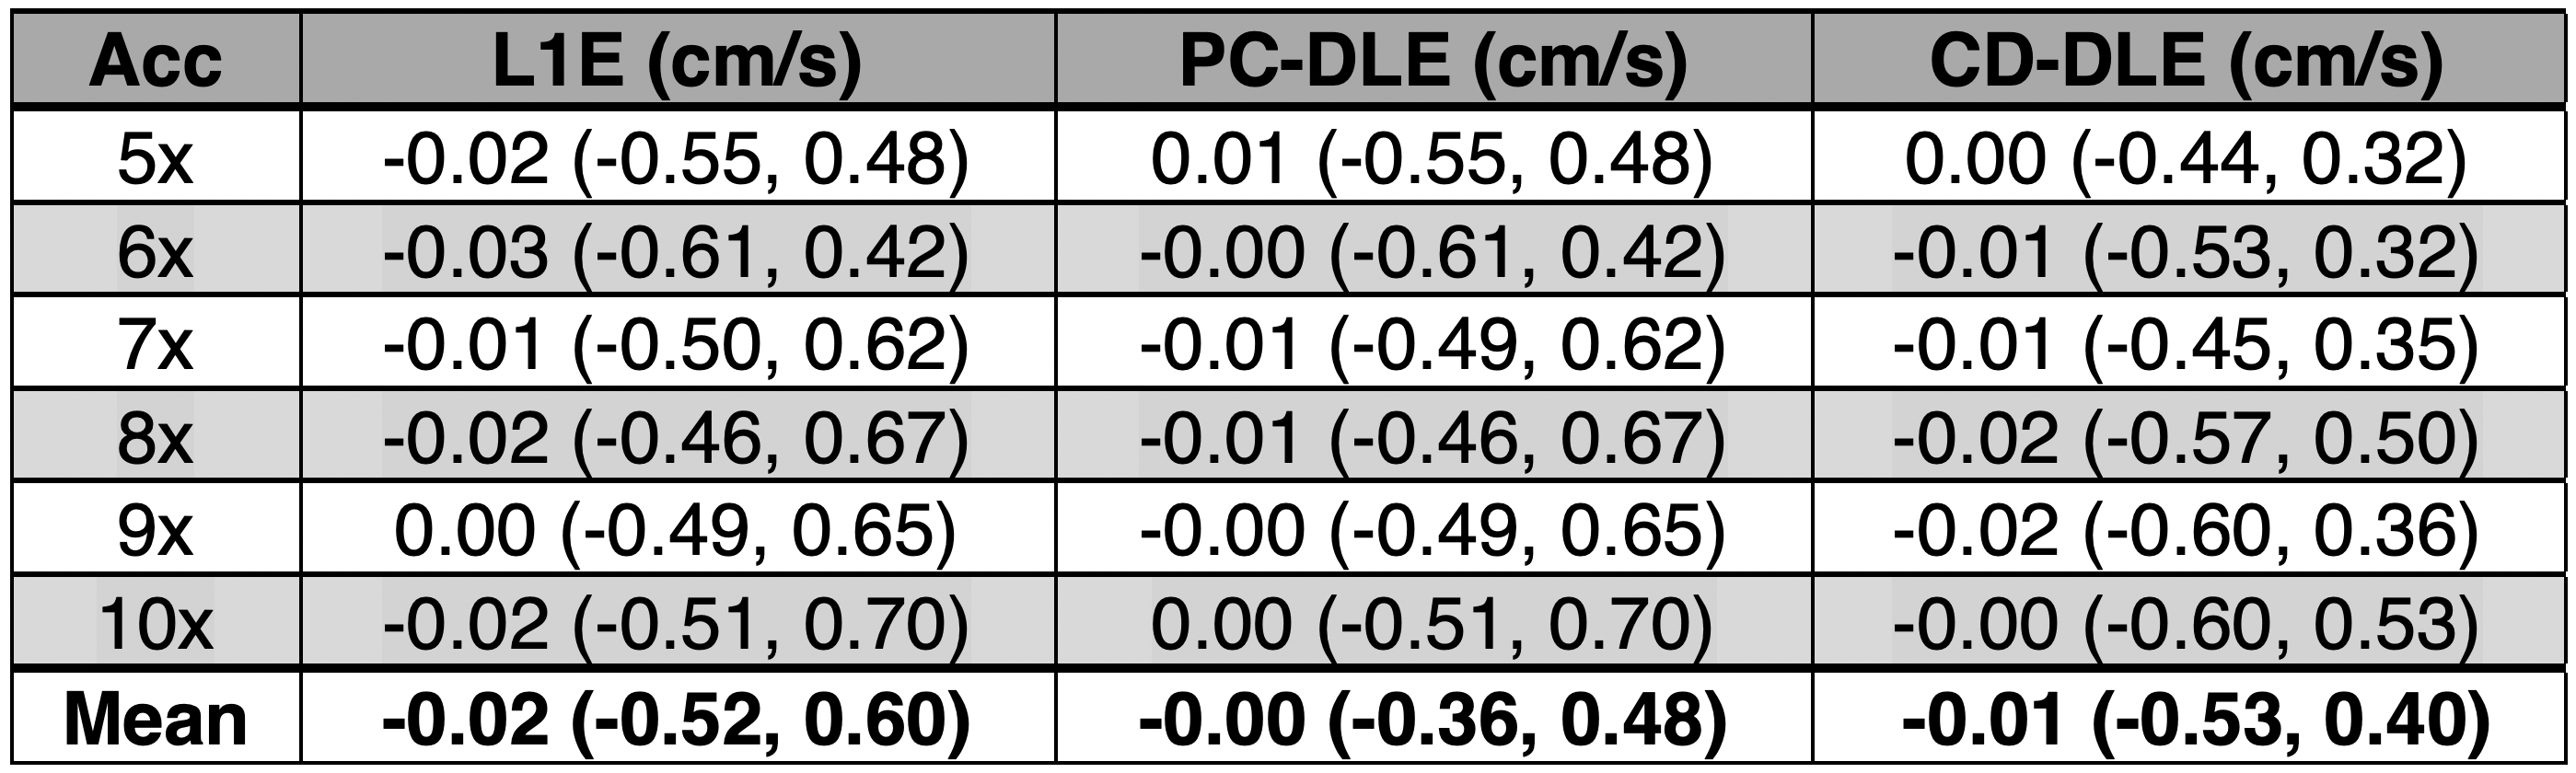
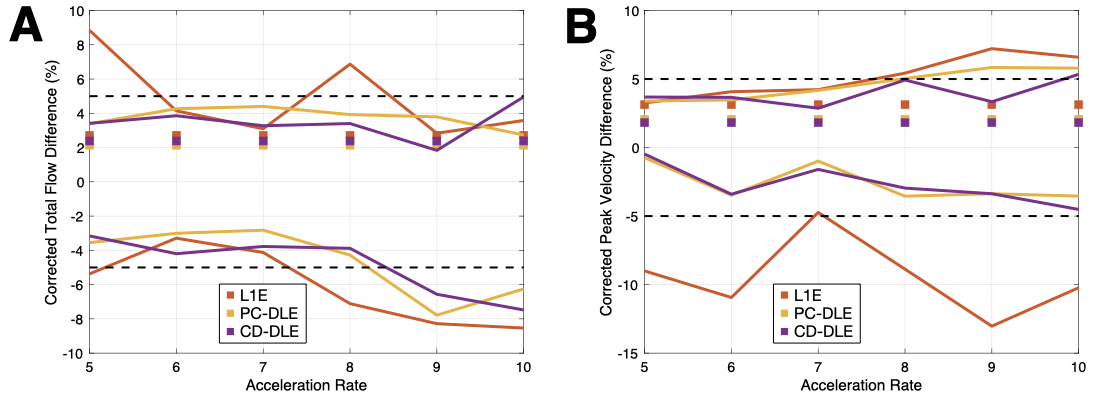
A pixel-by-pixel histogram difference was used to quantify $$$\phi_{R}$$$ (cm/s) for L1E, PC-DLE and CD-DLE within static tissue (Fig. 2A and Table 1) and inside the vessel ROIs (Fig. 2B and Table 2). Background phase offset corrected measures of total flow (mL) and peak velocity (cm/s) for L1E, PC-DLE and CD-DLE compared to FS are shown in Fig. 3.Discussion
The median $$$\phi_{R}$$$ across all accelerations was greatest for L1E followed by PC-DLE and CD-DLE. The 95%-CIs for $$$\phi_{R}$$$ across all accelerations was widest for L1E, followed by CD-DLE and PC-DLE. Clinically relevant measures of background phase offset corrected total flow and peak velocity resulted in at least 95% of the data being within ±5% of the FS data for up to 8x acceleration (Fig. 3) for both PC-DLE and CD-DLE, whereas L1E could only achieve this for accelerations of 6-7x for total flow only. Reconstruction induced phase offsets introduced by PC-MRI reconstruction methods should be thoroughly evaluated when developing new acquisition and reconstruction methods.Conclusion
PC-DLE and CD-DLE reconstructed PC-MRI images demonstrated lower reconstruction induced phase offsets compared to L1E. Furthermore, PC-DLE and CD-DLE minimized errors in peak velocity and total flow within ±5% for up to 8x acceleration while L1E minimized error in total flow for 6-7x acceleration.Acknowledgements
This project was supported, in part, by U01 EB029427 to SSV and support from GE Healthcare to DBE.References
1. Vishnevskiy V, Walheim J, Kozerke S. Deep variational network for rapid 4D flow MRI reconstruction. Nature Machine Intelligence. 2020 Apr;2(4):228-35.
2. Uecker M, Lai P, Murphy MJ, et al. ESPIRiT-an eigenvalue approach to autocalibrating parallel MRI: where SENSE meets GRAPPA. Magn Reson Med. 2014;71:990-1001.
3. Sandino CM, Lai P, Vasanawala SS, Cheng JY. Accelerating cardiac cine MRI using a deep learning‐based ESPIRiT reconstruction. Magnetic Resonance in Medicine. 2020 Jul 22.
4. Sandino CM, Cheng JY, Chen F, Mardani M, Pauly JM, Vasanawala SS. Compressed sensing: from research to clinical practice with deep neural networks. IEEE Signal Process Mag. 2020;37:117‐127.
5. Oscanoa JA, Middione MJ, Sandino CM, Vasanawala SS, Ennis DB. Accelerated 2D Phase Contrast MRI using deep learning-based reconstruction and direct complex difference estimation. SCMR 23rd Annual Meeting, Orlando, Florida, 2020.
6. Lankhaar JW, Hofman MB, Marcus JT, Zwanenburg JJ, Faes TJ, Vonk‐Noordegraaf A. Correction of phase offset errors in main pulmonary artery flow quantification. Journal of Magnetic Resonance Imaging: An Official Journal of the International Society for Magnetic Resonance in Medicine. 2005 Jul;22(1):73-9.
7. Fratz S, Chung T, Greil GF, Samyn MM, Taylor AM, Buechel ER, Yoo SJ, Powell AJ. Guidelines and protocols for cardiovascular magnetic resonance in children and adults with congenital heart disease: SCMR expert consensus group on congenital heart disease. Journal of Cardiovascular Magnetic Resonance. 2013 Dec 1;15(1):51.
8.Gatehouse PD, Rolf MP, Bloch KM, Graves MJ, Kilner PJ, Firmin DN, Hofman MB. A multi-center inter-manufacturer study of the temporal stability of phase-contrast velocity mapping background offset errors. Journal of Cardiovascular Magnetic Resonance. 2012 Dec 1;14(1):72.
9. Uecker M, Ong F, Tamir JI, et al. Berkeley advanced reconstruction toolbox. In: Proceedings of 23rd Annual Meeting of the International Society of Magnetic Resonance in Medicine, Toronto, Ontario, Canada, 2015. p. 2486.
Figures