2652
Sensitivity of a Deep Learning Model for Multi-Sequence Cardiac Pathology Segmentation to Input Data Transformations
Markus J Ankenbrand1, Liliya Shainberg1, Michael Hock1, David Lohr1, and Laura Maria Schreiber1
1Chair of Cellular and Molecular Imaging, Comprehensive Heart Failure Center (CHFC), University Hospital Würzburg, Würzburg, Germany
1Chair of Cellular and Molecular Imaging, Comprehensive Heart Failure Center (CHFC), University Hospital Würzburg, Würzburg, Germany
Synopsis
Deep learning-based segmentation models play an important role in cardiac magnetic resonance imaging. While their performance is good on the training and validation data the models themselves are hard to interpret. Sensitivity analysis helps to estimate the effect of different data characteristics on segmentation performance. We demonstrate that a published model exhibits higher sensitivity to basic transformations like rotation for pathology classes than for tissue classes in general.
Introduction
Segmentation is an important task in the analysis of cardiac magnetic resonance (CMR) images1,2,3. Both functional parameters like ventricular volume and ejection fraction as well as quantitative measures for pathologies like scar volume are derived from it4,5. Done manually, it is time-consuming and subjective. Therefore, semi-automatic and automatic methods for CMR segmentation have been developed4,5,6. Recently, artificial neural networks have shown promising performance comparable to human operators in many instances3,4,5. However, these models are largely considered black boxes as there is no easy way to explain why the model made a certain prediction2,7. In consequence it is very hard to predict the model performance on novel data.Methods
The general idea behind sensitivity analysis (SA) is to learn something about how a model works by looking at the output for certain inputs7. More specifically, a representative input is used and transformed in a controlled manner (e.g. rotated). A separate prediction is generated from the model for each transformed instance. How much these predictions differ depending on the parameter of the transformation (e.g. rotation angle) indicates how sensitive the model reacts to this specific transformation. Beside general image transformations also domain specific transformations (e.g. simulation of MR artifacts) can be studied8. We apply a recently published tool for SA for segmentation7 on a model developed for the myocardial pathology segmentation combining multi-sequence CMR challenge (MyoPS 2020)6. The data consists of three different imaging modalities (LGE, T2-weighted, CINE) pre-registered into a common coordinate space9,10. The model uses these sequences as color chhannels to make pixel-wise predictions for five classes of interest, i.e. left ventricle (LV), right ventricle (RV), myocardium (MY), edema, and scar (Figure 1). We evaluated the sensitivity of this model to rotation, cropping, zooming, birghtness and contrast both qualitatively and quantitatively. For quantitative evaluation Dice-scores between the prediction and the (potentially transformed) ground truth mask are calculated for each class separately11.Results
Qualitative assessment of the effect of the five transformations on segmentation performance (Figure 2) reveals high robustness for the classes LV, RV and MY while the sensitivity for edema and scar appears to be much higher. This finding is also verified quantitatively for rotation, zooming and brightness transformations (Figure 3). In all these cases dice scores remain high throughout the parameter space for LV, RV, and MY while they drop when moving from the default value for edema and scar with a more pronounced effect for edema.Discussion
The most interesting finding of the SA of this model is the differential effect of the transformations on the segmentation performance of the different classes. The qualitative images in Figure 2 show, that the quantitative drop in Dice-scores (Figure 3) is not only an effect of smaller total area for edema and scar. The relatively low sensitivity of the model in general can be explained by the use of extensive data augmentation during training. However, that does not explain why pathology classes are more sensitive than other classes. This indicates that for these classes the model has not learned robust features to identify them and therefore has to rely on specific features that might disappear when the input image is transformed. Furthermore, the general structure, LV, RV and MY are detectable on images from all sequences and therefore encoded in all color channels while pathology classes can only reliably discriminated by the channel for the dedicated sequence (LGE for scar and T2-weighted for edema). A potential follow-up analysis is evaluating the effect of color shifts (different weighting of the color channels) on segmentation of pathology classes in particular.Conclusion
Sensitivity analysis is a suitable tool to analyze the robustness of a deep learning-based model to differences in data characteristics. In this particular case it reveals high robustness for classes of healthy tissue but high sensitivity regarding pathology classes, i.e. edema and scar. The model and code to repeat and extend this analysis is available online at https://github.com/chfc-cmi/misas.Acknowledgements
Financial support: German Ministry of Education and Research (BMBF, grant: 01EO1504).References
- Baumgartner CF, Koch LM, Pollefeys M, et al. An Exploration of 2D and 3D Deep Learning Techniques for Cardiac MR Image Segmentation. In: International Workshop on Statistical Atlases and Computational Models of the Heart. pp. 111-119. Springer. 2017
- Chen C, Qin C, Qiu H, et al. Deep learning for cardiac image segmentation: A review. Frontiers in Cardiovascular Medicine. 2020;7:25. 2020
- Litjens G, Ciompi F, Wolterink JM et al. State-of-the-Art Deep Learning in Cardiovascular Image Analysis. JACC: Cardiovascular Imaging. 12(8,1):1549-65. 2019
- Bai W, Sinclair M, Tarroni G, et al. Automated cardiovascular magnetic resonance image analysis with fully convolutional networks. Journal of Cardiovascular Magnetic Resonance 20. 2018
- Zabihollahy F, White JA, Ukwatta E. Convolutional neural network-based approach for segmentation of left ventricle myocardial scar from 3D late gadolinium enhancement MR images. Med Phys 46, 1740-1751. 2019
- Ankenbrand M, Lohr D, Schreiber LM. Exploring Ensemble Applications for Multi-sequence Myocardial Pathology Segmentation. In: Zhuang X et al. (eds) Myocardial Pathology Segmentation Combining Multi-Sequence Cardiac Magnetic Resonance Images: First Challenge, MyoPS 2020, Held in Conjunction with MICCAI 2020, Lima, Peru, October 4, 2020, Proceedings. Lecture Notes in Computer Science, vol 12554. Springer International Publishing; doi:10.1007/978-3-030-65651-5. 2021.
- Ankenbrand MJ, Shainberg L, Hock M et al. Sensitivity Analysis for Interpretation of Machine Learning Based Segmentation Models in Cardiac MRI, PREPRINT (Version 1) available at Research Square. 2020
- Pérez-García F, Sparks R, Ourselin S. TorchIO: a Python library for efficient loading, preprocessing, augmentation and patch-based sampling of medical images in deep learning. ArXiv:2003.04696. 2020
- Zhuang X. Multivariate mixture model for cardiac segmentation from multi-sequence MRI. In: International Conference on Medical Image Computing and Computer-Assisted Intervention. pp. 581-588. Springer. 2016
- Zhuang X: Multivariate mixture model for myocardial segmentation combining multi-source images. IEEE transactions on pattern analysis and machine intelligence 41(12), 2933-2946. 2019
- Zijdenbos AP, Dawant BM, Margolin RA, Palmer AC. Morphometric analysis of white matter lesions in MR images: method and validation. IEEE transactions on medical imaging. 13(4):716-724. 1994
Figures
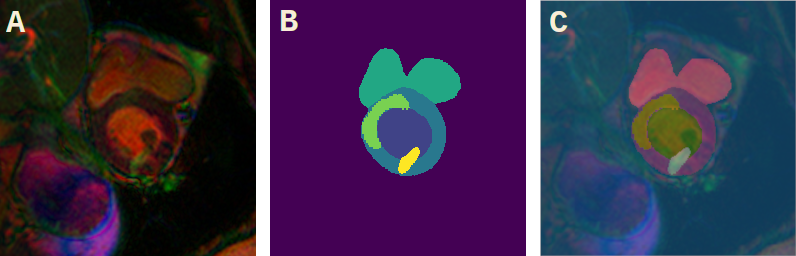
Example
Image from the myocardial pathology segmentation challenge - MyoPS
2020 - data set. A: combined multi-sequence data with each sequence
as color channel, red: green: blue: . B: True segmentation for
classes: background (purple),
left ventricle (dark
blue),
right ventricle (turquois),
myocardium (blue),
edema (green) and scar (yellow). C: Overlay of true segmentation mask
over multi-sequence image.
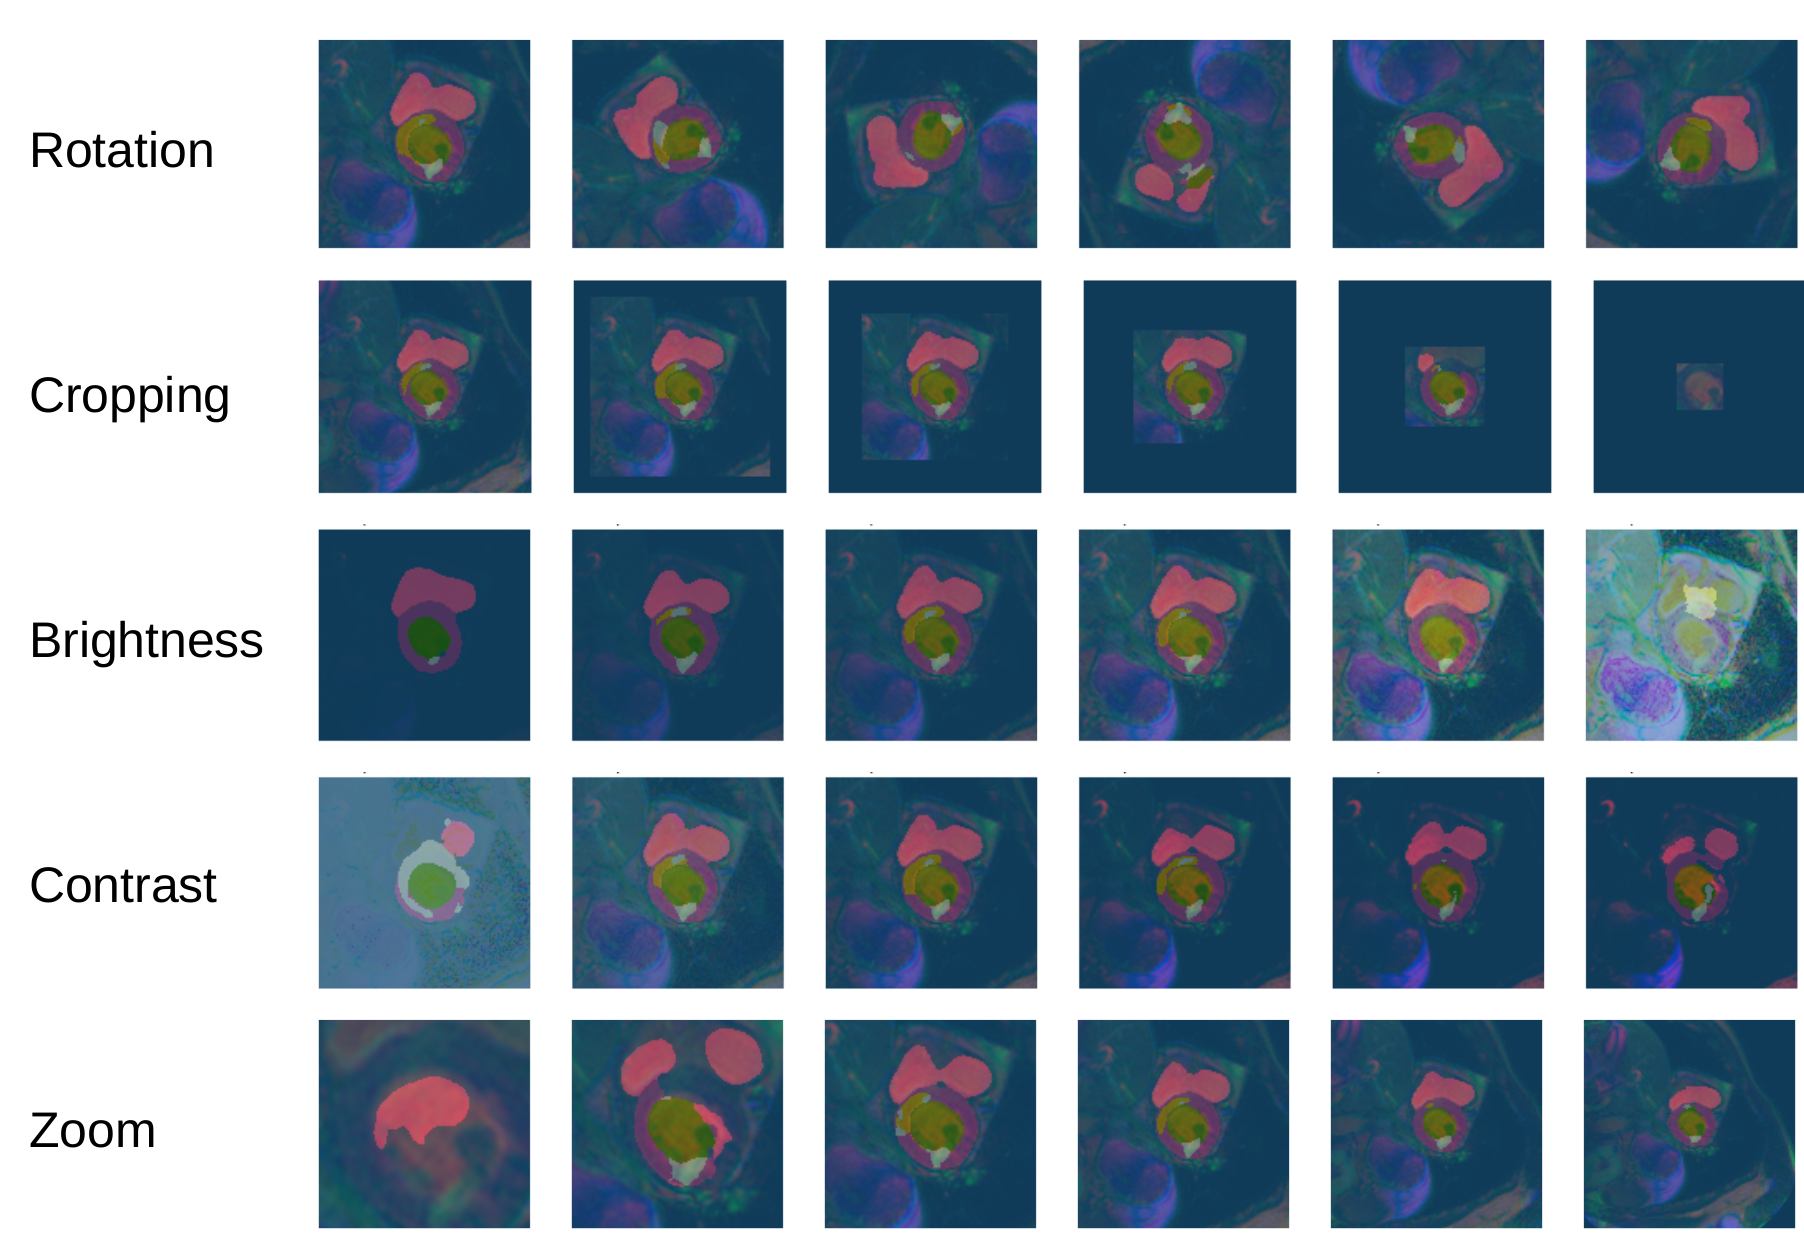
Overlay of predicted segmentation masks over transformed versions of an input
image. Each row has images with the same transformation
but different parameters (e.g. first row rotations by different
angles). The ground truth segmentation mask for this image is shown
in Figure 1.
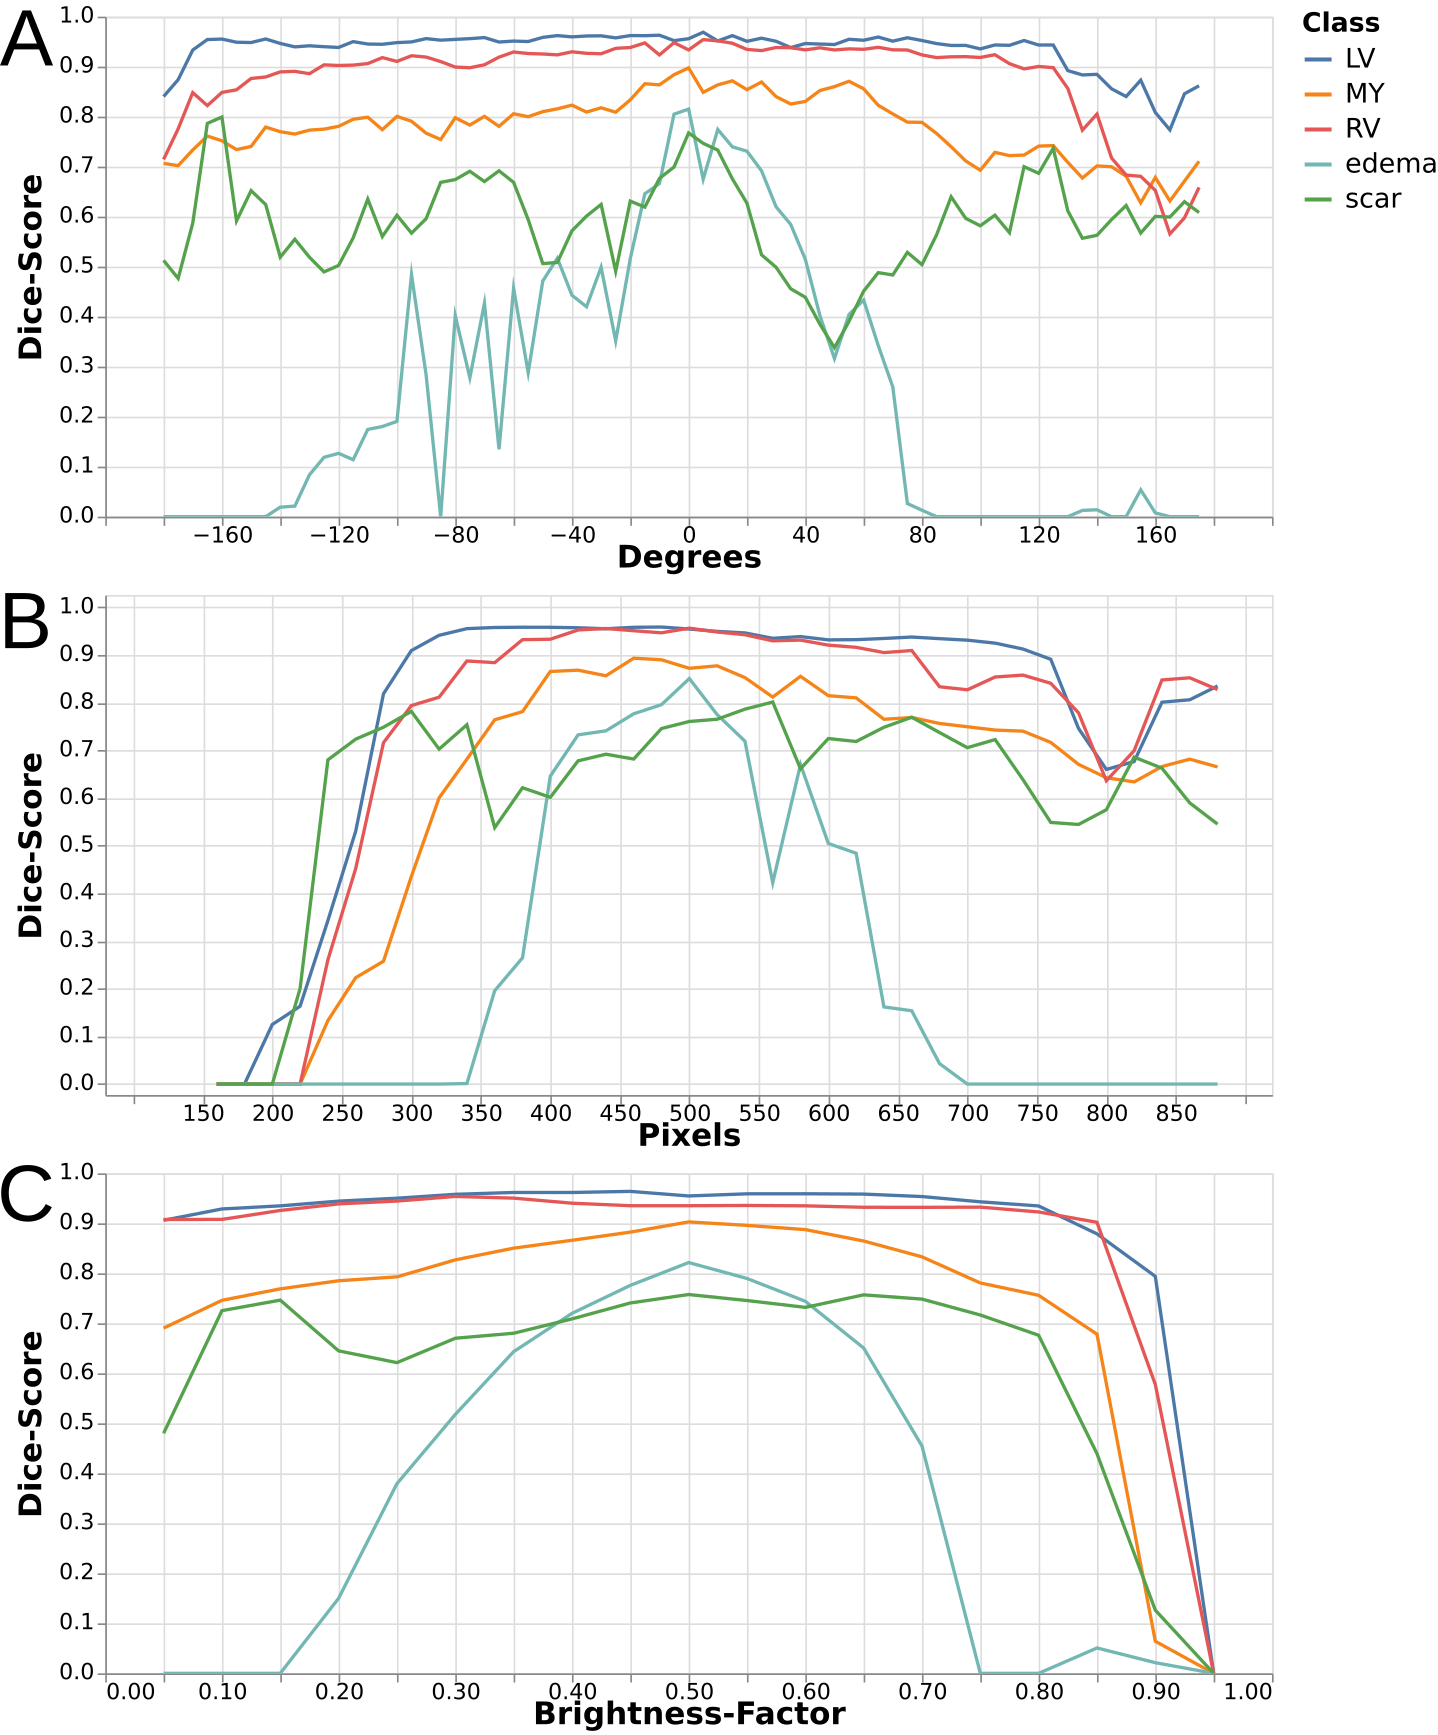
Quantitative
effect on the dice score for each class over the parameter space of
three transformations. A: Rotation, positive values denote a rotation
counter-clockwise while negative ones denote a rotation clockwise. B:
Zoom, a value of 480px is the default scale. Larger values mean
zooming out while smaller values mean zooming in. C: Brightness, a
value of 0.5 denotes no change in brightness while a value of 0 means
completely dark (all black) and 1 means full brightness (all white).