2649
Identification of Hemodynamic Biomarkers for Bicuspid Aortic Valve Patients using Machine Learning1Biomedical Imaging Center, School of Engineering, Pontificia Universidad Católica de Chile, Santiago, Chile, 2Electrical Engineering Department, School of Engineering, Pontificia Universidad Católica de Chile, Santiago, Chile, 3Millennium Nucleus for Cardiovascular Magnetic Resonance, Santiago, Chile, 4School of Biomedical Engineering, Universidad de Valparaíso, Valparaíso, Chile, 5Department of Cardiology, Hospital Universitari Vall d’Hebron, Vall d’Hebron Institut de Recerca (VHIR), Universitat Autònoma de Barcelona, Barcelona, Spain, 6Radiology Department, School of Medicine, Pontificia Universidad Católica de Chile, Santiago, Chile
Synopsis
The clinical significance and economic burden of bicuspid aortic valve (BAV) disease justify the need for improved clinical guidelines and more robust therapeutic modalities. Recent advances in medical imaging have demonstrated the existence of altered hemodynamics in these patients. To identify hemodynamic biomarkers for BAV patients, we present a machine learning method consisting of a feature selection mechanism to classify healthy volunteers and BAV patients accurately.
Introduction
Bicuspid aortic valve (BAV) is the most common congenital cardiac defect1. A significant number of patients present aortic dilation, which is associated with complications, such as aortic dissection or rupture2. The latest studies suggest that BAV patients present altered blood flow in the ascending aorta as outflow jet, helix, and vortex flow3-4. These hemodynamic alterations may lead to changes in hemodynamic parameters5. Therefore, there is a need for new hemodynamic biomarkers to refine disease monitoring and improve patient risk stratification. To identify hemodynamic biomarkers for BAV patients, we performed a machine learning model, capable to recognize volunteers and patients and discretize possible biomarkers.Methods
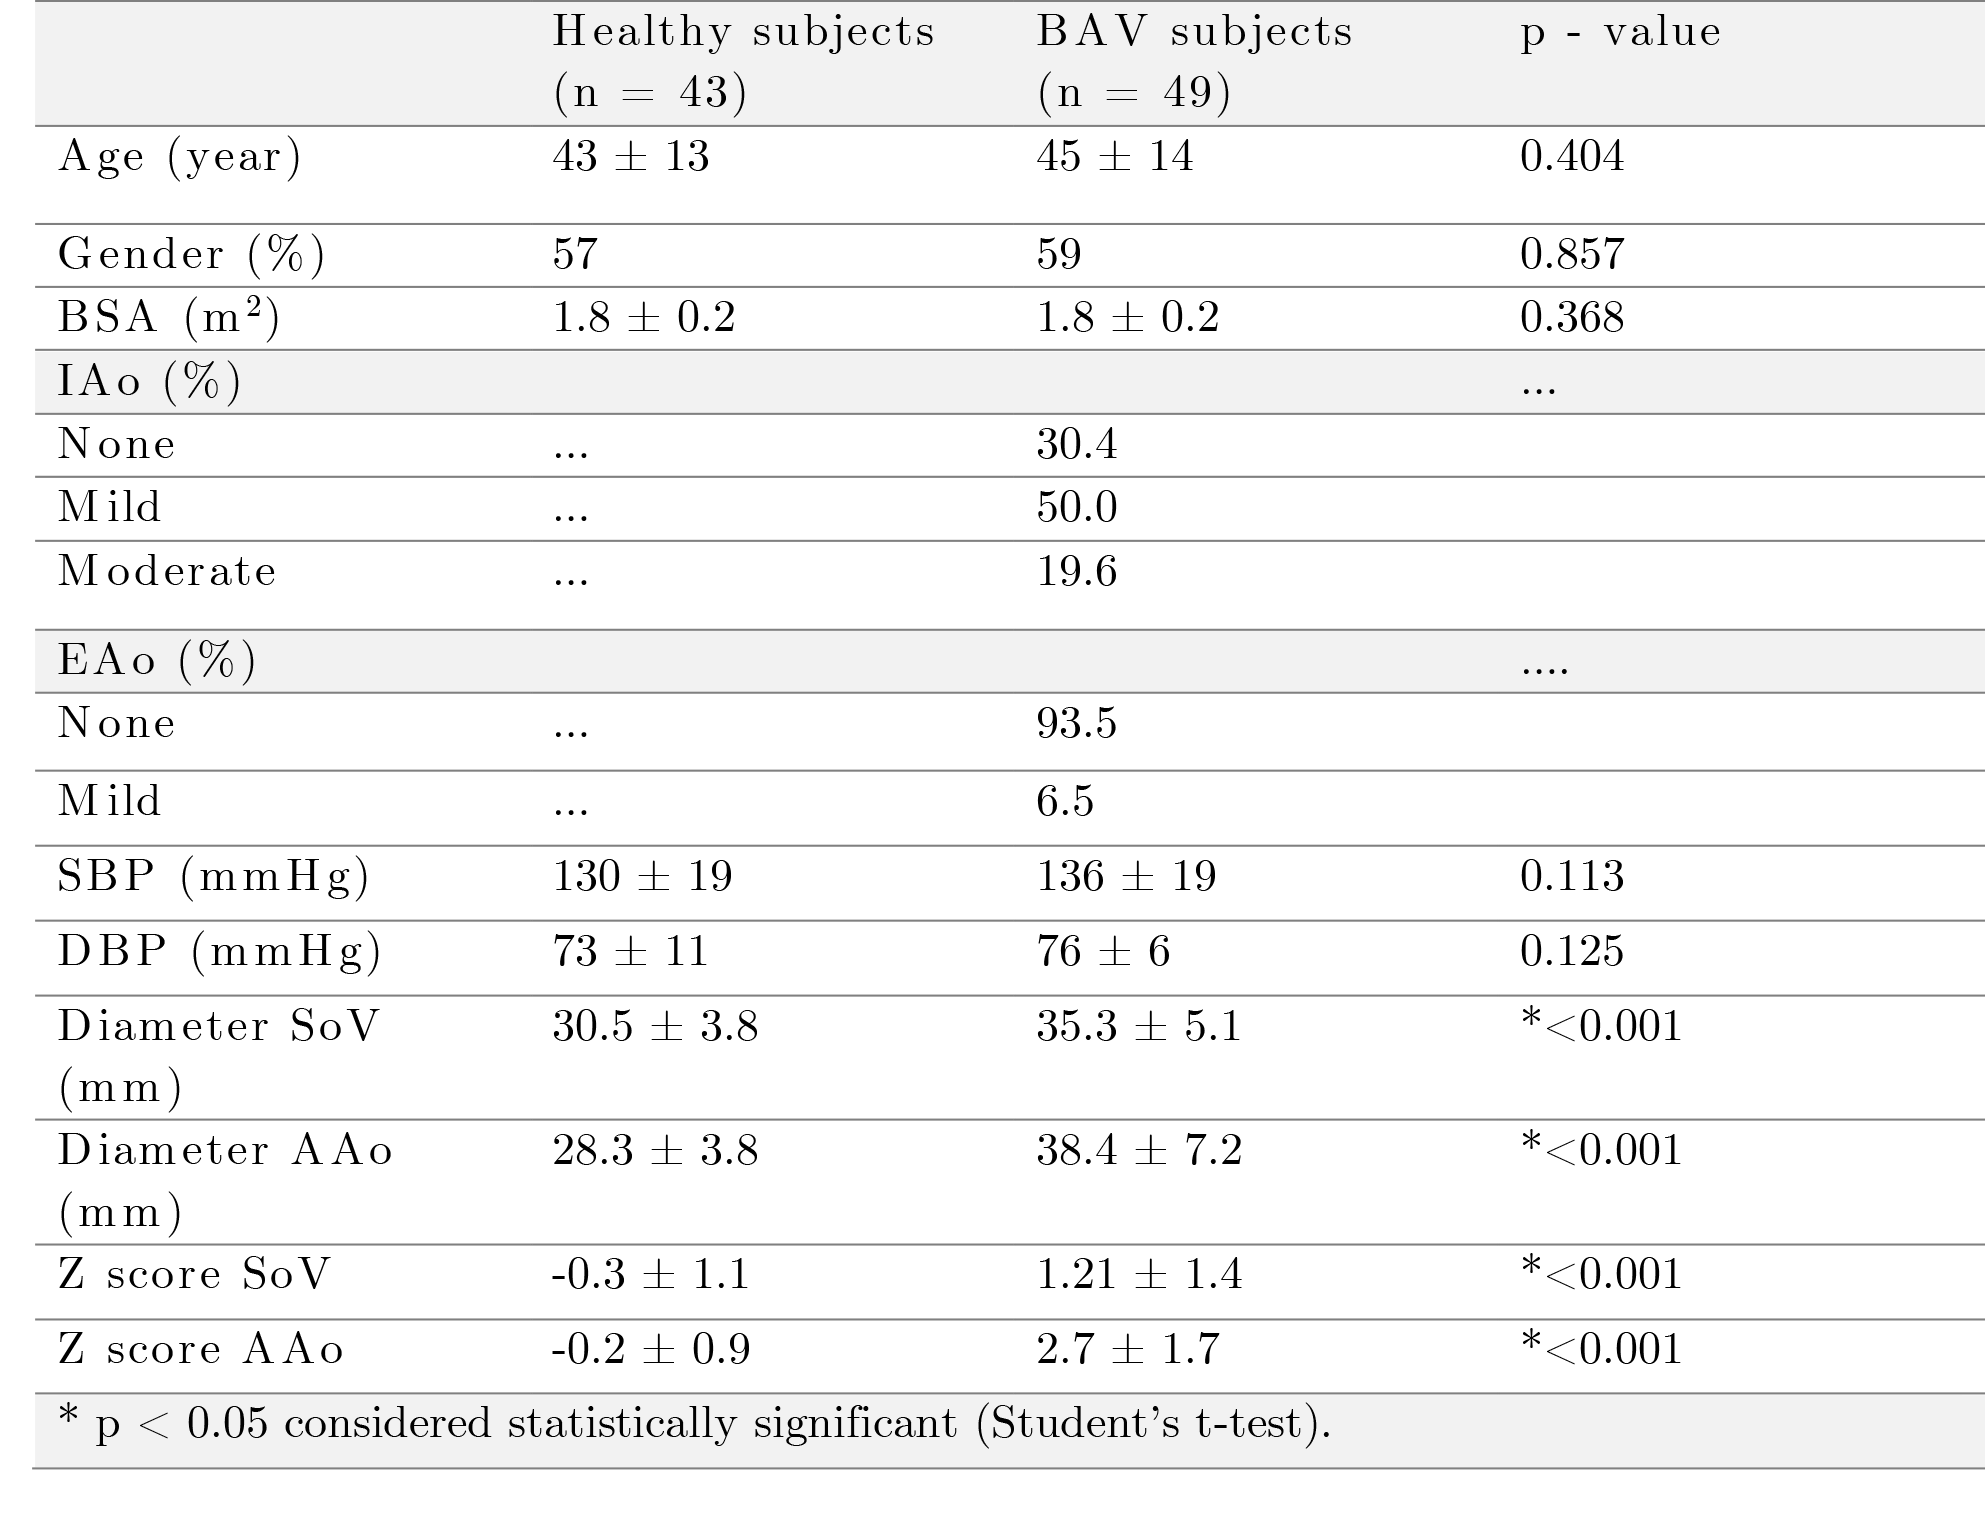
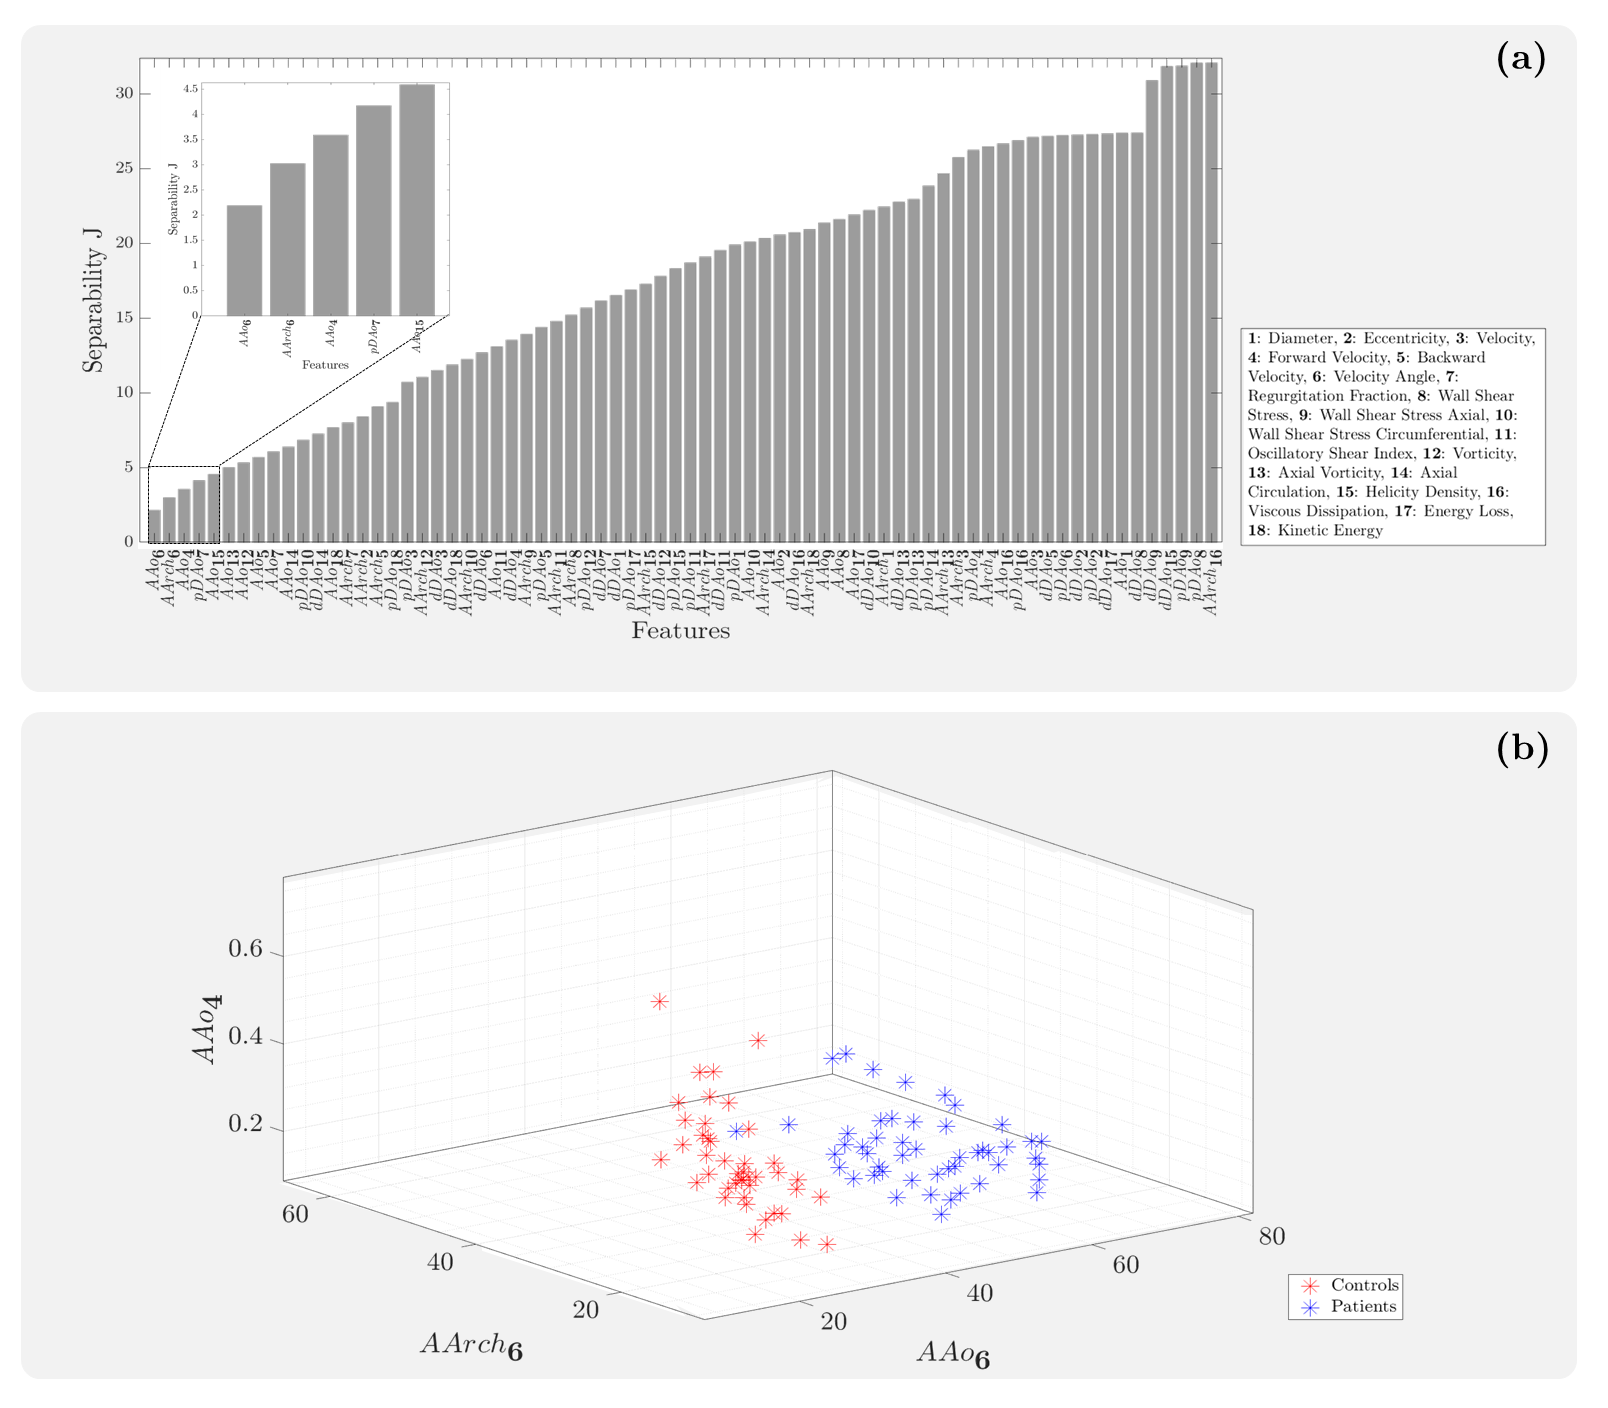
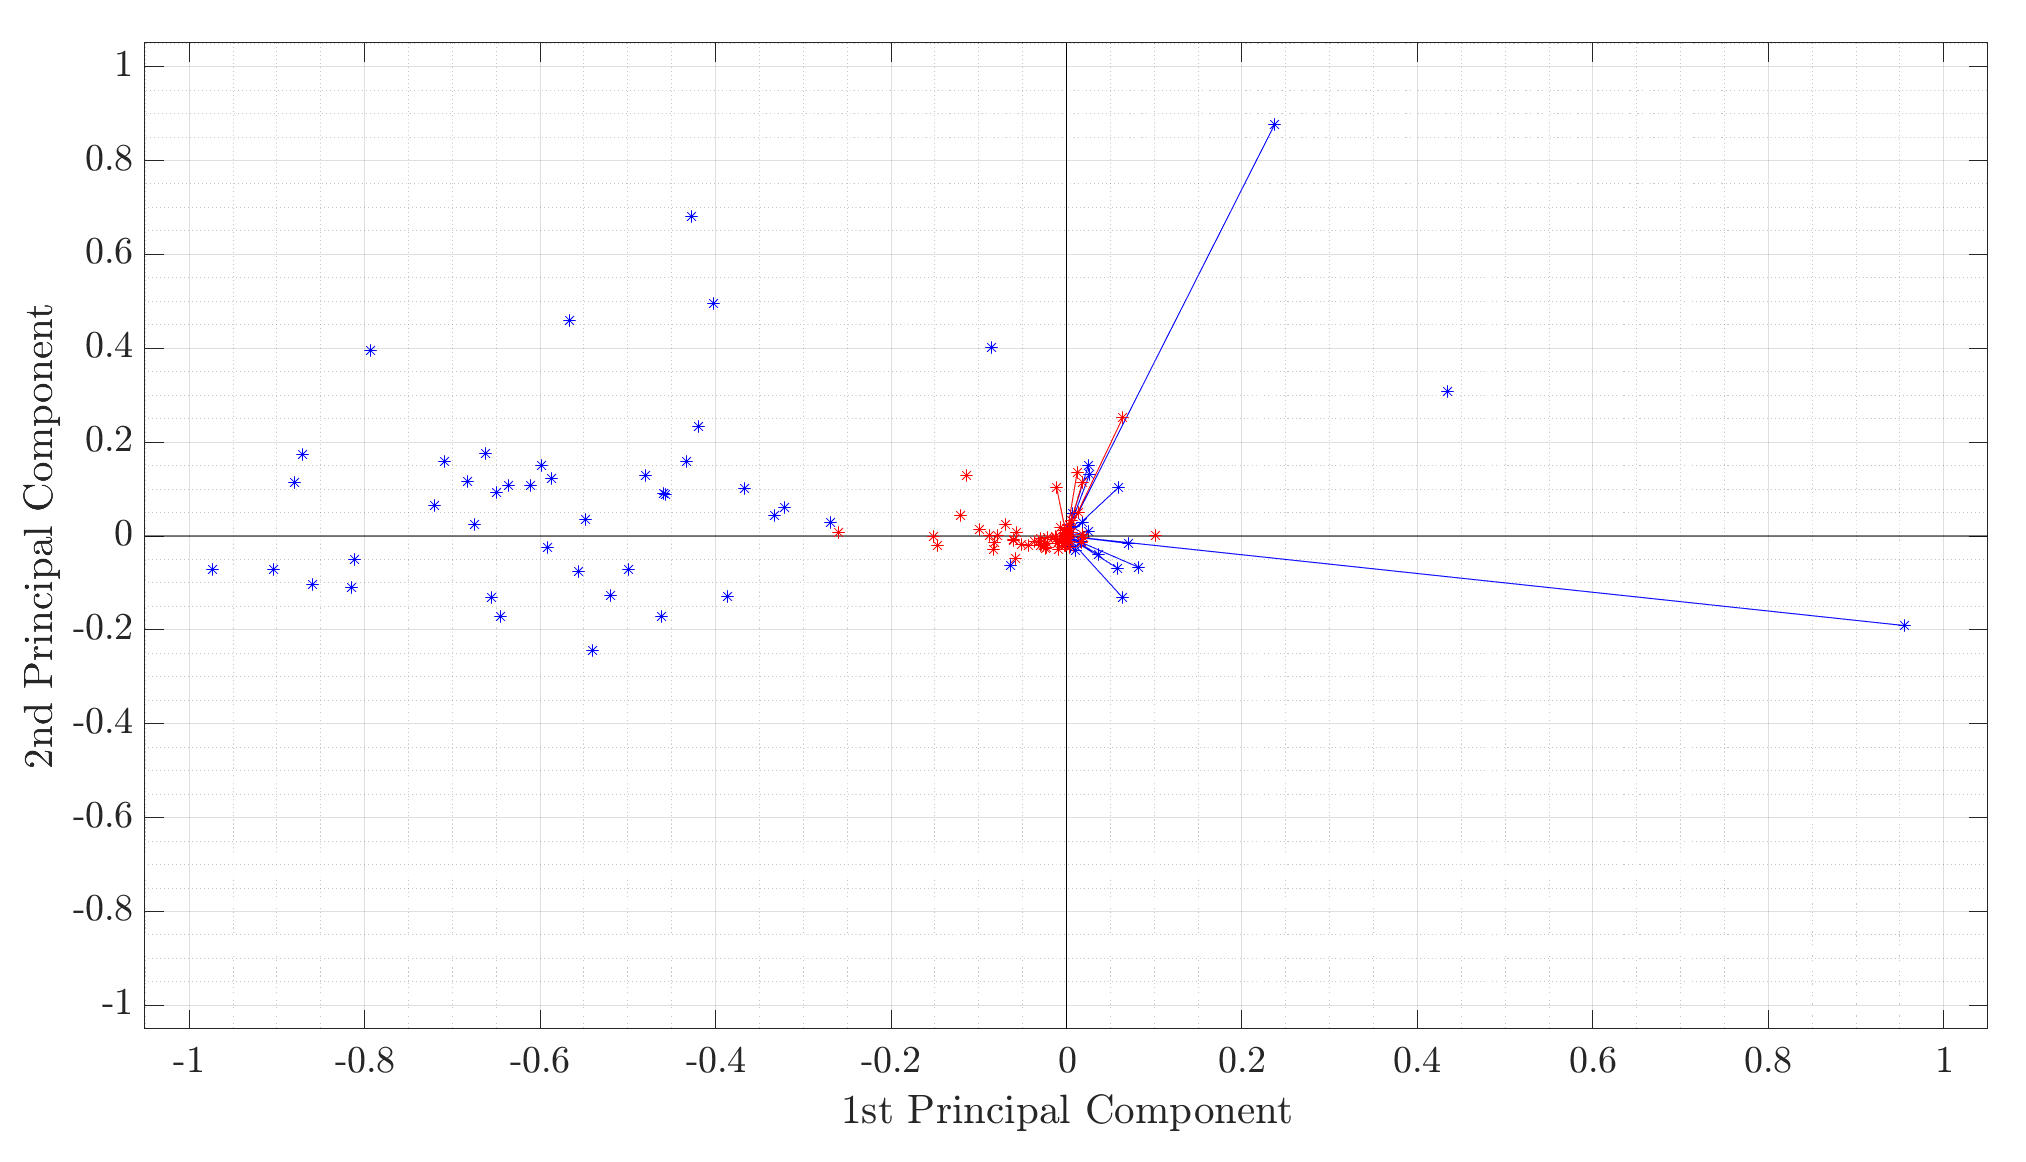
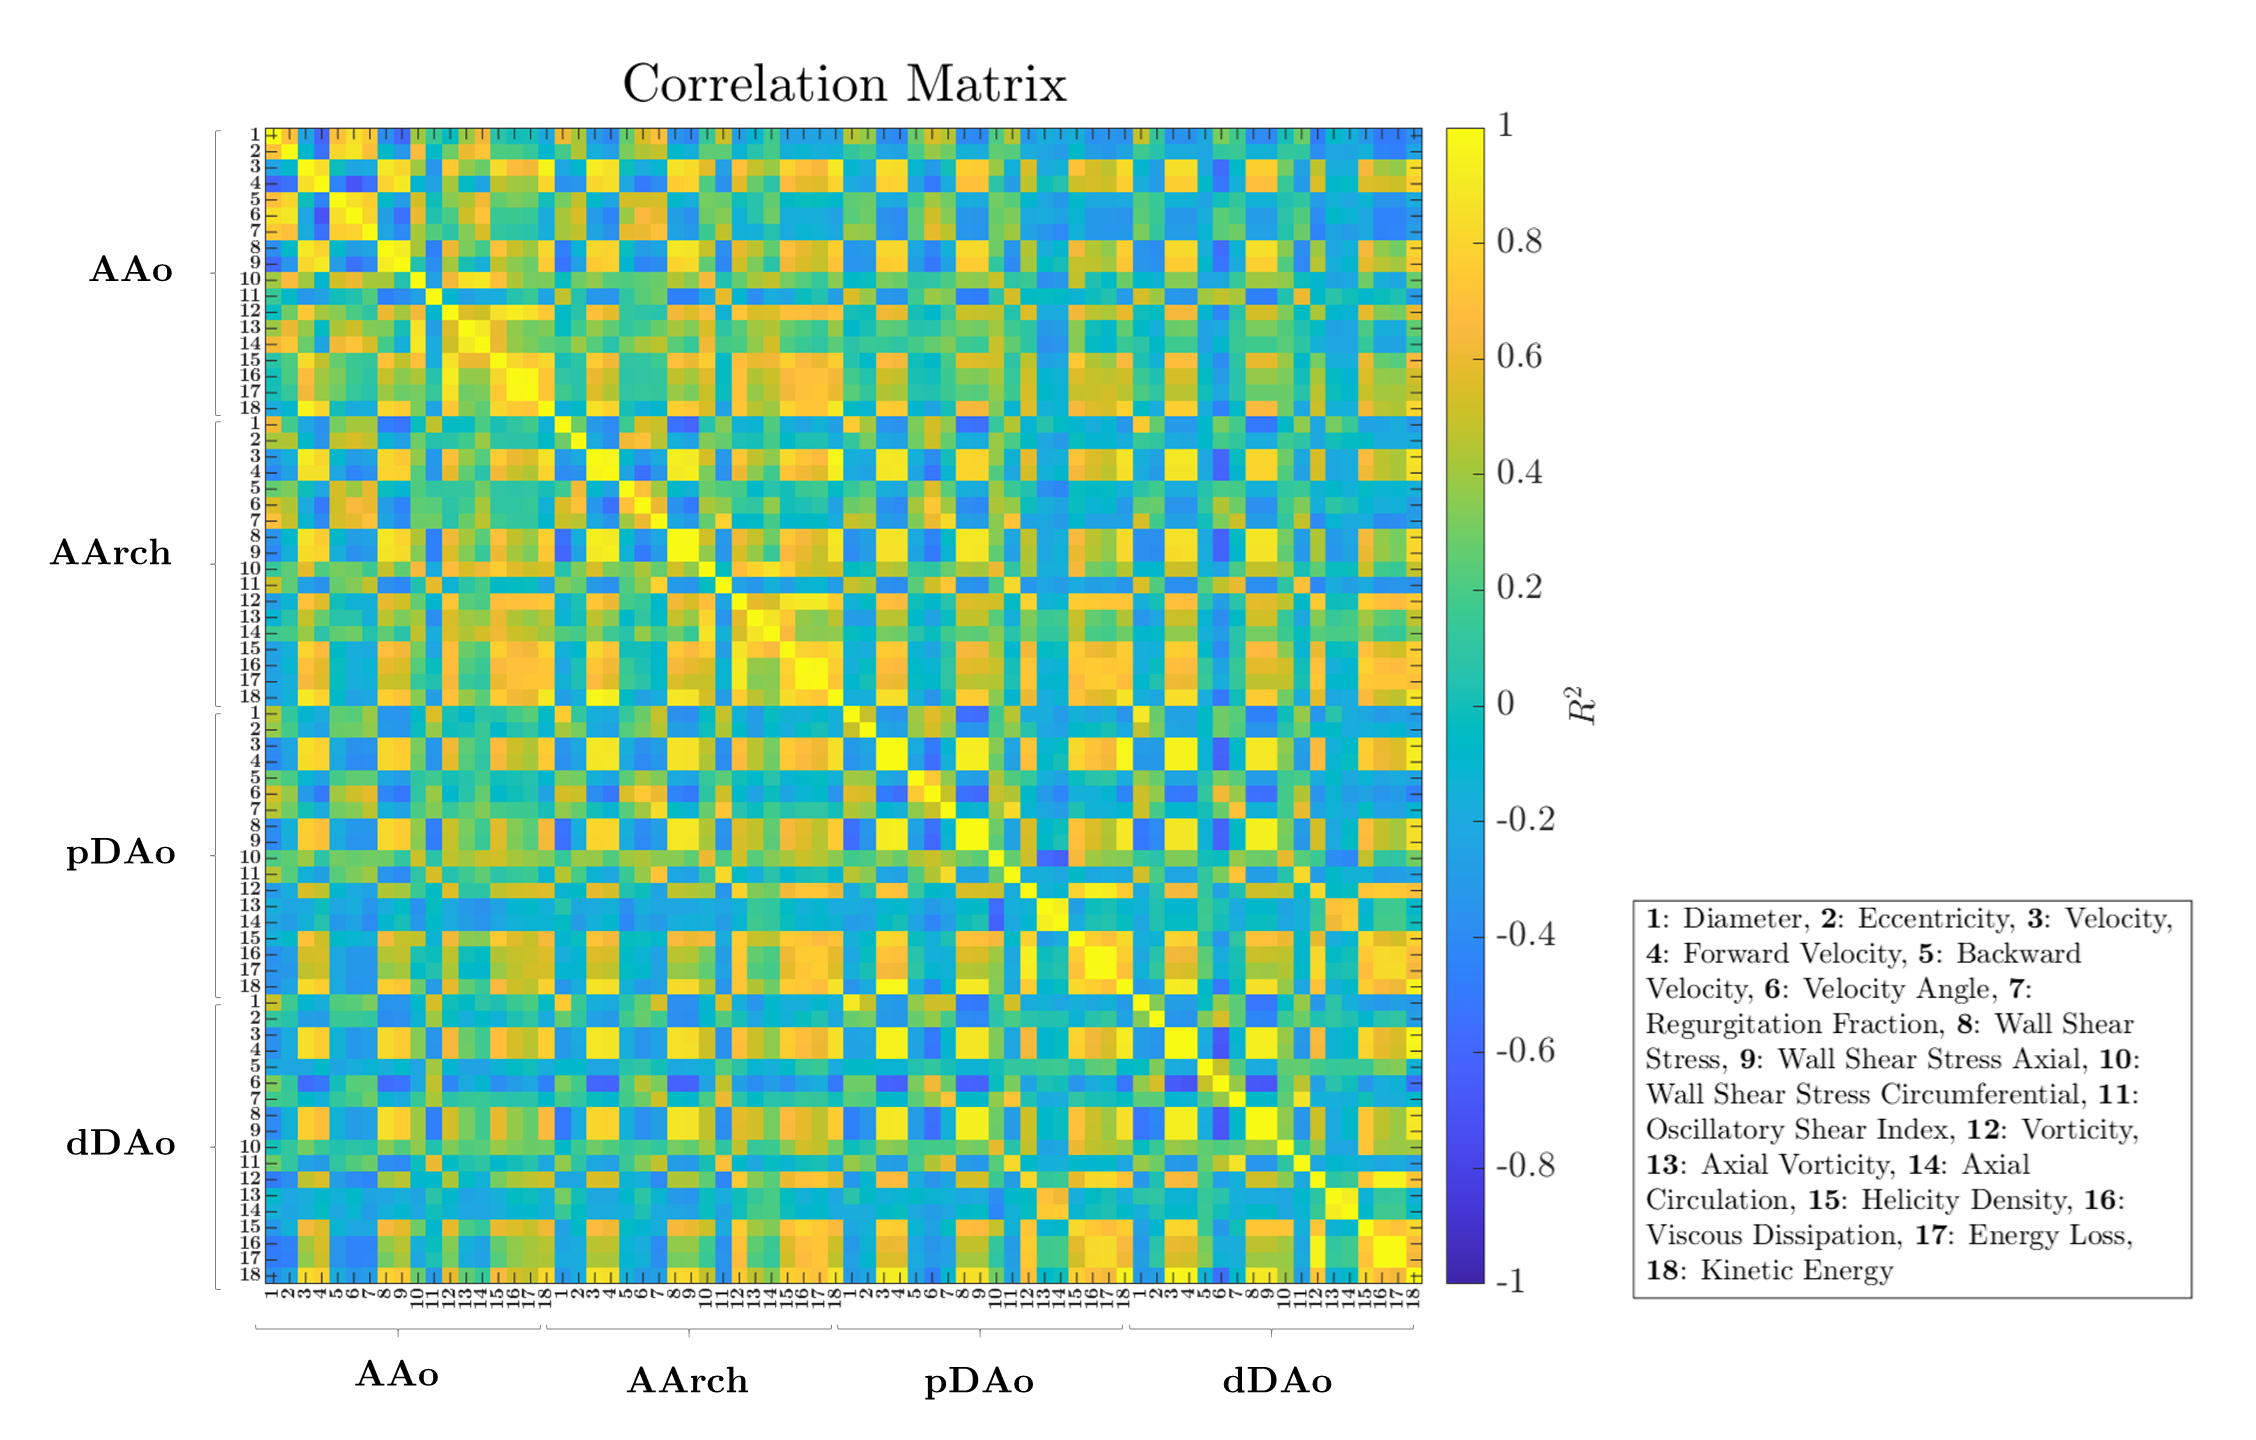
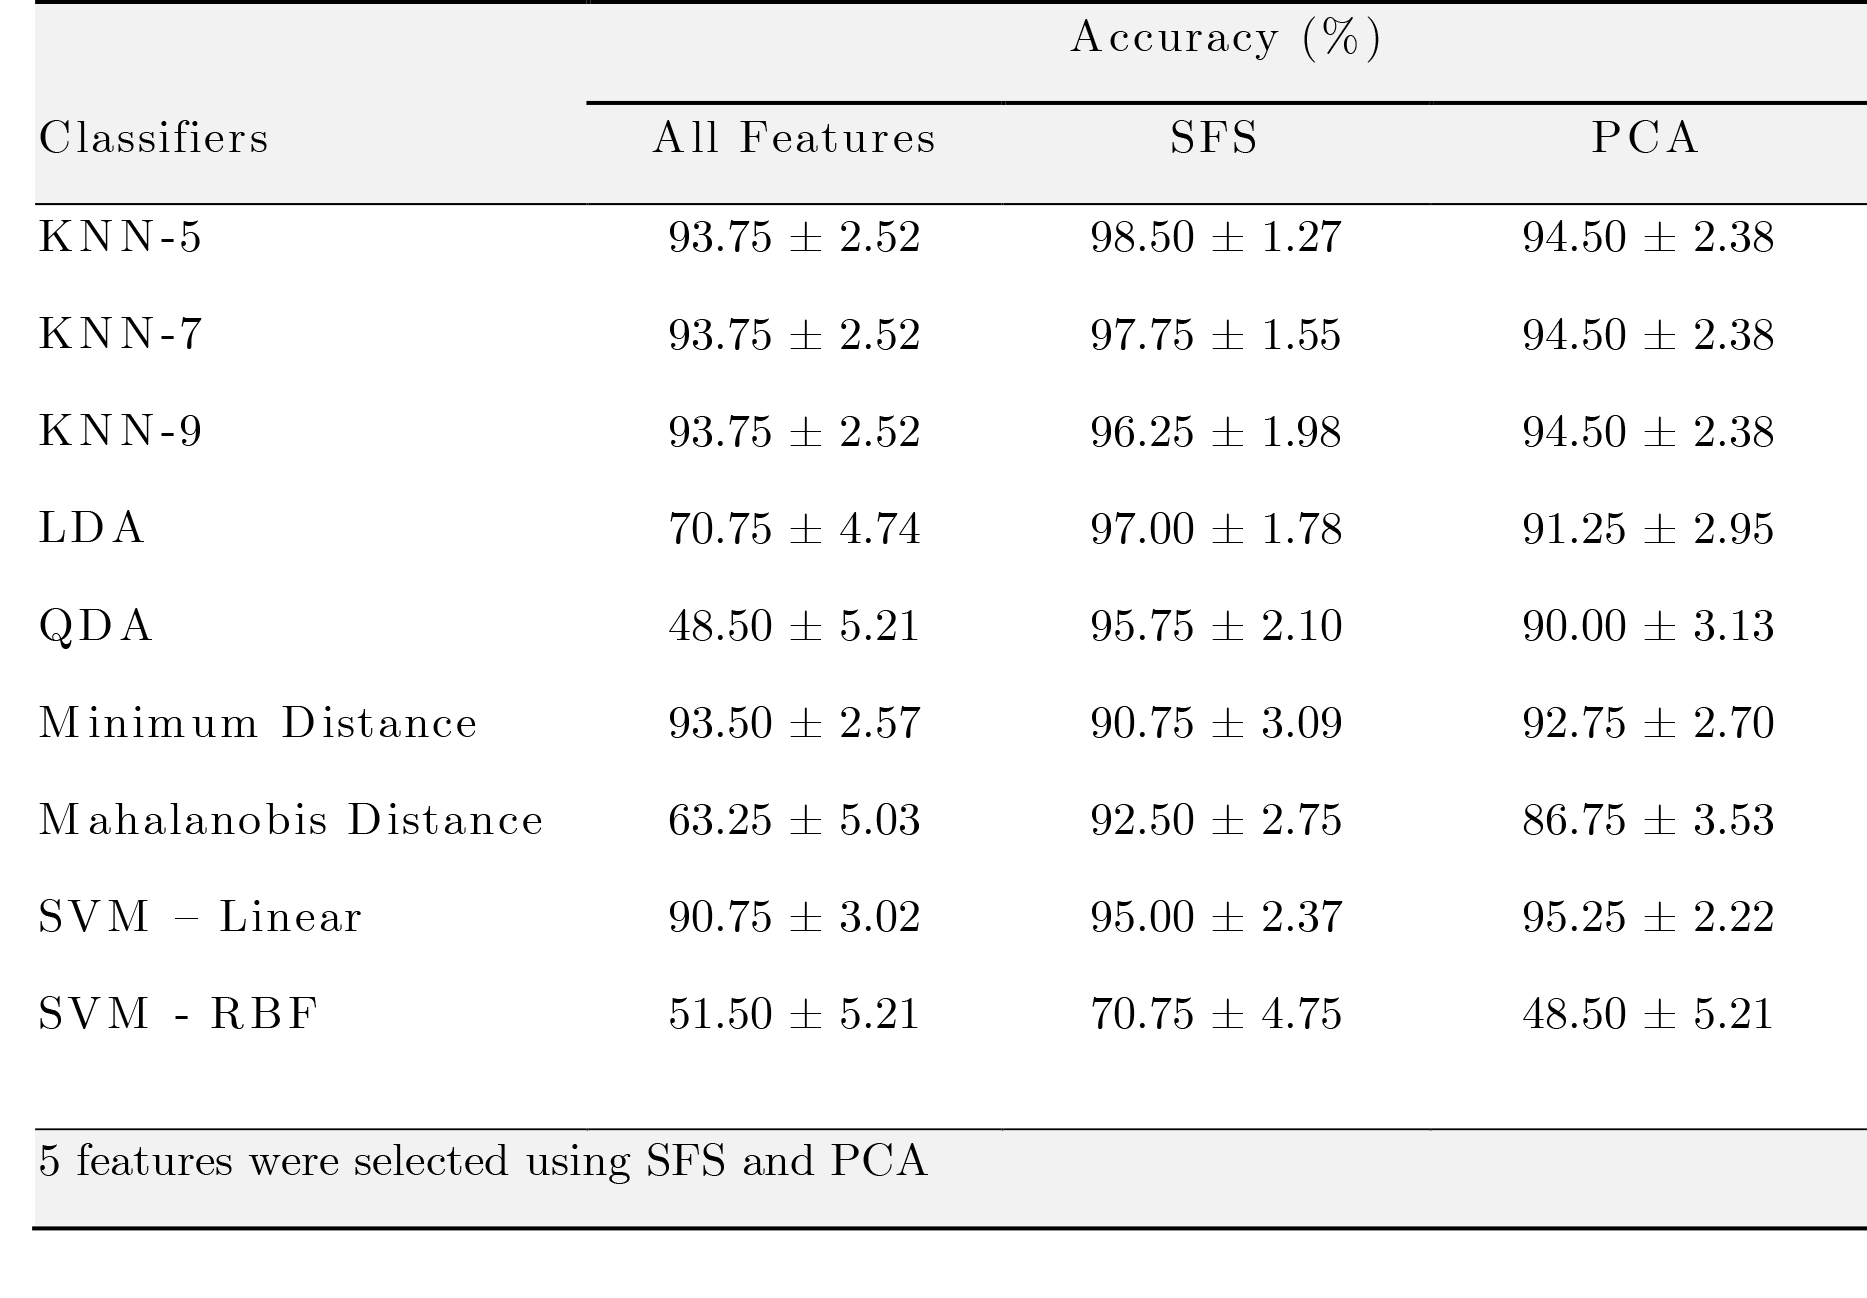
4D flow MRI data of 43 healthy volunteers and 49 BAV (63% right and left coronary cusp phenotype, 70% with AAo dilation) patients were acquired in a 1.5T GE-MR Signa Scanner and using the VIPR technique6. Table 1 shows the clinical data. In-vivo image processing and quantification are fully described elsewhere7-10. The mean hemodynamic parameters were calculated in the ascending aorta (AAo), aortic arch (AArch), proximal descending aorta (pDAo), and distal descending aorta (dDAo) at peak systole. Pearson correlation method was used to calculate the correlation coefficient between all the hemodynamic parameters. A machine learning model was designed to selected hemodynamic parameters in BAV patients, that are able to properly separate both classes. Hemodynamic parameters were selected using sequential forward selection (SFS) and principal component analysis (PCA). We selected 5 features using SFS and exhaustive search, as showing in Figure 1. We used singular value decomposition to compute PCA since it gives us both the principal components and the coefficients and get 5 indices of the vectors with the largest leverage scores, Figure 2. The classifiers that we used were minimum distance, linear discriminant analysis (LDA), k-nearest neighbors (KNN) with 5, 7, 9 neighbors, quadratic discriminant analysis (QDA), Mahalonobis distance and support vector machine (SVM) in both its linear and radial basis function kernel (RBF). The performance of the classification was evaluated using cross-validation. In our experiments, the data were divided into 10 folds (independent groups), because it has become the standard method in practical terms11. That means, 90% are used for training and 10% for testing. This experiment was repeated 10 times interchanging training and testing data to evaluate the stability of the classifier. Then, when training was performed, the samples that were initially removed could be used to test the performance of the classifier on these test data. For each time, the performance defined as the rate of samples correctly classified is computed as ηi, for i=1…10. Thus, we evaluated the generalization capabilities of the classifier by testing how well the method classified samples that had not been already examined. The estimated accuracy, η, is calculated as the mean of the 10 percentages of the true classifications that are tabulated in each case: η = (η1+…+ η10)/10.Results
Figure 1 shows the Pearson correlation method's correlation matrix between all hemodynamic parameters for all regions. Many combinations present a good correlation (e.g., diameter with eccentricity in AAo), which does not allow us to discriminate which combination can be more relevant. Each classification experiment was performed using cross-validation with 10 folds as described in Method section and repeated 10 times for each classifier used (Table 2). The proposed method using SFS with 5 hemodynamic features selected including Velocity Angle in AAo, Velocity Angle in AArch, Forward Velocity in AAo, Regurgitation Fraction in pDAo, and Helicity Density in AAo; and KNN-5 achieves an average of 98.5 ± 1.27 % classification accuracy on BAV dataset.Conclusions
Using a machine learning method, we have found five potentially hemodynamic biomarkers related to BAV patients. Based on the proposed method performance, it can be concluded that the proposed feature selection method can enable clinicians to pay attention to the selected biomarkers as they may play an important role in BAV patients.Acknowledgements
This publication was funded by ANID – Millennium Science Initiative Program – NCN17_129. Also, has been supported by CONICYT - PIA - Anillo ACT1416, CONICYT FONDEF Concurso I+D ID18I10064, FONDECYT #1181057. Sotelo J. thanks to FONDECYT Postdoctorado 2017 #3170737 and ANID FONDECYT de Iniciación en Investigación #11200481. Franco P. thanks to ANID – PCHA/ Doctorado-Nacional/2018-21180391.References
1.- Siu SC, Silversides CK. Bicuspid aortic valve disease. J Am Coll Cardiol 2010;22;55(25):2789-800.
2.- Evangelista A, Gallego P, Calvo-Iglesias et al. Anatomical and clinical predictors of valve dysfunction and aortic dilation in bicuspid aortic valve disease. Heart. 2018;104:566–573.
3.- Allen BD, van Ooij P, Barker AJ, et al. Thoracic aorta 3D hemodynamics in pediatric and young adult patients with bicuspid aortic valve. J Magn Reason Imaging. 2015; 42(4): 954-63.
4. - Bissell MM, Hess AT, Biasiolli L, et al. Aortic dilation in bicuspid aortic valve disease: flow pattern is a major contributor and differs with valve fusion type. Circ Cardiovasc Imaging 2013;6:499–507.
5. – Atkins S, Sucosky P, Etiology of bicuspid aortic valve disease: Focus on hemodynamics, World J Cardiol. 2014 Dec 26; 6(12):1227-1233.
6.- Gu T, Korosec FR, Block WF, et al. PC VIPR: a high-speed 3D phase-contrast method for flow quantification and high-resolution angiography. AJNR Am J Neuroradiol. 2005;26(4):743-9.
7.- Sotelo J, Urbina J, Valverde I, et al. 3D Quantification of Wall Shear Stress and Oscillatory Shear Index Using a Finite-Element Method in 3D CINE PC-MRI Data of the Thoracic Aorta. IEEE Trans Med Imaging. 2016;35(6):1475-87.
8.- Sotelo J, Dux-Santoy L, Guala A, et al. 3D axial and circumferential wall shear stress from 4D flow MRI data using a finite element method and a laplacian approach. Magn Reson Med 2017;0:0-0
9.- Sotelo J, Dux-Santoy L, Guala A, et al. Comprehensive análisis of Hemodynamic parameters in patients with bicuspid aortic valve using 4D Flow data and a finite element method, 2018. ISMRM anual meeting, Jun 16-21th, Paris, France.
10.- Dux-Santoy L, Guala A, Sotelo J, et al. Low and Oscillatory Wall Shear Stress Is Not Related to Aortic Dilation in Patients With Bicuspid Aortic Valve: A Time-Resolved 3-Dimensional Phase-Contrast Magnetic Resonance Imaging Study, Arterioscler Thromb Vasc Biol. 2020 Jan;40(1):e-10-e20.
11.- Witten I and Frank E, Data mining: practical machine learning tolls and techniques, San Mateo (2nd ed.), 2005
Figures