2648
Deep-Learning epicardial fat quantification using 4-chambers Cardiac MRI segmentation, comparison with total epicardial fat volume1Aix-Marseille Univ, CNRS, CRMBM, Marseille, France, 2APHM, Hôpital Universitaire Timone, Service d’Endocrinologie, Marseille, France
Synopsis
Evaluation of epicardial adipose tissue (EAT) burden holds potential as a biomarker for CHD diagnosis. EAT volume is challenging to assess using MRI due to its curved shape susceptible to partial volume effect. As a substitute, 4-chamber EAT surface can be reliably measured and has shown good correlation with EAT volume (r2=0.62). Two fully convolutional neural networks (FCN) were investigated for the segmentation of EAT surface on a database of 126 subjects. Promising results were obtained with DICE values of 0.71.
Background
Epicardial adipose tissue (EAT) volume quantification holds potential as a biomarker for cardiac diagnosis1 and has raised concerned as a risk factor in COVID192. However, EAT volume is challenging to assess using MRI due to its curved shape suffering from partial volume effect. As a surrogate, 4-chamber EAT surface was proposed, in correlation with EAT volume3-4. Fully convolutional neural networks (FCN) enabled automated quantification of 4-CH EAT surface and was evaluated on diabetic, obese and healthy subjects.Methods
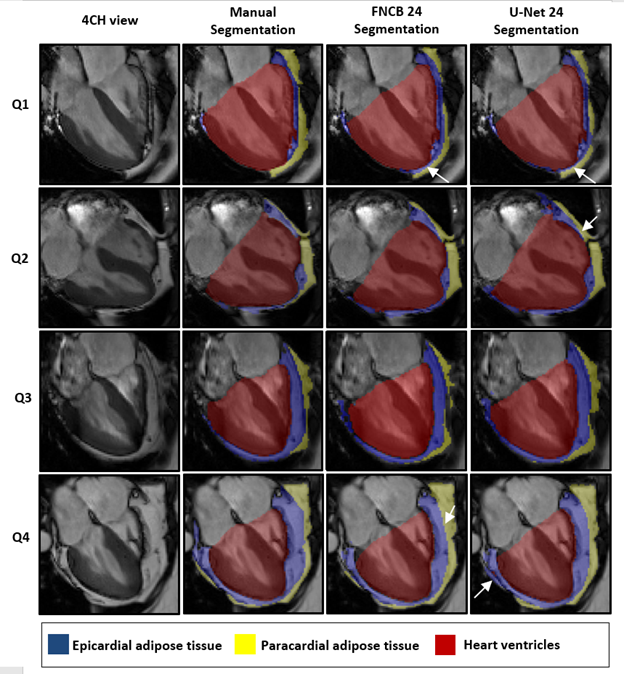
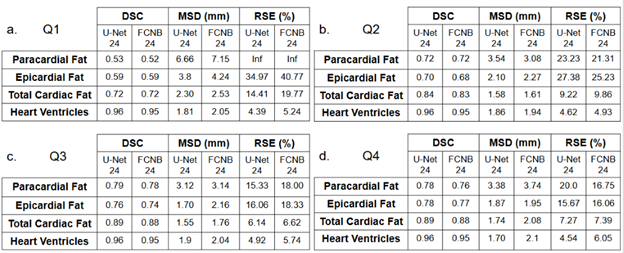
A database gathered 126 subjects including 19 healthy controls, 81 type-2 diabetic and 26 non-diabetic obese patients. Subjects underwent CMR including full stack short-axis and 4CH cine (1.3-1.8x1.3-1.8mm2, 25 frames) at 3T (Siemens Verio). Provided with full 4CH cine, 2 experts performed blinded segmentation of 3 labels in FSLeyes : heart ventricles(HV), epicardial(EAT) and paracardial(PAT) adipose tissues. Segmentations were performed both on end-systolic and end-diastolic frames. Series in the test dataset were segmented by both reviewers, and reviewer 1 repeated blinded segmentations 6 weeks later. Two different FCNS were investigated: U-Net5 and FCN developed by Bai et al6 later referenced as FCNB. They were trained on 3 consecutive cine frames for segmentation of the central frame using dice loss. Online data augmentation was performed using rotational transformation and/or image scaling. The database was split in 5 subsets totalling 25 subjects each that respected our database populations distribution (4 healthy control, 16 type 2-diabetic, 5 obese). One subset was used as a test set whereas the 4 other subsets were used for cross-validation training. To evaluate segmentation performances and inter-intra observer bias, complementary metrics were used: Dice similarity coefficient (DSC) for segmentation accuracy, Mean Surface Distance (MSD) for checking the propinquity between segmentations and Relative Surface Error (RSE) for evaluating the quantitative measurement of EAT surface. FCNs performances were assessed gradually within quartiles of EAT surface manually segmented (Q1< 7.14 cm2 ≤ Q2 < 11.21 cm2 ≤ Q3 < 14.90 cm2 ≤ Q4).Results
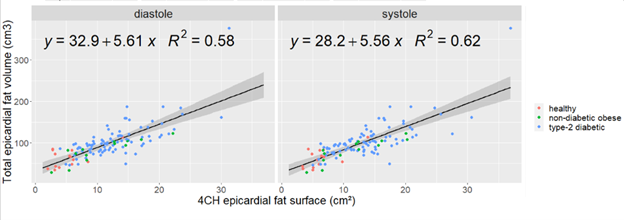
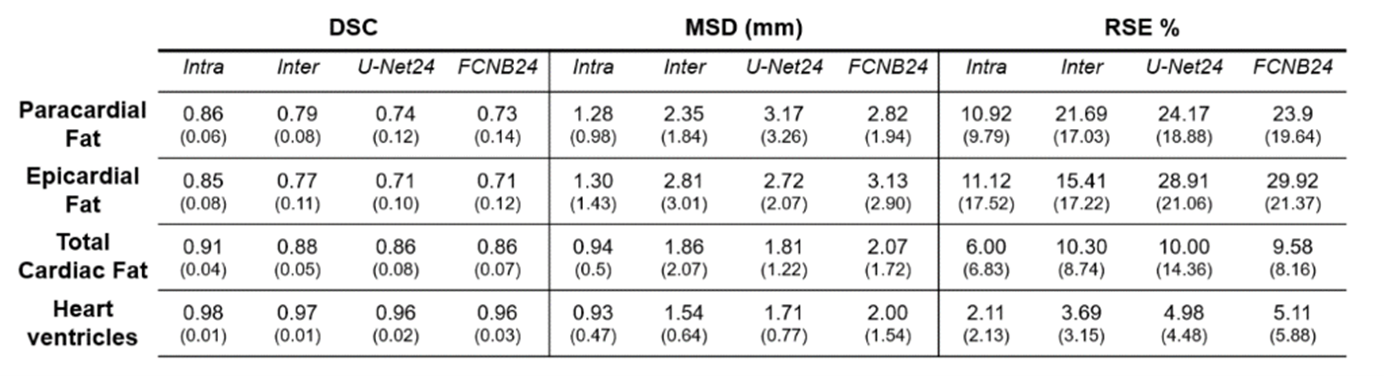
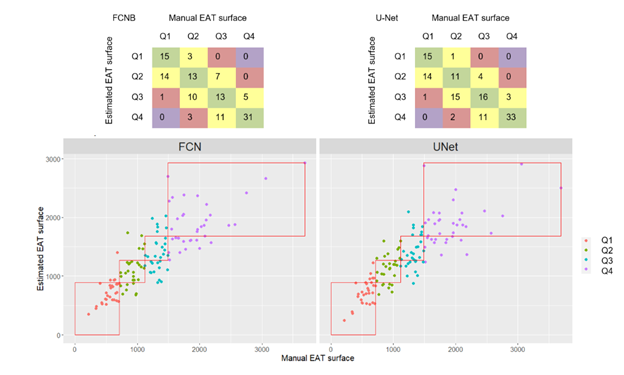
Corresponding EAT surfaces as measured on 4CH views correlated well with total EAT volume measured from the stack of short-axis cine(Fig.1) with a slightly higher correlation in systole(r2=0.62) than in diastole (r2=0.58). Intra and inter-observers DSC confirmed excellent reproducibility for HV segmentation (Fig.2). Intra-observers EAT DSC were significatively lower (p<0.05) and RSE higher (p<0.05) in end-diastolic frame compared to end-systolic frame. EAT differed between the 2 observers (DSCInter(EAT) = 0.77), when total fat was more reproducible (DSCInter(EAT+PAT)=0.88). The same observer provided more reliable segmentations (DSCIntra(EAT)=0.85 and DSCIntra(EAT+PAT)=091). FCNB and U-Net segmentation performances, measured by DSC, were significantly lower (p<0.0001) than intra-observer bias for all labels. Both networks provided similar DSC than inter-observers bias for HV segmentation. However, EAT segmentations realised by these networks were less reliable than experts as shown by DSC performance (DSCInter=0.77, DSCFCNS=0.71), leading to higher surface estimation errors (RSEInter=15.41%, RSEFCNS>25%).Network’s performances (Fig.3) to segment EAT strongly depended on the population quartile of data defined by ranges of EAT surfaces (Fig.4). Indeed, DSC was significantly higher (p>0.05) for superior quartiles as observed using the U-Net: DSCQ4=0.78 > DSCQ3=0.76 > DSCQ2=0.70 > DSCQ1=0.59. As also shown in test database, FCNS had more difficulty to separate PAT from EAT than identifying total cardiac fat in the image (in Q1 with U-Net: RSEPAT-EAT>15 %, RSETCF=7.27 %). The distribution of subjects into quartile of EAT surfaces demonstrated the robust stratification of patients despite remaining surface errors. Confusion matrices (Fig.5) confirmed proper classification of more than half of the subjects (57.1% for FCNB and 59.5% for U-Net), and a classification within one correct quartile of almost all database (96.8% for FCNB and 97.6% U-Net).Discussion
Deep learning holds potential to support clinicians in assessing challenging biomarkers such as EAT quantity. Leveraging a database of lean to obese and diabetic subjects, this study lays ground for providing automated EAT surface with precision approaching experts’, at least in patients at risk (upper 2 quartiles). Nevertheless, the database stands also as the limitation of our study, being mono-centric and exclusively acquired at 3T over 10 years. Further inclusions are much needed to strengthen the database. Intra and inter-observer low RSE suggest that EAT surface is a reliable measure, albeit tedious. Indeed, the major challenge for the segmentation of EAT on cine MRI is to distinguish between burdening EAT and its passive neighbor PAT. The pericardial fascia that separates them is less than 2 mm7-8 which ranges close to the in-plane resolution (1.3-1.8mm). Unsurprisingly, systolic frames offered more stable EAT surface segmentation, which relates to the improved visibility of pericardium fascia due to heart contraction. Refined networks could outperform proposed U-Net and FCNB, notably in Q1 quartile, where the thin EAT surface emphasizes networks limitations. Nevertheless, FCNs RSE performances in upper quartiles hold promises where much support for EAT evaluation is needed, to eventually identify patients at-risk.Conclusion
This study aims at providing a rapid and fully integrated evaluation of EAT burden. To this end, automated segmentation of the EAT layer was performed on 4-chambers cine using Deep Learning approaches. Eventually, it alleviates the need for a dedicated MRI acquisition and allows to explore the impact of EAT overload from any cardiac MRI study.Acknowledgements
No acknowledgement found.References
1. A. A. Mahabadi et al., “Association of Epicardial Adipose Tissue With Progression of Coronary Artery Calcification Is More Pronounced in the Early Phase of Atherosclerosis,” JACC Cardiovasc. Imaging, vol. 7, no. 9, pp. 909–916, Sep. 2014.
2. K. Nakanishi et al., “Persistent epicardial adipose tissue accumulation is associated with coronary plaque vulnerability and future acute coronary syndrome in non-obese subjects with coronary artery disease,” Atherosclerosis, vol. 237, no. 1, pp. 353–360, Nov. 2014.
3. A. S. Antonopoulos and C. Antoniades, “The role of epicardial adipose tissue in cardiac biology: classic concepts and emerging roles,” J. Physiol., vol. 595, no. 12, pp. 3907–3917, 15 2017.
4. G. Iacobellis et al., “Epicardial Fat Inflammation in severe COVID‐19,” Obesity, p. oby.23019, Aug. 2020.
5. O. Ronneberger, P. Fischer, and T. Brox, “U-Net: Convolutional Networks for Biomedical Image Segmentation,” in Medical Image Computing and Computer-Assisted Intervention – MICCAI 2015, vol. 9351, N. Navab, J. Hornegger, W. M. Wells, and A. F. Frangi, Eds. Cham: Springer International Publishing, 2015, pp. 234–241.
6. W. Bai et al., “Automated cardiovascular magnetic resonance image analysis with fully convolutional networks,” J. Cardiovasc. Magn. Reson., vol. 20, no. 1, p. 65, Dec. 2018.
7. R. K. Bull, P. D. Edwards, and A. K. Dixon, “CT dimensions of the normal pericardium.,” Br. J. Radiol., vol. 71, no. 849, pp. 923–925, Sep. 1998.
8. J. Bogaert and M. Francone, “Cardiovascular magnetic resonance in pericardial diseases,” J. Cardiovasc. Magn. Reson., vol. 11, no. 1, p. 14, Dec. 2009.
Figures