2647
Deep Learning based Automatic Multi-Regional Segmentation of the Aorta form 4D Flow MRI1Biomedical Engineering, Northwestern University, Chicago, IL, United States, 2Lurie Childrens Hospital of Chicago, Chicago, IL, United States, 3Northwestern Radiology, Evanston, IL, United States
Synopsis
While 4D flow MRI is capable of providing extensive hemodynamic quantifications, it requires cumbersome and time-consuming pre-processing. In order to accelerate the process, we developed and validated a multi-label convolutional neural network (CNN) for automatic aortic 3D segmentation and regional-labeling (ascending, AAo; arch; and descending aorta, DAo). Utilizing 320 4D flow MRI datasets, we used a 10-fold cross validation for training and testing the CNN. The Dice scores across each region were AAo: 0.95 [0.93-0.98], arch: 0.90 [0.89-0.95], and DAo: 0.95 [0.94-0.98]. Across all flow metrics, Bland-Altman comparisons showed moderate to excellent agreement between the manual and automated regional segmentations.
Introduction
4D flow MRI provides a comprehensive assessment and quantitative analysis of hemodynamics. However, 4D flow data analysis requires cumbersome and time-consuming pre-processing, including manual 3D aortic segmentation. As such, an accurate, automated 3D aorta segmentation algorithm could accelerate hemodynamic quantification and improve its reliability. Building on a previous study that demonstrated the ability to accurately and rapidly provide automated aortic segmentations from 4D flow1, we seek to incorporate multi-labeled segmentation of the aorta to automatically provide regional labeling (ascending, AAo; arch; and descending aorta, DAo) for subsequent quantitative segmental analysis of aortic hemodynamics. In this study, we trained and validated a multi-label convolutional neural network (CNN) for the segmentation and regional labeling of the aorta from 4D flow MRI for rapid flow analysis.Methods
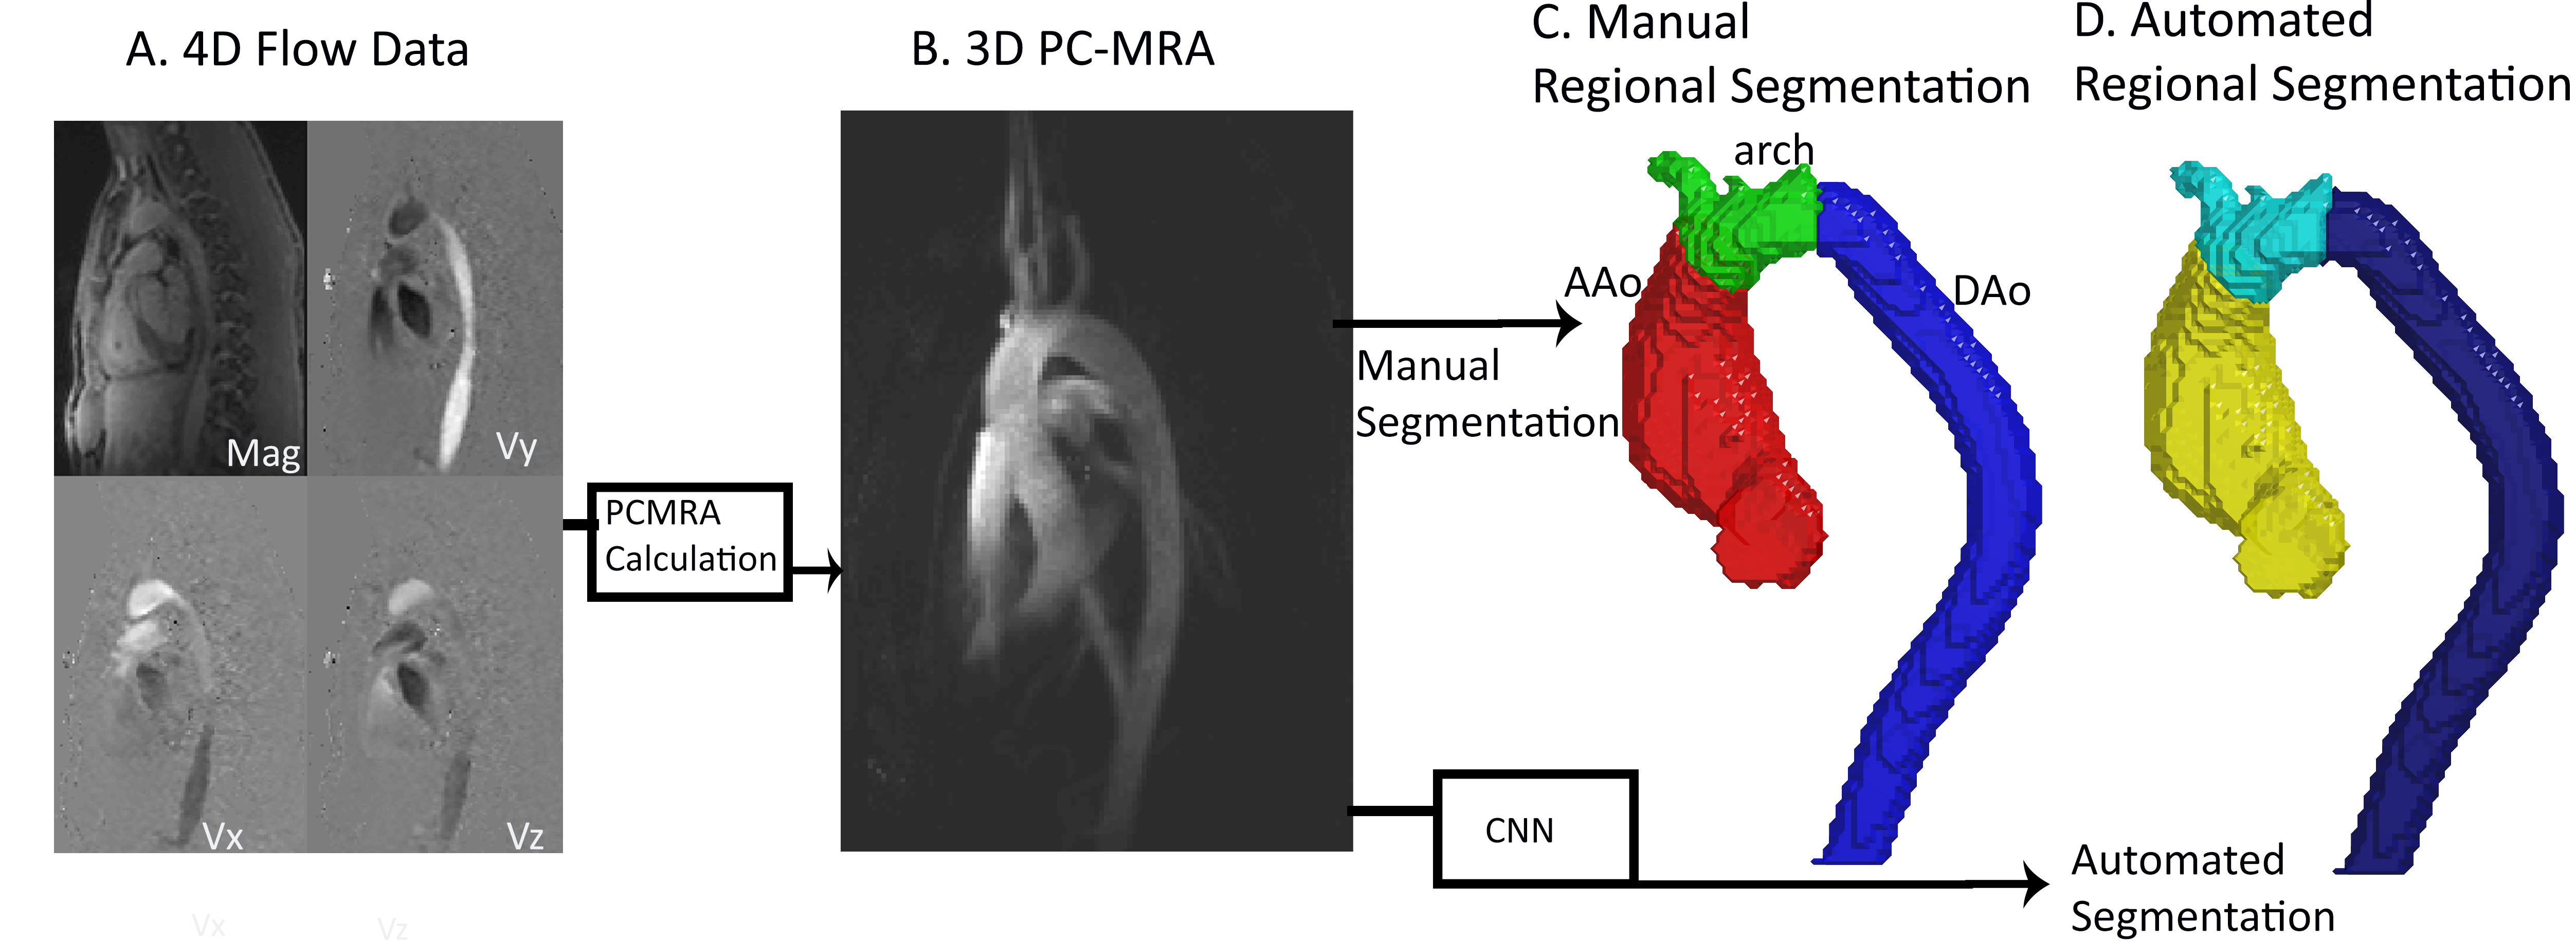
This study used 320 aortic 4D flow MRI datasets in patients with bicuspid aortic valve (BAV) (age =50 [18-75] years). 4D flow MRI sequence paraments were: TR=40.8-42.8 ms, venc=150-500 cm/s, spatial resolution=1.89-3.12x1.89-3.12x2.2-4.0 mm3, Siemens. The data analysis workflow is described in Figure 1. Each 4D flow dataset underwent standard, manual 4D flow pre-processing (eddy current corrections, noise masking, velocity antialiasing). 4D flow-derived 3D phase contrast MR angiograms (PCMRA, Figure 1B) were used to perform manual or automated1 3D segmentations of the aorta. Next, two cutting places were manually placed proximal to the brachiocephalic artery and distal to the left subclavian artery to divide the 3D segmentation into AAo, arch, and DAo segments. The manually-generated, regional 3D segmentations served as the ground-truth for training and testing while the 3D PCMRA data were used an input for the CNN (Figure 1C). A 10-fold cross validation was used, allowing every dataset to be used exactly once for testing.The CNN used was a Dense U-Net network as previously described1, composed of a series of dense blocks, a collection of small convolution layers and concatenation, with an encoder-decoder U-Net2,3. CNN training utilized a learning rate: 10-4, a dropout rate: 0.1, a batch size: 1, and a composite loss function featuring a softmax cross entropy and dice loss. The CNN output was a mask of the entire aorta with the AAo, arch, and DAo labeled separately (Figure 1D).
Quantitative flow analysis was performed by calculating the peak velocity and mean kinetic energy for each of the three aorta segments (AAo, arch, DAo). Peak systolic velocity was determined by the 95th percentile of regional velocity values. Kinetic energy was calculated through
KE = 0.5 * v2 * V * p
With KE: kinetic energy, v: mean velocity of the region, V: the volume of the blood flow in the region, and p: the density of blood (1.05 g/mL).
Dice scores were calculated between each region (AAo, arch, DAo) of the ground-truth to the automated segmentations. For all flow metrics, Bland-Altman plots were calculated between the manual and automated analysis to assess CNN performance. Interobserver comparisons was performed on a subset of patients to evaluate the CNN performance compared to inter-rater variability in regional segmentations (N=20).
Results
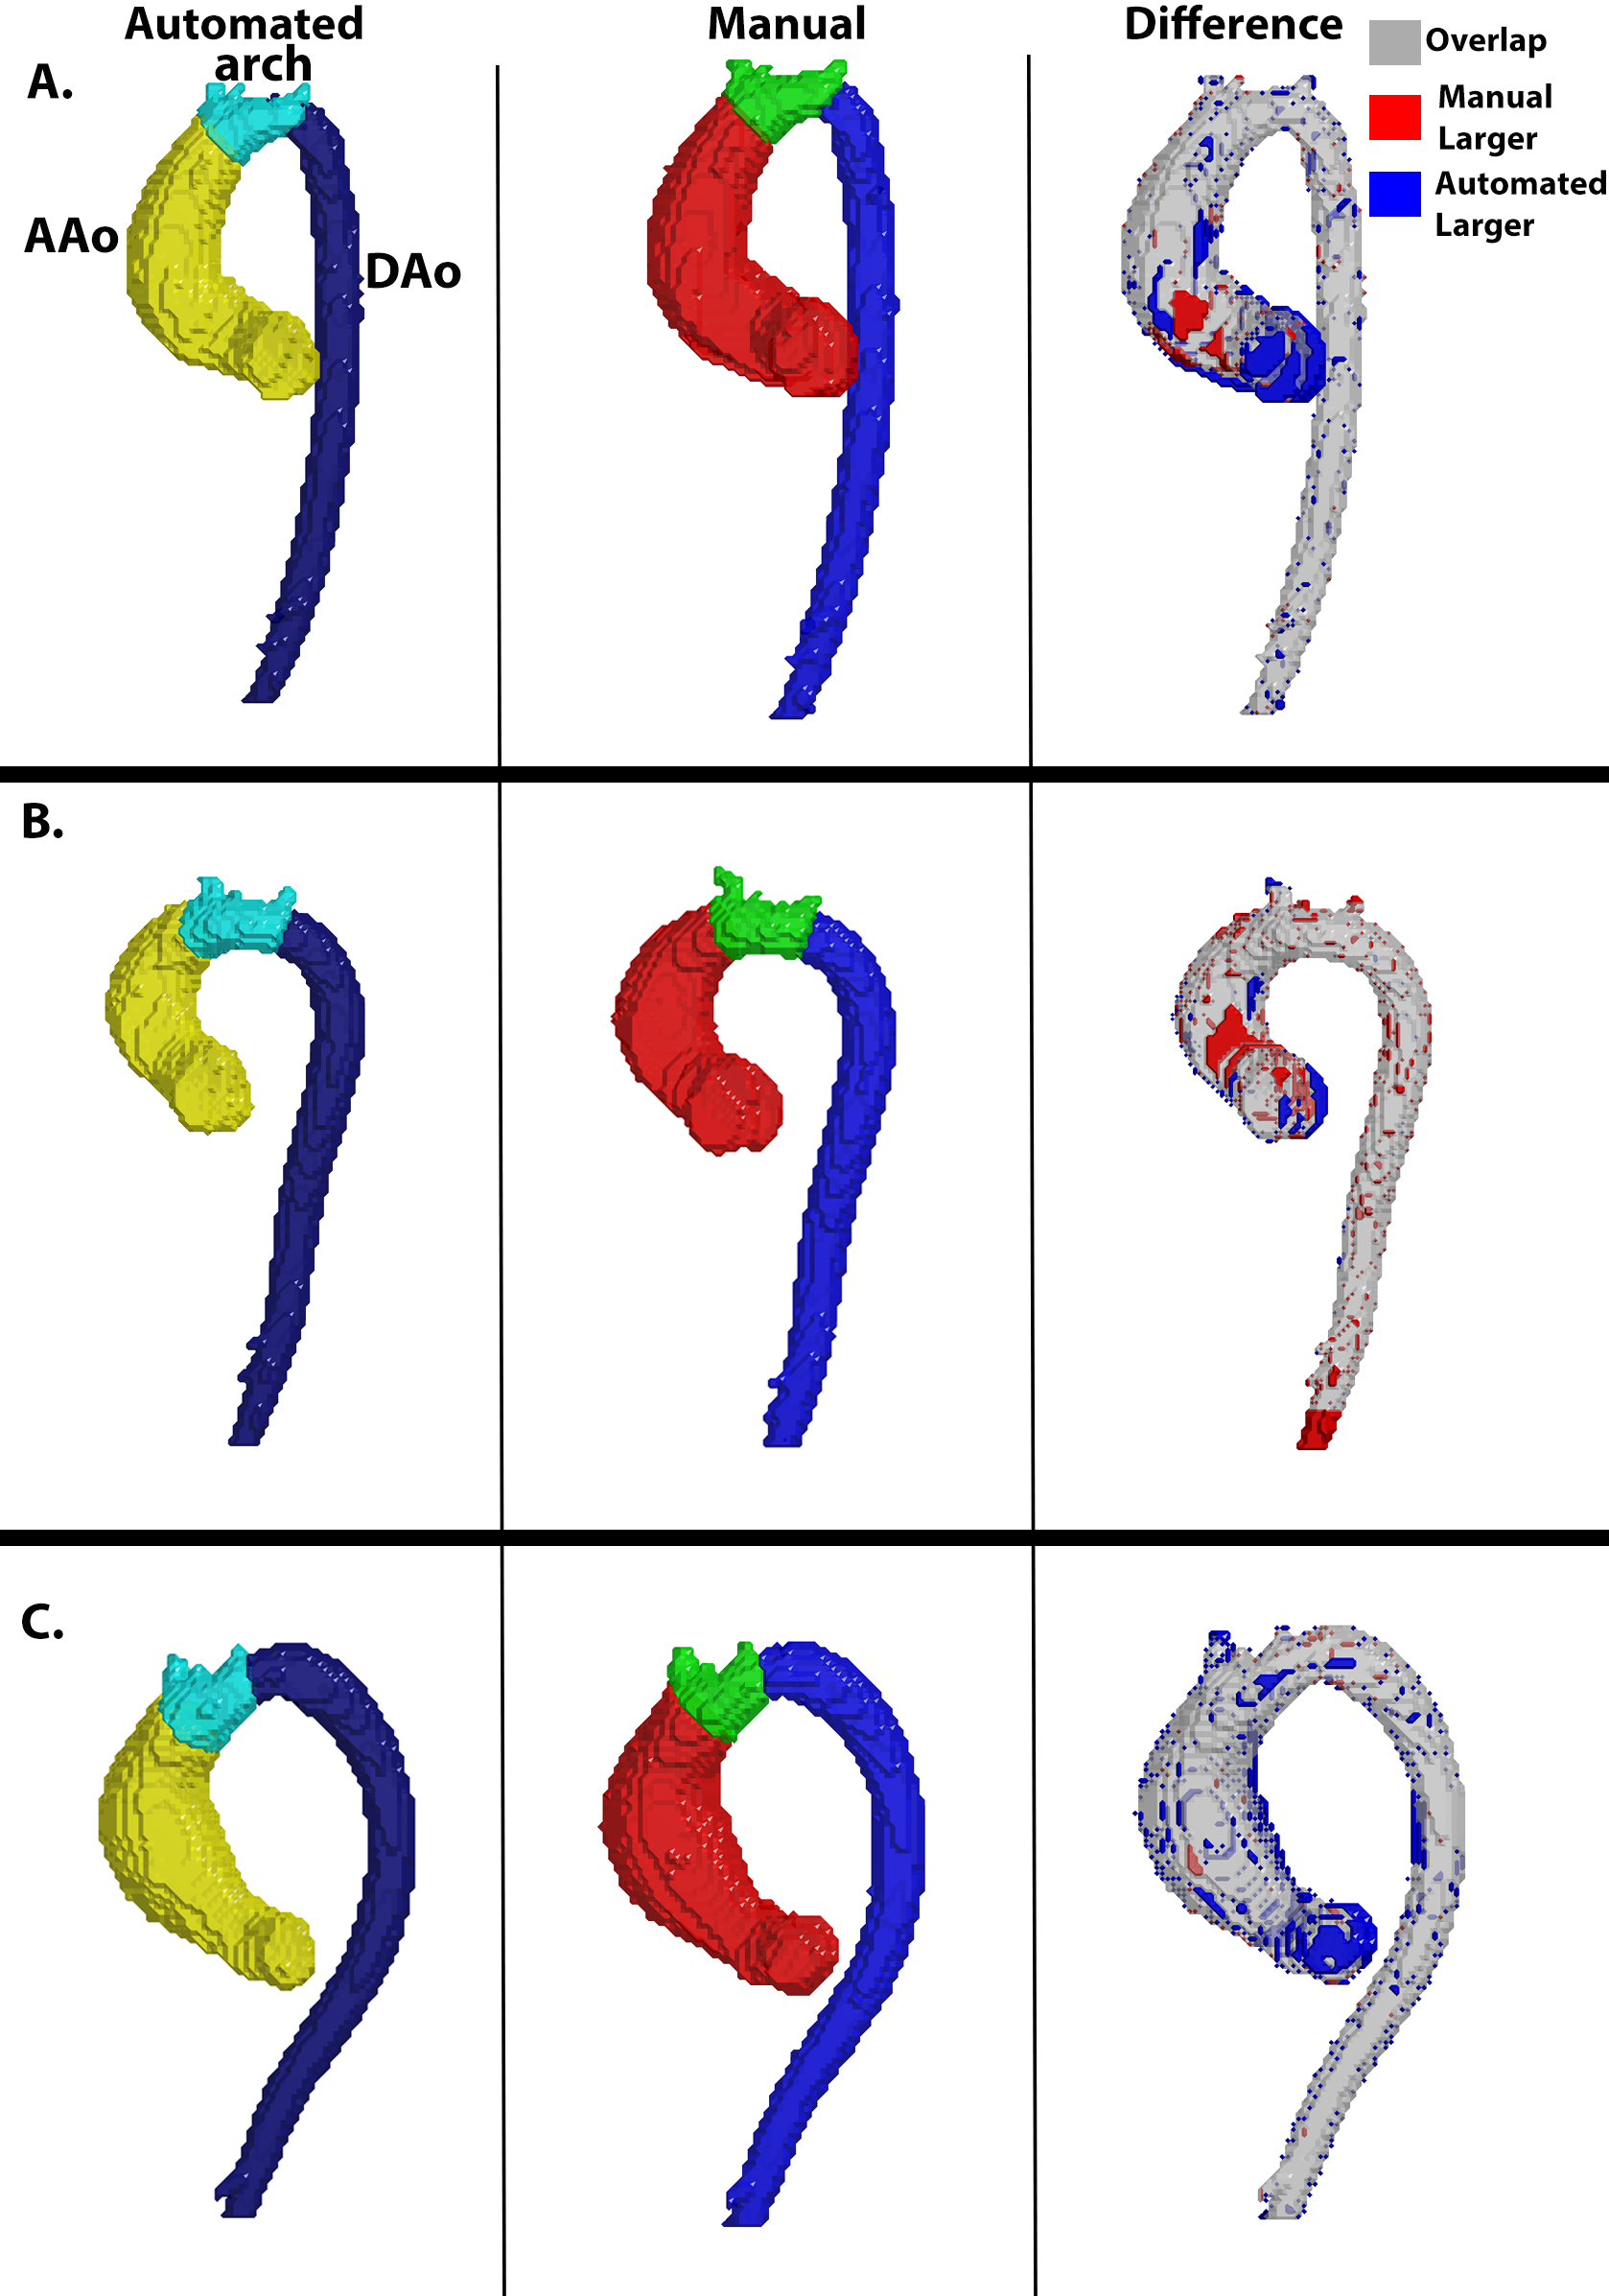
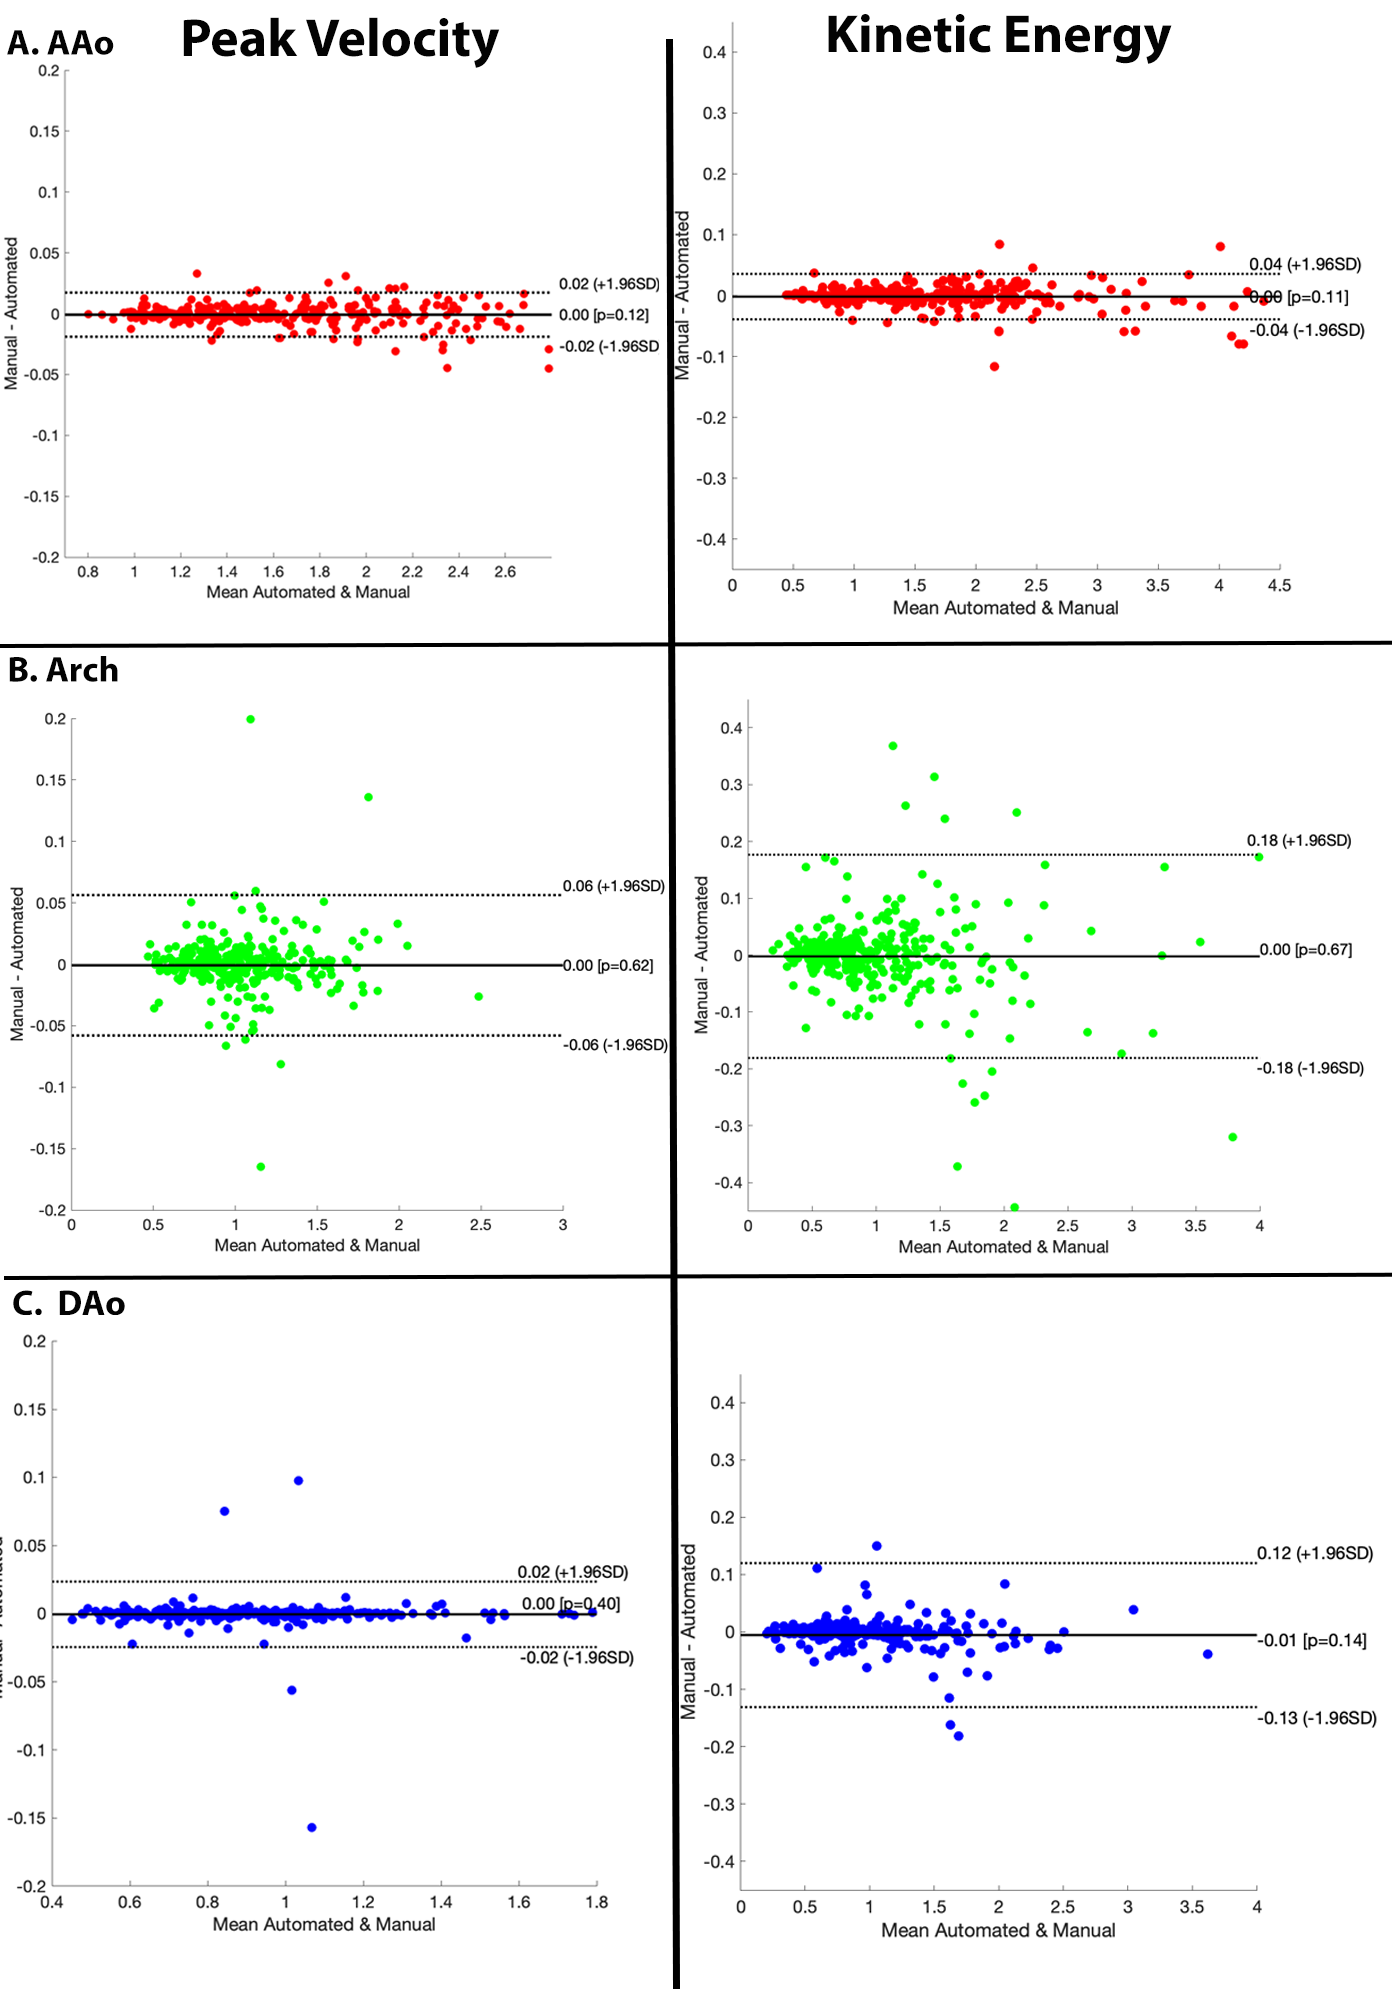
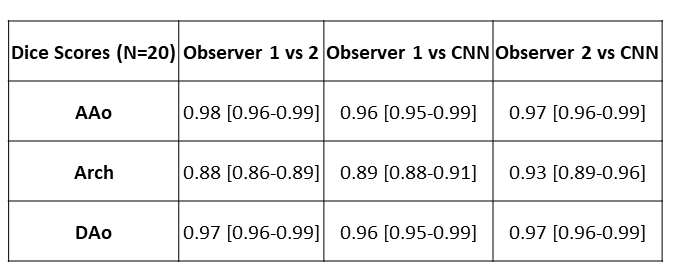
The CNN took on average 0.34±0.12 seconds to segment a multi-regional aorta. The median Dice scores was AAo: 0.95 [0.93-0.98], arch: 0.90 [0.89-0.95], and DAo: 0.95 [0.94-0.98]. Three examples of the manual (red, blue, green) and automated (yellow, cyan, dark blue) segmentations, along with their difference map, are provided in Figure 2. Each example demonstrates a unique aortic geometry, with the placement of the arch at three distinct locations. The Dice scores for Figure 2A were AAo: 0.95, arch: 0.95, DAo: 0.98; for Figure 2B, AAo: 0.95, arch: 0.88, DAo: 0.96; and Figure 2C, AAo: 0.95, arch: 0.86, DAo: 0.96. For flow comparisons, the Bland-Altman plots for peak velocity and kinetic energy across all regions are shown in Figure 3. For peak velocity, the Bland Altman showed excellent agreement with a low bias (<0.01 for all regions) and limits of agreements less than 10% of the mean values (AAo: ±0.02, arch: ±0.06, DAo: ±0.02). For kinetic energy, the Bland-Altman plots shows moderate to excellent agreement, with a low bias (<0.01 for AAo and arch, 0.01 for DAo) and limits of agreement between 5-15% of the mean values (AAo: ±0.04, arch: ±0.18, DAo: ±0.12). Interobserver comparisons are summarized in Table 1, with the CNN (median Dice scores: AAo: 0.96, 0.97; arch: 0.89, 0.93; DAo: 0.96,0.97 to the two observers) showing comparable performance to our observers (AAo: 0.98, arch: 0.88, DAo: 0.97).Discussion
In this study, we present a CNN for the fully automated, multi-regional segmentation of the aorta from 4D flow MRI. This can greatly accelerate the clinical workflow in obtaining hemodynamic analysis without requiring manual inputs. A limitation of this study is that the interobserver comparisons performed regional-labeling using the same 3D aorta segmentation, while the CNN performed both the 3D segmentation and regional-labeling independent of the ground-truth. Despite this bias, the CNN still showed excellent agreement with the observers. Another limitation is that the dataset was composed of BAV patients from a single vendor/center, preventing a systematic analysis of the CNN performance across various aortic diseases. Future direction of this study is to incorporate more patient datasets across multiple centers/vendors to further assess the CNN performance.Acknowledgements
This study was funded with support from the National Heart, Lung, and Blood Institute of the National Institutes of Health (F30 HL 145995, R01 HL 115828, R01 HL 133504).
References
1. Berhane, H., et al., Fully automated 3D aortic segmentation of 4D flow MRI for hemodynamic analysis using deep learning. Magn Reson Med, 2020. DOI: 10.1002/mrm.28257.
2. Huang, G., et al., Densely Connected Convolutional Networks. 2017 IEEE Conference on Computer Vision and Pattern Recognition (CVPR), 2017. DOI: 10.1109/cvpr.2017.243.
3. Çiçek, Ö., et al. 3D U-Net: Learning Dense Volumetric Segmentation from Sparse Annotation. 2016. Cham: Springer International Publishing.
Figures