2644
Cross Validation of a Deep Learning-Based ESPIRiT Reconstruction for Accelerated 2D Phase Contrast MRI
Jack R. Warren1, Matthew J. Middione2, Julio A. Oscanoa2,3, Christopher M. Sandino4, Shreyas S. Vasanawala2, and Daniel B. Ennis2,5
1Department of Computing + Mathematical Sciences, California Institute of Technology, Pasadena, CA, United States, 2Department of Radiology, Stanford University, Stanford, CA, United States, 3Department of Bioengineering, Stanford University, Stanford, CA, United States, 4Department of Electrical Engineering, Stanford University, Stanford, CA, United States, 5Cardiovascular Institute, Stanford University, Stanford, CA, United States
1Department of Computing + Mathematical Sciences, California Institute of Technology, Pasadena, CA, United States, 2Department of Radiology, Stanford University, Stanford, CA, United States, 3Department of Bioengineering, Stanford University, Stanford, CA, United States, 4Department of Electrical Engineering, Stanford University, Stanford, CA, United States, 5Cardiovascular Institute, Stanford University, Stanford, CA, United States
Synopsis
Phase Contrast MRI (PC-MRI) measures the flow of blood. In order to obtain high-quality measurements, patients must hold their breath for ~20 seconds, which oftentimes can be difficult. Advances in deep learning (DL) have allowed for the reconstruction of highly undersampled MRI data. A 2D PC-MRI DL-ESPIRiT network was recently proposed to undersample the data acquisition by up to 8x without compromising clinically relevant measures of flow accuracy within ±5%. This work uses k-fold cross validation to evaluate the DL-ESPIRiT network on 2D PC-MRI data in terms of accuracy and variability for pixel velocity, peak velocity, and net flow.
Background
Phase Contrast MRI (PC-MRI) is a quantitative imaging technique used to measure hemodynamic parameters throughout the cardiovascular system, including peak velocity [cm/s], flow rates [mL/min], and total flow [mL], to aid in the assessment and diagnosis of cardiovascular disease1,2. PC-MRI typically requires patients to hold their breath for ~20 seconds, which can be difficult for some patients. Recent developments in deep learning (DL) enable the reconstruction of highly undersampled MRI data. For example, DL-ESPIRiT has been shown to substantially reduce the breath-hold duration needed for cardiac cine imaging3-5. More recently, a modified DL-ESPIRiT network was proposed for reconstructing 2D PC-MRI datasets6 with up to 8x acceleration.Cross validation is a resampling procedure commonly used to evaluate DL networks trained on limited data samples (<1000s of studies). Cross validation is primarily used to estimate the repeatability of a DL network’s measurements on unseen testing data. Cross validation helps estimate network performance, in general, when used to make predictions on data not used during training. K-fold cross validation uses a parameter called k that refers to the number of groups that a given data sample is randomly split into. The objective of this work was to analyze measurement accuracy (bias) and precision (variance) in a 2D PC-MRI DL-ESPIRiT network using k-fold cross validation.
Methods
A previously described DL-ESPIRiT reconstruction framework designed for cardiac cine imaging5 was adopted for use with 2D PC-MRI data6. Fully sampled (FS) 2D PC-MRI datasets were obtained with institutional IRB approval and consent. All imaging was performed using either a 1.5T (n=23) or 3.0T (n=171) MRI system (GE Healthcare) and an ECG-gated spoiled gradient echo sequence. Using k-fold cross validation7 with eight folds (k=8), the 194 FS datasets were randomly divided into training/validation/testing cohorts with a 155/10/29 split. Data augmentation (image rotations, flips, crops, and translations),5 was applied and variable-density undersampling masks with 5-10x acceleration across the k-t plane were randomly generated and applied to each dataset during training. Eight networks were trained, one for each k-fold, using a batch size of one, five iteration steps, two residual blocks, and 64 feature maps. Test datasets were retrospectively undersampled by 5-10x and reconstructed using the trained DL network for each k-fold.Regions of interest (ROIs) were manually identified in Horos8 for a single vessel in each of the magnitude images. The ROIs were then imported into MATLAB (MathWorks), along with the reconstructed DICOMs, for quantitative flow analysis. Vessel ROI pixel velocity, peak velocity (calculated as the mean value of the top 5% of all pixels contained in each ROI), and total flow (calculated as the mean ROI velocity (cm/s) multiplied by the area of the ROI (cm2) integrated over the cardiac cycle, [mL]) were compared between the DL and FS data. For assessing the accuracy of each k-fold, the bias (median flow difference) was calculated for each acceleration rate for each flow metric. To assess the precision of each k-fold, the median and standard deviation from this set of median flow differences were reported, as well as the variance (maximums, minimums, and medians of the upper and lower bounds of the 95% confidence intervals (95%-CIs)) across the k-folds.
Results
Vessel ROI Pixel Velocity – For pixel-by-pixel velocity differences within the vessel ROIs (Fig. 1 and Table 1), the median differences (bias) across the 8 folds were ≤0.04% of the VENC and the medians for both the upper and lower 95%-CIs (variance) were ≤6.8% of the VENC for all acceleration rates. The standard deviation across the 8-folds were ≤0.04% of the VENC for all acceleration rates (Table 2).Flow – For total flow differences (Fig. 2 and Table 1), the median differences (bias) across the 8 folds were ≤0.95% and the medians for both the upper and lower 95%-CIs (variance) were ≤10.2% for all acceleration rates. The standard deviation across the 8-folds were ≤1.34% for all acceleration rates (Table 2).
Peak Velocity – For peak velocity differences (Fig. 3 and Table 1), the median differences (bias) across the 8 folds were ≤1.73% and the medians for both the upper and lower 95%-CIs (variance) were ≤8.8% for all acceleration rates. The standard deviation across the 8 folds were ≤1.17% for all acceleration rates (Table 2).
Conclusion
Applying the 2D PC-MRI DL network to undersampled images preserves accuracy of pixel velocity, flow, and peak velocity (≤2%) with reasonable measurement variance across folds (<6-11%). For all tested flow metrics, even at high acceleration rates there was minimal bias and variation in the median percent error across folds. Median percent error across all tested flow metrics remained small and all but one of the 95%-CI bounds (total flow difference at 10x) showed ≤10% error, demonstrating that the undersampled images reconstructed by the DL network preserved relatively precise flow metrics. Furthermore, because the median percent errors had minimal deviation (≤1.3%) across all acceleration rates for given flow metrics, the trained network has been shown to limit measurement bias relative to the FS data. Future work should explore ways to further improve network accuracy and improve network precision, by exploring the use of deeper networks, additional data augmentation techniques, and a change in network architecture using complex difference methods6.Acknowledgements
This project was supported, in part, by U01 EB029427 to SSV, support from GE Healthcare to DBE, and support from the Caltech SURF program to JAW.References
- Lotz J, Meier C, Leppert A, Galanski M. Cardiovascular flow measurement with phase- contrast MR imaging: basic facts and implementation. Radiographics 2002;22:651–671.
- Pelc NJ. Flow quantification and analysis methods. Magn Reson Imaging Clin N Am 1995;3:413–424.
- Sandino CM, Dixit N, Cheng JY, Vasanawala SS. Deep convolutional neural networks for accelerated dynamic magnetic resonance imaging. 2017 (pre-print).
- Schlemper J, Caballero J, Hajnal JV, Price A, Rueckert D. A deep cascade of convolutional neural networks for dynamic MR image reconstruction. IEEE Transactions On Medical Imaging 2018;37(2):491-503
- Sandino CM, Lai P, Vasanawala SS, Cheng JY. Accelerating cardiac cine MRI using a deep learning‐based ESPIRiT reconstruction. Magn Reson Med. 2020.
- Oscanoa JA, Middione MJ, Sandino CM, Vasanawala SS, Ennis DB. Accelerated 2D Phase Contrast MRI using deep learning-based reconstruction and direct complex difference estimation. SCMR 23rd Annual Meeting, Orlando, Florida, 2020.
- Dietterich TG. Approximate statistical tests for comparing supervised classification learning algorithms. Neural computation. 1998 Oct 1;10(7):1895-923.
- Horos DICOM-Viewer 2016. Available from: https://www.horosproject.org.
Figures
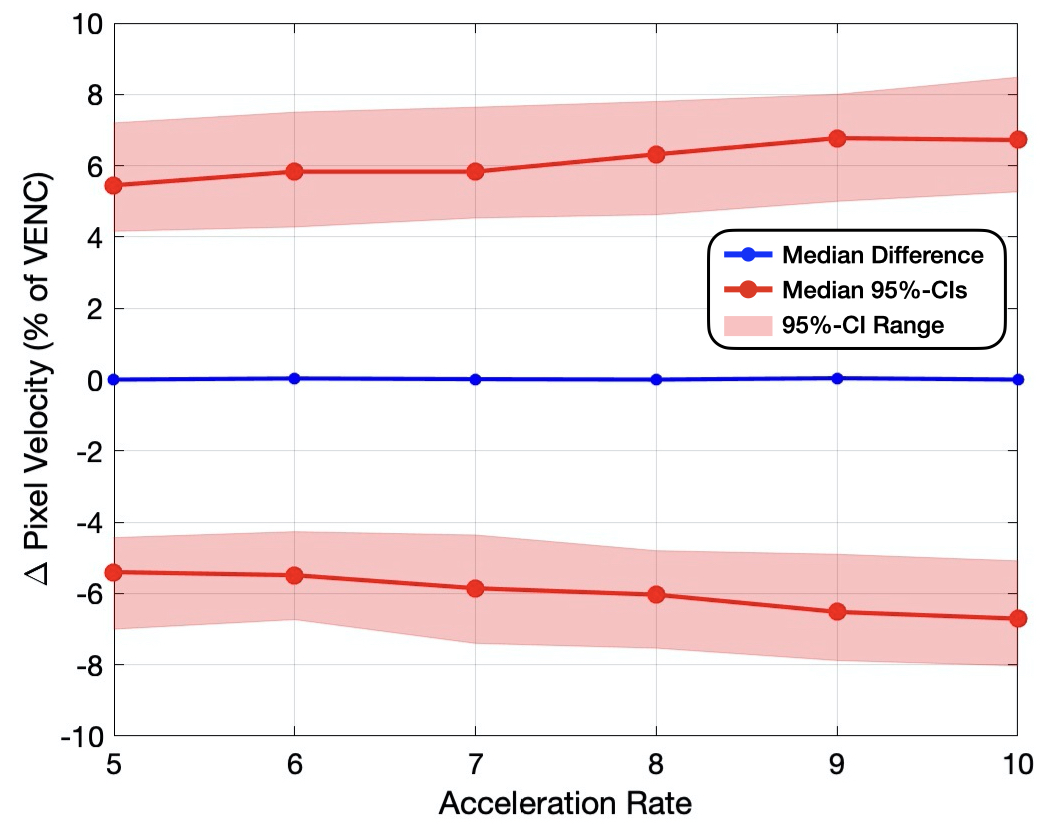
Figure 1: Vessel ROI pixel-by-pixel velocity
difference compared to FS (% of VENC) measured in percent error for acceleration rates 5-10x.
The maximum, minimum, and medians (variance) for both the upper and lower
bounds on the 95% confidence intervals are displayed for each acceleration rate
(red), as well as the median flow difference (bias) for the 8 folds (blue).
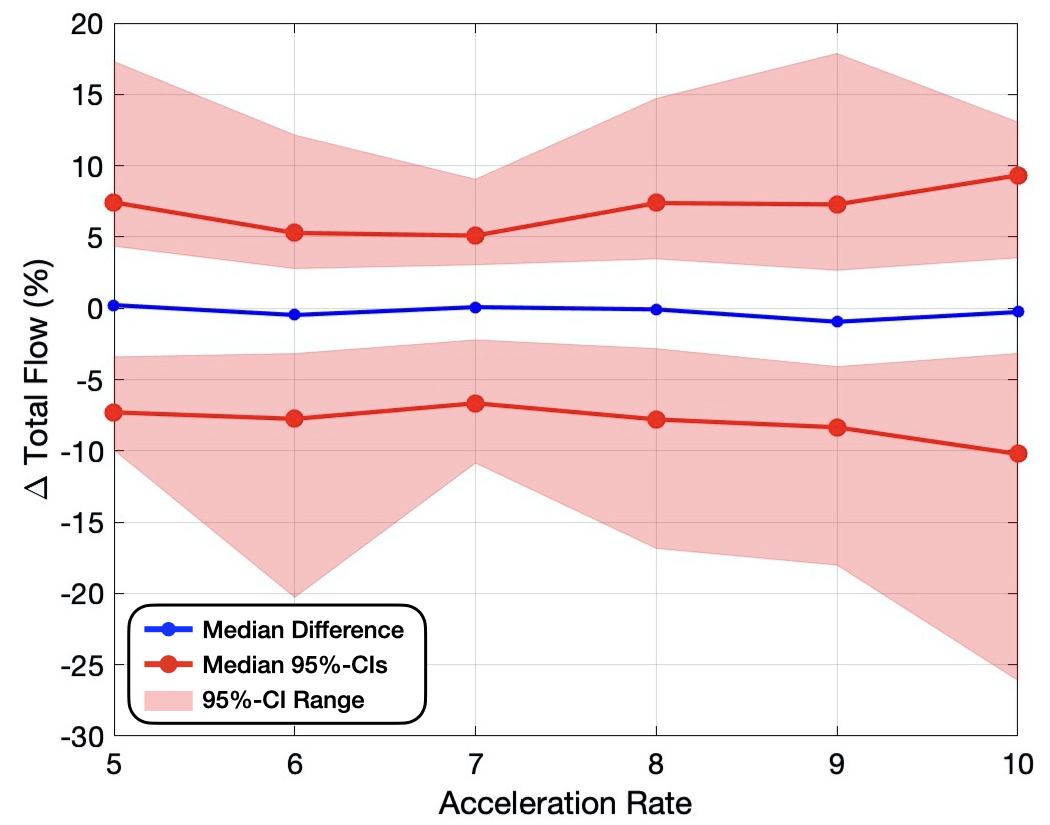
Figure 2: Total flow difference compared to FS (%) measured in
percent error for acceleration rates 5-10x. The maximum, minimum, and medians (variance)
for both the upper and lower bounds on the 95% confidence intervals are
displayed for each acceleration rate (red), as well as the median flow
difference (bias) for the 8 folds (blue).
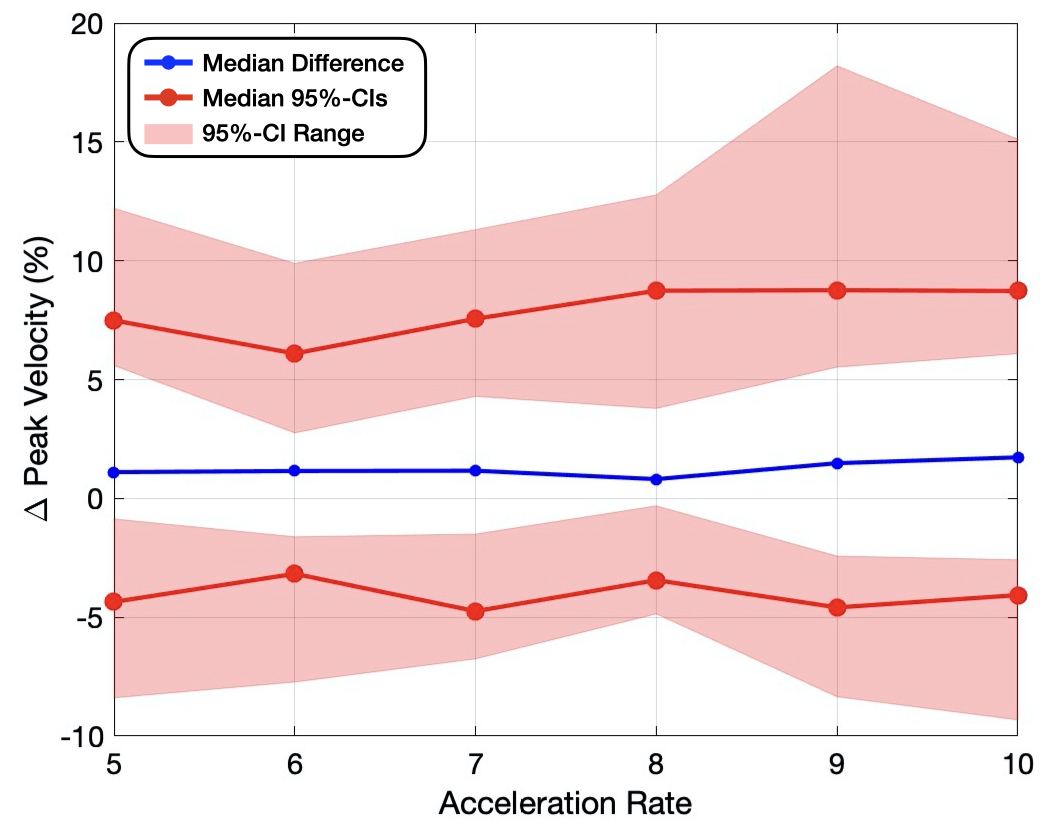
Figure 3: Peak velocity difference compared to FS (%) measured
in percent error for acceleration rates 5-10x. The maximum, minimum, and medians
(variance) for both the upper and lower
bounds on the 95% confidence intervals are displayed for each acceleration rate
(red), as well as the median flow difference (bias) for the 8 folds (blue).
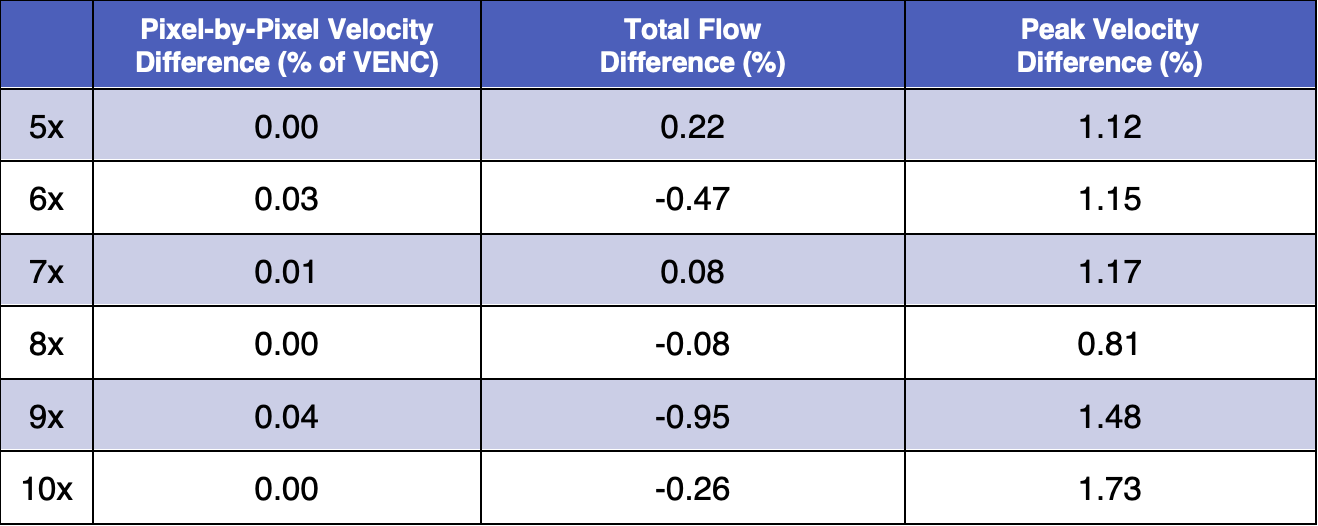
Table 1: Vessel ROI pixel-by-pixel velocity (%
of VENC), peak velocity (%), and total flow (%) differences compared to FS for acceleration
rates 5-10x. For each flow metric, the bias (median flow differences) for all 8
folds are reported.
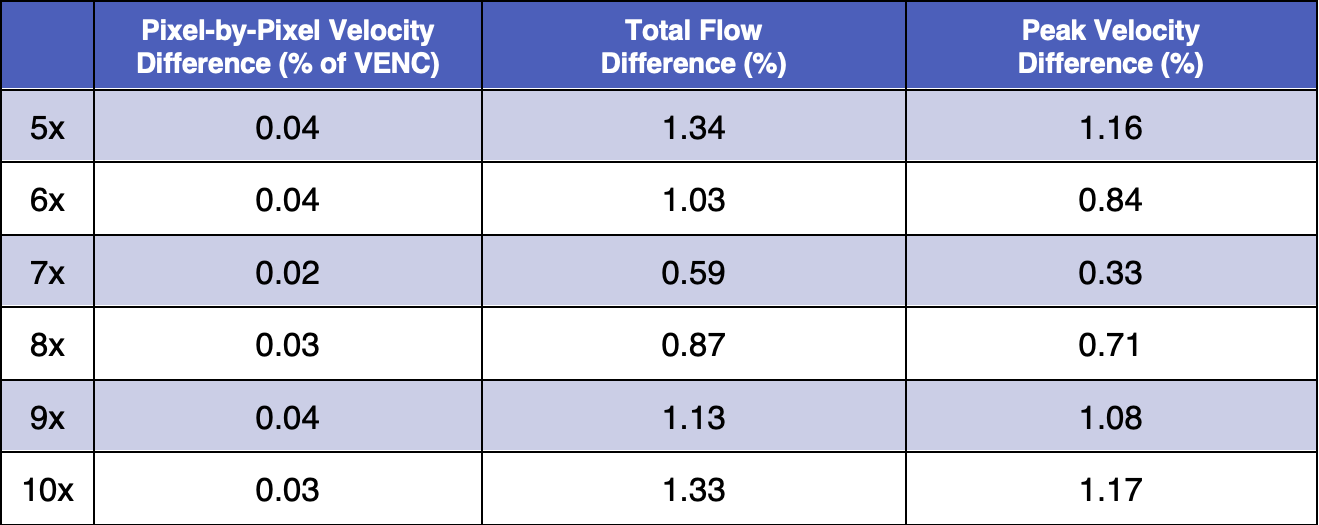
Table 2: Vessel ROI pixel-by-pixel velocity (%
of VENC), peak velocity (%), and total flow (%) differences compared to FS for acceleration
rates 5-10x. For each flow metric, the standard deviation of the median percent
error for the 8 folds is presented in the table.