2643
A Machine Learning Approach for Predicting cardiovascular event in HCM patient on Cardiac MRI
kankan hao1,2, yanjie zhu1,2, dong liang1,2, shihua zhao3, xin liu1,2, and hairong zheng1,2
1Paul C. Lauterbur Research Centre for Biomedical Imaging, Shenzhen Institutes of Advanced Technology, Chinese Academy of Sciences, shenzhen, China, 2University of Chinese Academy of Sciences, Beijing, China, 3Department of Magnetic Resonance Imaging, Fuwai Hospital and National Center for Cardiovascular Diseases, Chinese Academy of Medical Sciences, Peking Union Medical College, beijing, China
1Paul C. Lauterbur Research Centre for Biomedical Imaging, Shenzhen Institutes of Advanced Technology, Chinese Academy of Sciences, shenzhen, China, 2University of Chinese Academy of Sciences, Beijing, China, 3Department of Magnetic Resonance Imaging, Fuwai Hospital and National Center for Cardiovascular Diseases, Chinese Academy of Medical Sciences, Peking Union Medical College, beijing, China
Synopsis
Cardiac magnetic resonance(CMR) is a highly reliable measurement to assess and predict cardiovascular events. The traditional regression model need a linear assumption but it can not be guaranteed. We use a ML method to predict cardiovascular events in HCM patients. According to our result, the C statistic for the ML model (0.804 [95% CI, 0.757-0.850]) was higher than Cox regression model (0.764, [95% CI, 0.671-0.857]). With the random sample, the ROC for the ML model(0.96 in the training set, 0.83 in the test set) was higher than the regression model(0.80 in the training set, 0.79 in the test set).
Introduction
Cardiac magnetic resonance(CMR) is a highly reliable measurement to assess and predict cardiovascular events. The past researches show that CMR predictors such as late gadolinium enhancement (LGE) [1] and Left Ventricular Mass(LV mass) [2] were strongly associated with heart disease events, cardiovascular death, and heart failure. However, comprehensive risk stratification of HCM patients is still a challenging work. Nowadays, the majority of risk models were constructed with traditional statistical methods. Among all methods, cox proportional hazards regression is one of the most useful multivariate analyses because it can analyze data with truncated survival time regardless of survival distribution type [3]. The traditional regression model usually assumes a linear relationship between the risk factor and prediction. However, in most cases, it can not be guaranteed. The past research showed that the relationship between LGE and outcome in Dilated Cardiomyopathy is nonlinear.[4] On the other hand, Machine learning (ML) techniques show a vast potentiality on risk stratification. Compared with a traditional regression, Tree-based learning algorithms such as Gradient Boosting Decision Tree (GBDT), as a kind of data derived method, do not need to meet a linear assumption and have a fabulous ability to deal with multivariable data. The past study shows that a machine learning method, compared with a traditional model, has a better ability to predict clinical outcomes in young patients with hypertension[5]. This study used an ML method that includes the LightGBM and Recursive Feature Elimination (RFE) to predict cardiovascular events in HCM patients. Unlike the regression model, LightGBM as a special GBDT model, can deal with both linear and nonlinear data simultaneously [6]. Our result shows that compared with the Cox regression, the ML model has better predictive ability for cardiovascular event in HCM patient. We also use a cubic spline model to test the relationship between the risk factor and the outcome. According to our result, there is a non-relationship between the risk factor and outcome in some critical risk factors.Materials and Methods
We collected 268 HCM patients including 33 cardiovascular events, from Jan 2012 to Dec 2013 in Fuwai Hospital Nation Center for Cardiovascular Diseases of China. Institutional review board approval was obtained for this study. All patients were followed-up via clinic visit or telephone interview every six months after CMR examination. CMR images of all the HCM patients were obtained by a clinical 1.5T MR scanner (MAGNETOM Avanto, Siemens Healthcare), which implemented an electrocardiographic and respiratory gating with a unified protocol. In our data, we choose 44 different variables, including common clinical variables and CMR variables. Our ML model was designed by a combination feature selection model and a prediction model. In the first part, the potential risk predictors were selected by a Recursive Feature Elimination (RFE) model. It is a popular feature selection method identified as the most influential factor for each classifier. In the second part, we use LightGBM as our prediction model. In order to assess our model more comprehensively, we use 5-fold cross-validation and independent testing to estimate the performance of our model.Result
For the ML model, the highest C statistic was achieved when 12 of the 44 variables were selected and analyzed by the RFE and LightGBM combination. By order of importance, these features include 3D Systolic Apical long Strain, BMI, 3D Global long Strain, Gender, chest distress, mitral valve, the high voltage of left ventricular,NYHA, LGE category, SAM, LVMWT, and ventricular premature beat. The models' performances were compared using C statistic for discrimination with 5-fold cross-validation and the ROC for discrimination with a random sample of 80:20. The Cox regression was constructed to predict outcomes at 42 months. According to our result, the C statistic for the ML model (0.804 [95% CI, 0.757-0.850]) was higher than Cox regression model (0.764, [95% CI, 0.671-0.857]).With the random sample, the ROC for the ML model(0.96 in the training set, 0.83 in the test set) was higher than the regression model(0.80 in the training set, 0.79 in the test set).According to our result, the strain-related feature shows a strong relationship with the cardiovascular event. Our data has six main strain indexes, and the ML model chooses Systolic Apical Strain and 3D Global long Strain as our main predictors. The cubic spline model was fitted to examine the association between potential strain related risk factor and outcome. The result was adjusted by gender. According to our result, the 3D Systolic Apical long Strain shows a nonlinearity in 95% significance level(p = 0.036), but 3D Global long Strain does not(p = 0.179). Our result shows that in the HCM prediction model, the linear assumption is unlikely to be totally satisfied, so we prove theory support for ML model's better performance compared with the Cox regression model.
Conclusion
In conclusion, we used a novel ML technique to select 12 risk variables and construct a nonlinear prognostic model to predict the risk of HCM patients. According to our result, the ML approach shows a better forecast ability than Cox regression. We also prove a nonlinear relationship of crucial predictors, which prove theoretical support for our result.Acknowledgements
This work is supported in part by the National Natural Science Foundation of China under grant nos. 61771463,81971611, National Key R&D Program of China nos. 2020YFA0712202, 2017YFC0108802 , the Innovation and Technology Commission of the government of Hong Kong SAR under grant no. MRP/001/18X, and the Chinese Academy of Sciences program under grant no. 2020GZL006..References
1. Cheng, Sainan, Fang, et al. LGE-CMR-derived texture features reflect poor prognosis in hypertrophic cardiomyopathy patients with systolic dysfunction: preliminary results[J]. EUROPEAN RADIOLOGY, 2018. 2. Kawel-Boehm N , Kronmal R , Eng J , et al. Left Ventricular Mass at MRI and Long-term Risk of Cardiovascular Events: The Multi-Ethnic Study of Atherosclerosis (MESA)[J]. Radiology, 2019, 293(1):182871. 3. Goldstein B A , Marie N A , Carter R E . Moving beyond regression techniques in cardiovascular risk prediction: applying machine learning to address analytic challenges[J]. European Heart Journal, 2016(23):1805. 4. Halliday B P , John B A , Ankur G , et al. Outcome in Dilated Cardiomyopathy Related to the Extent, Location, and Pattern of Late Gadolinium Enhancement[J]. JACC: Cardiovascular Imaging, 2018:S1936878X18306703-. 5. Wu X , Yuan X , Wang W , et al. Value of a Machine Learning Approach for Predicting Clinical Outcomes in Young Patients With Hypertension[J]. Hypertension, 2020, 75(5):HYPERTENSIONAHA11913404. 6. Ke G, Meng Q, Finley T, et al. Lightgbm: A highly efficient gradient boosting decision tree[C]//Advances in neural information processing systems. 2017: 3146-3154.Figures
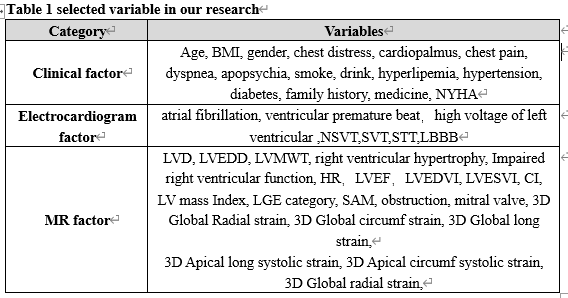
this table show all variable we choose in our research.
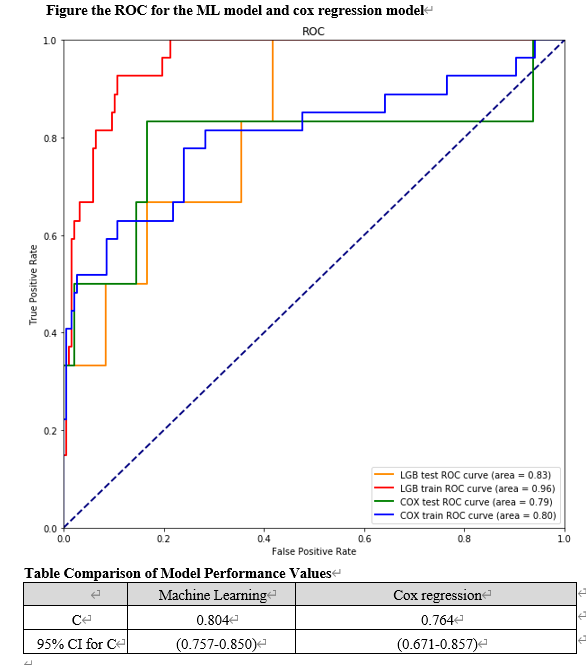
Figure show the ROC for the ML model and cox
regression model with a random sample of 80:20. Table show the result of ML model and cox regression model in 5 fold cross validation. C-statistic will be used to evaluate the result of our model in the table.
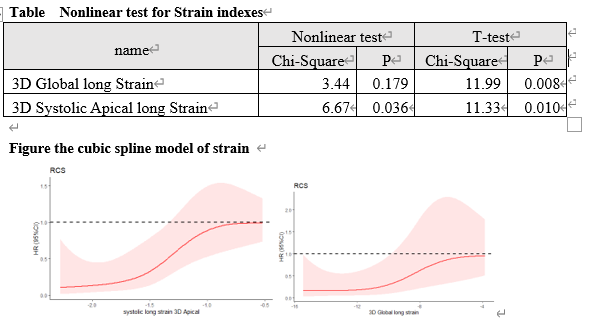
table show the non-linear test for strain index. It is clear that there are a non linear relationship of 3D Systolic Apical long Strain.