2642
Deep Learning for MR Vessel Wall Imaging: Automated Detection of arterial vessel wall and plaque
Wenjing Xu1,2,3,4, Xiong Yang5, Yikang Li1,3,4, Jin Fang6, Guihua Jiang6, Shuheng Zhang5, Yanqun Teng5, Xiaomin Ren5, Lele Zhao5, Jiayu Zhu5, Qiang He5, Hairong Zheng1,3,4, Xin Liu1,3,4, and Na Zhang1,3,4
1Paul C. Lauterbur Research Center for Biomedical Imaging, Shenzhen Institutes of Advanced Technology, Chinese Academy of Sciences, Shenzhen, China, 2Faculty of Information Technology, Beijing University of Technology, Beijing, China, 3Key Laboratory for Magnetic Resonance and Multimodality Imaging of Guangdong Province, Shenzhen Institutes of Advanced Technology, Chinese Academy of Sciences, Shenzhen, China, 4CAS key laboratory of health informatics, Shenzhen Institutes of Advanced Technology, Chinese Academy of Sciences, Shenzhen, China, 5Shanghai United Imaging Healthcare Co., Ltd., Shanghai, China, 6Department of Radiology, Guangdong Second Provincial General Hospital, Guangzhou, China
1Paul C. Lauterbur Research Center for Biomedical Imaging, Shenzhen Institutes of Advanced Technology, Chinese Academy of Sciences, Shenzhen, China, 2Faculty of Information Technology, Beijing University of Technology, Beijing, China, 3Key Laboratory for Magnetic Resonance and Multimodality Imaging of Guangdong Province, Shenzhen Institutes of Advanced Technology, Chinese Academy of Sciences, Shenzhen, China, 4CAS key laboratory of health informatics, Shenzhen Institutes of Advanced Technology, Chinese Academy of Sciences, Shenzhen, China, 5Shanghai United Imaging Healthcare Co., Ltd., Shanghai, China, 6Department of Radiology, Guangdong Second Provincial General Hospital, Guangzhou, China
Synopsis
The rupture of unstable or vulnerable atherosclerotic plaque is the major cause of ischemic stroke. Manual analysis of the vessel wall and plaque is labor-intensive and experience dependent. The purpose of this study is to develop an automatic method to segment the vessel wall and lumen contour for quantitative measurement. In this work, a CNN architecture for fully automated segmentation of arterial lumen and vessel wall on MR vessel wall images was developed and evaluated on ischemic stroke patients. In conclusion, we proposed a good performance automatic analysis method for the vessel wall and is important for plaque analysis.
Introduction
One of the main mechanism leading to ischemic stroke is the rupture of unstable or vulnerable atherosclerotic plaque [1]. Comfirming and risk-stratifying the vulnerable plaques is especially important for clinical prevention and treatment of ischemic stroke [2, 3]. Magnetic resonance vessel wall imaging (MRVWI) can directly visualize arterial vessel wall and characterize vulnerable plaques [4, 5]. Quantitative morphologic measurements of arterial vessel wall and plaques derived from MRVWI have been proven to be the imaging markers to monitor progression and regression of ischemic stroke during medical management or drug development. However, the quantitative measurements are currently of limited use in clinical practice because the segmentation of the vessel wall and plaque manually is labor-intensive and requires continuous training of the personnel and the segmentation results depends heavily on the expert’s knowledge and experience [6]. In this work, a modified V-net based deep learning architecture for fully automated segmentation of arterial lumen and vessel wall on MRVWI was developed and evaluated on a large cohort of patients with ischemic stroke [7, 8].Methods
MRVWI images were acquired from 124 patients with intra- or extra-cranial atherosclerotic disease on a 3-Tesla whole-body MR system (uMR 790, United Imaging Healthcare, Shanghai, China). 2D slices reconstructed from 7 arterial segments which included common carotid artery (CCA), internal carotid artery (ICA), anterior cerebral artery (ACA), middle cerebral artery (MCA), basilar artery (BA), vertebral artery (VA), and posterior cerebral artery (PCA) of 105 patients were used for building the deep learning model. The ground truth was generated on the reconstructed 2D images by two experienced radiologist in consensus. Automatic segmentation of deep learning was performed using the 2D Vnet, which is a fully connected convolutional with residual block network [8] (see Figure1). Based on the manual and automatic obtained segmentation results, the lumen area, vessel wall area, maximum wall thickness, and normalized wall index (NWI) were calculated and compared. The automatic segmentation performance was evaluated using Dice Similarity Coefficient (DSC), distance of similarity (DoS) for evaluating the similarity of the two approaches, and average surface distance (ASD) in mm for measuring the quality of segmentation.Results
The proposed automatic method demonstrated satisfactory agreement of arterial vessel wall segmentation with manual method with DSC of 93.4% for the lumen contour and 85.4% for the vessel wall contour. The ASD between automatic and manual methods of the 7 arterial segments (CCA, ICA, ACA, MCA, BA, VA, and PCA), respectively are shown in Figure 2. The DoS of the 7 arterial segments for lumen and vessel wall contours are illustrated in Figure 3. They were all greater than 94% for lumen contour detection. For vessel wall contour detection, the comparison results of manual and automatic were 96.7% for CCA and 96.5% for BA, respectively. The lowest value is 87.3% of ICA. The summary of ASD and DSC of the 9 test subjects are summarized in Table1, the mean±sd of ASD and DSC are 0.070±0.021 and 0.114±0.046 for lumen, respectively. the mean±sd of ASD and DSC are 95.5±0.009 and 89.1±0.016 for vessel wall, respectively. Two representative segmentation results from 2 patients are illustrated in Figure 4. Our method was able to provide a reasonable segmentation result of lumen and vessel wall contour.Discussion
A fast and accurate detection method of the vessel wall and lumen contour is useful for rapid qualitative and quantitative analysis of plaque in arteries vessels. In this study, we present an automatic approach to segment the contour of the vessel wall and lumen for the MRVWI images. It can be used to determine the plaques, and identify patients at risk of stroke in MRI scans. This procedure was fully automatic applying a deep learning technique based on a convolutional neural network. Without user interaction is the main advantage of our method. The analysis of plaque relies heavily on the effect of vessel wall segmentation. However, due to the vessel wall is a very thin soft tissue structure and low contrast with the surrounding tissues, it is a challenging task to do segmentation. For traditional manual segmentation methods, even by experienced experts, it’s also difficult to be fast and accurate. The convolutional neural network has achieved achievements in the segmentation of medical images area. It can automatically learn abundant image features to achieve good segmentation results.Acknowledgements
The study was partially support by National Natural Science Foundation of China (81830056), Natural Science Foundation of Guangdong Province (2018A030313204), and Shenzhen Basic Research Program (JCYJ20180302145700745 and KCXFZ202002011010360).References
[1] Mooe T, Olofsson BO, Stegmayr B, Eriksson P: Ischemic stroke. Impact of a recent myocardial infarction. Stroke 1999, 30(5):997-1001.[2] Chen YC, Huang AL, Kyaw TS, Bobik A, Peter K: Atherosclerotic Plaque Rupture: Identifying the Straw That Breaks the Camel's Back. Arteriosclerosis Thrombosis & Vascular Biology 2016, 36(8):e63.[3] Pelisek J, Eckstein HH, Zernecke A: Pathophysiological Mechanisms of Carotid Plaque Vulnerability: Impact on Ischemic Stroke. Arch Immunol Ther Exp 2012, 60(6):431-442.[4] Fayad Z, Fuster V: Characterization of Atherosclerotic Plaques by Magnetic Resonance Imaging. Annals of the New York Academy of ences 2000, 902(1):173-186.[5] Dieleman, Nikki, van, der, Kolk, Anja, G., Zwanenburg, Jaco, J.: Imaging Intracranial Vessel Wall Pathology With Magnetic Resonance Imaging. Circulation 2014, 130(2):192-201.[6] Taghanaki SA, Abhishek K, Cohen JP, Cohen-Adad J, Hamarneh G: Deep Semantic Segmentation of Natural and Medical Images: A Review. Artificial Intelligence Review:1-42.[7] Ohsaka A: [Artificial intelligence (AI) and hematological diseases: establishment of a peripheral blood convolutional neural network (CNN)-based digital morphology analysis system]. Rinsho Ketsueki 2020, 61(5):564-569.[8] Milletari F, Navab N, Ahmadi SA: V-Net: Fully Convolutional Neural Networks for Volumetric Medical Image Segmentation. In: 2016 Fourth International Conference on 3D Vision (3DV): 2016; 2016.Figures
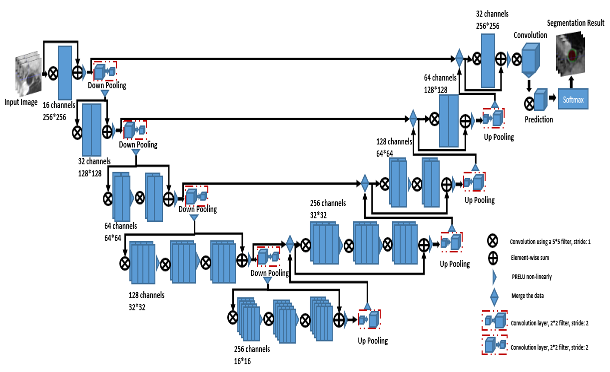
Figure 1: The architecture of the 2DVet network.
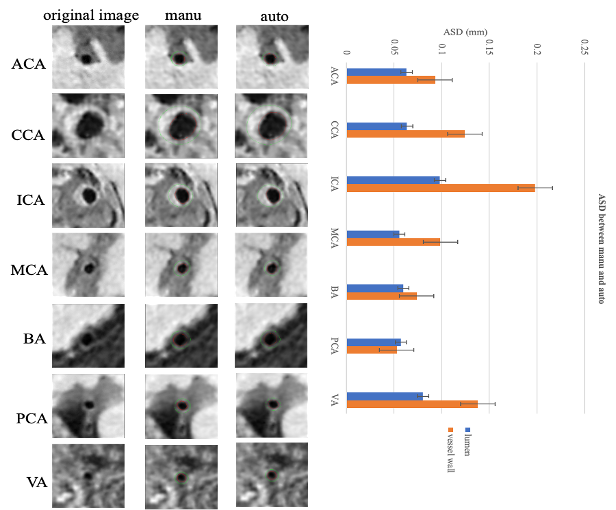
Figure 2: The representative images and ASD between manual and automatic methods of the 7 arterial segments. On the left, the first column represents the raw data, the second column represents the manual result and the third represents the segmented lumen contour and vessel wall contour results of the 7 arterial segments. The red contour represents the lumen and the green contour represents the vessel wall. ASD distances of the 7 arterial segments are shown on the right using barplot.
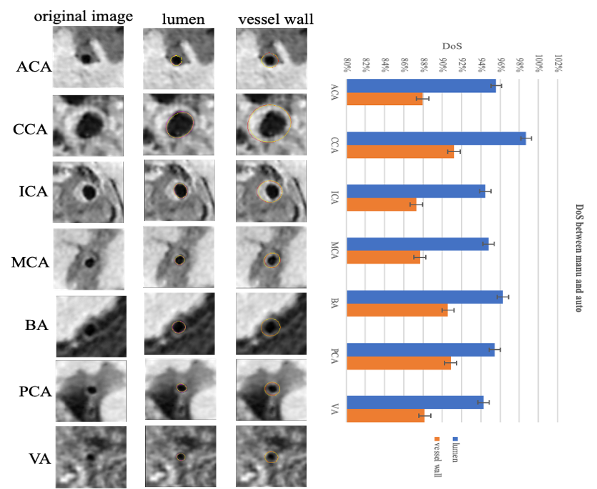
Figure 3: The representative images and Dos between manual and automatics of the 7 arterial segments. On the left, the first column represents the original image, in the second column, the yellow contour represents manual results and the purple represents the segmented results of lumen. In the third column, the yellow contour represents manual results and the red represents the segmented results of vessel wall. DoS of the 7 arterial segments are shown on the right using barplot.
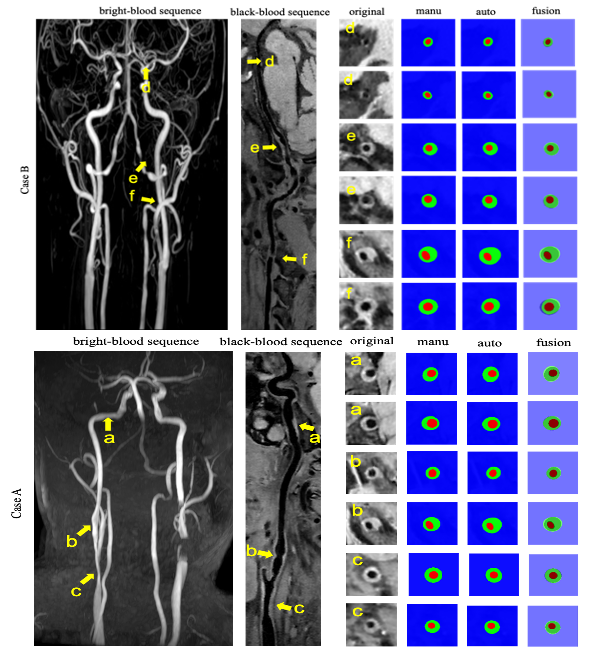
Figure 4: The representative images and segmentation results from two clinical cases. Case A and Case B represent the images with anterior circulation and posterior circulation, respectively.
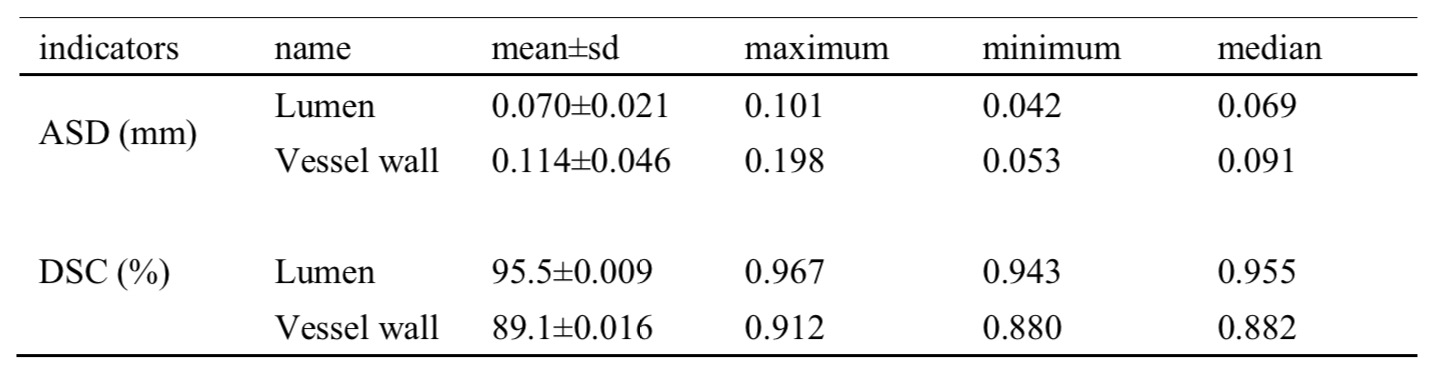
Table 1: ASD and average DSC of all 9 subjects images.