2639
Deep phenotyping of individuals with arrhythmogenic cardiomyopathy-associated genetic variants using myocardial T1 and T2 mapping1Geisinger, Danville, PA, United States
Synopsis
As genomic screening initiatives expand, pre-symptomatic identification of genetic risk of disease is increasingly common. For example, Geisinger’s Genomic Screening and Counseling program has identified carriers of rare variants associated with arrhythmogenic cardiomyopathy, but most have no clinical diagnosis. We explored whether myocardial T1 or T2 maps or synthetic extracellular volume (sECV) in these patients could assist in risk stratification by identifying pre-clinical myocardial abnormalities. We compared these quantitative measures to those of controls with a normal cardiac MRI. Native T1 was significantly elevated in asymptomatic variant carriers; however, T2, post-contrast T1, and sECV values were comparable.
Background
Clinical genomic testing is rapidly expanding, allowing for identification of disease-causing variants before symptom onset. While this approach has obvious potential for limiting progression of or even preventing disease, clinical management in this setting is problematic for diseases with incomplete penetrance. For example, in patients with rare pathogenic variants in desmosomal genes associated with arrhythmogenic cardiomyopathy (ACM), the risk of developing disease in the absence of an observable phenotype or immediate family history is likely low1,2. Despite this limitation, genomic screening guidelines recommend clinical evaluation and close follow up of these patients due to known associations between ACM and sudden cardiac death3. Since only a fraction of these patients will end up truly developing ACM and needing treatment, more advanced methods of “deep phenotyping” are needed in order to uncover early disease.Myocardial T1 and T2 mapping are increasingly used in clinical settings due to their ability to quantify subtle, diffuse tissue properties associated with disease. These data have predicted adverse disease outcomes in patients with dilated cardiomyopathy4. Associations of T1 or T2 values with ACM and/or desmosomal variant carriers have not been thoroughly studied5; however, differences in asymptomatic genetic variant carriers have been noted for hypertrophic cardiomyopathy6. We hypothesized that patients with desmosomal variants would have abnormalities in left ventricular native T1, T2, post-contrast T1, or synthetic extracellular volume (sECV) values.
Methods
The Geisinger MyCode Project is a precision health initiative in which exome sequence data from 180,000 Geisinger patients is linked to patient health records for discovery research. In tandem, MyCode’s Genomic Screening and Counseling Program is clinically notifying individuals identified with rare variants in disease-associated genes, such as four genes associated with ACM: desmoplakin (DSP), desmocollin-2 (DSC2), desmoglein-2 (DSG2), or plakophilin-2 (PKP2). We reviewed all available cardiac MRI (CMR) studies with myocardial mapping and delayed enhancement acquired from these individuals with rare variants. Patients who met ACM diagnostic criteria were excluded. For comparison, we identified all clinical studies with myocardial mapping (2017-2019) that were physician-interpreted as "normal". We further excluded patients from both groups with evidence of hypertrophic cardiomyopathy, ischemic heart disease, cardiac sarcoidosis, or harboring another known cardiomyopathy variant (e.g. MYBPC3 or MYH7). All studies were performed on a single 1.5T Siemens Aera using the same myocardial mapping protocols. Conservative segmentation of the left ventricle (LV) midwall was performed in the basal, mid-ventricle, and apical slices. A published calibration curve was used for computing sECV.7 Mean values were compared between groups using student’s unpaired t-test with false discovery rate correction.8 Categorical atypical late gadolinium enhancement (LGE) was compared using Fisher’s exact test.Results
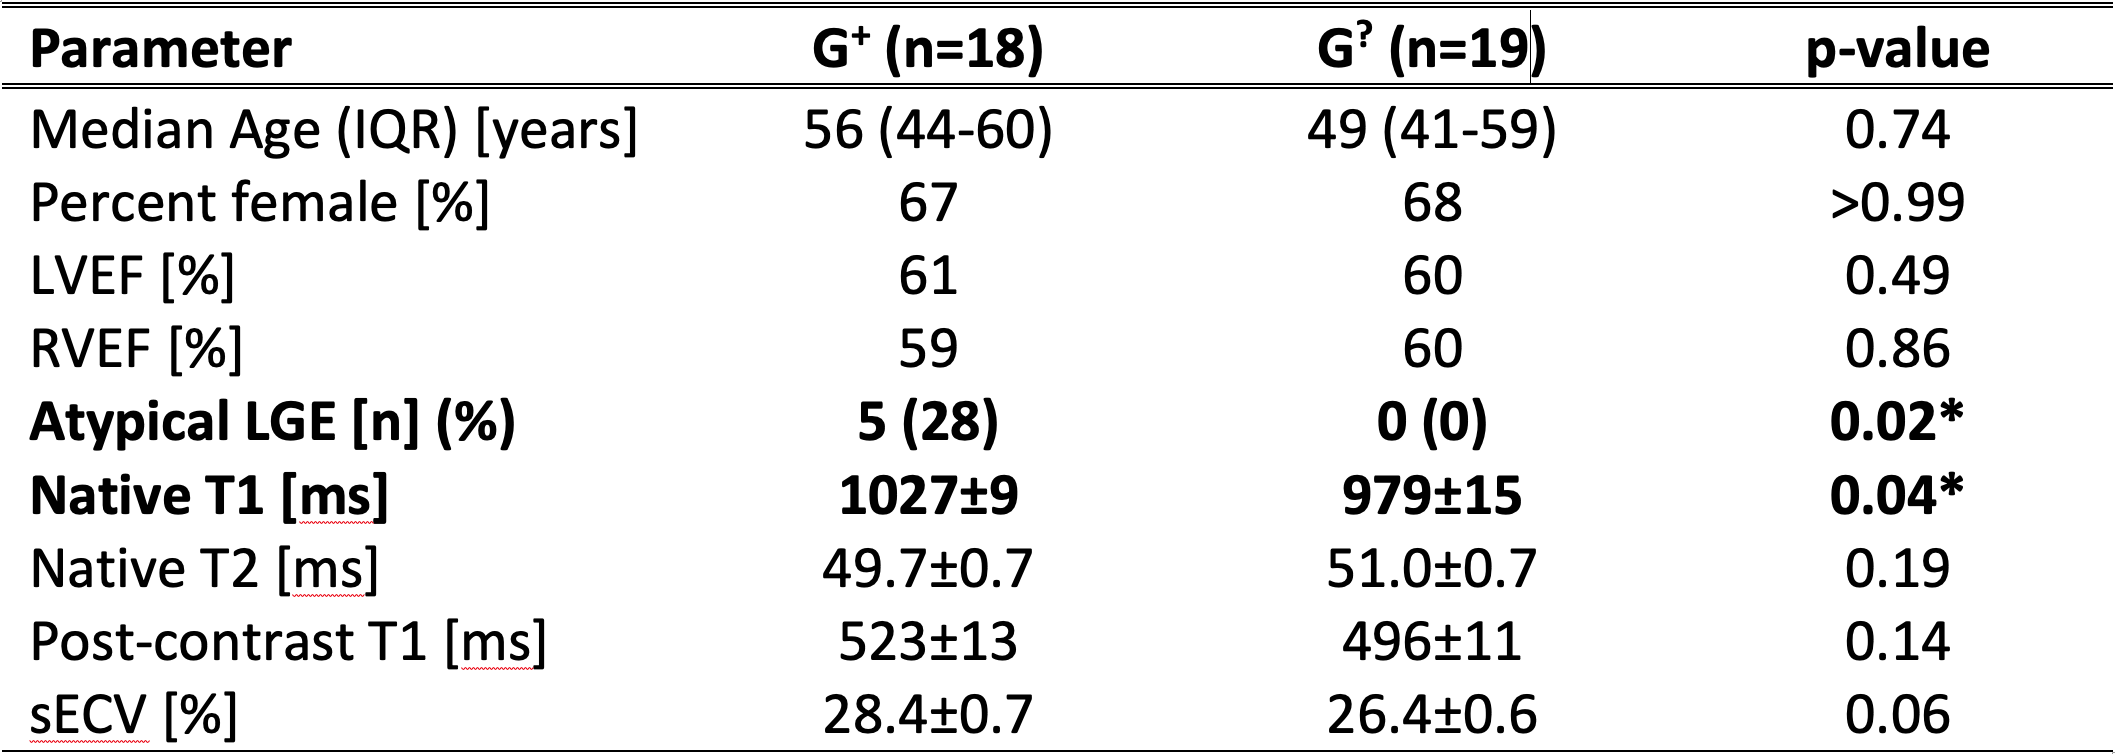
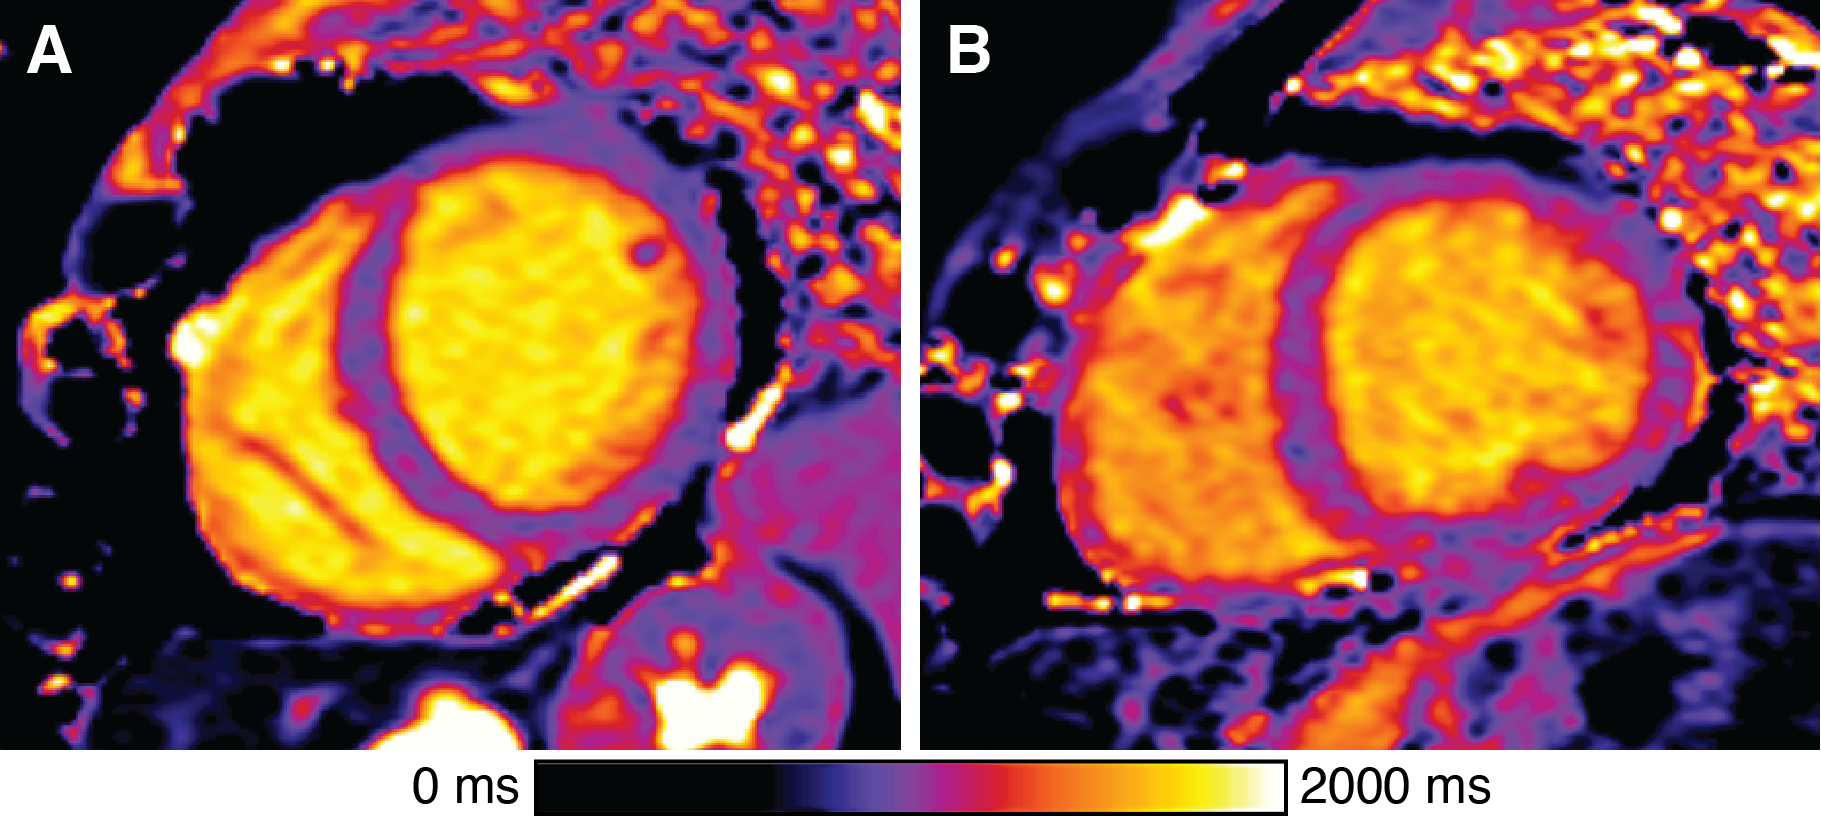
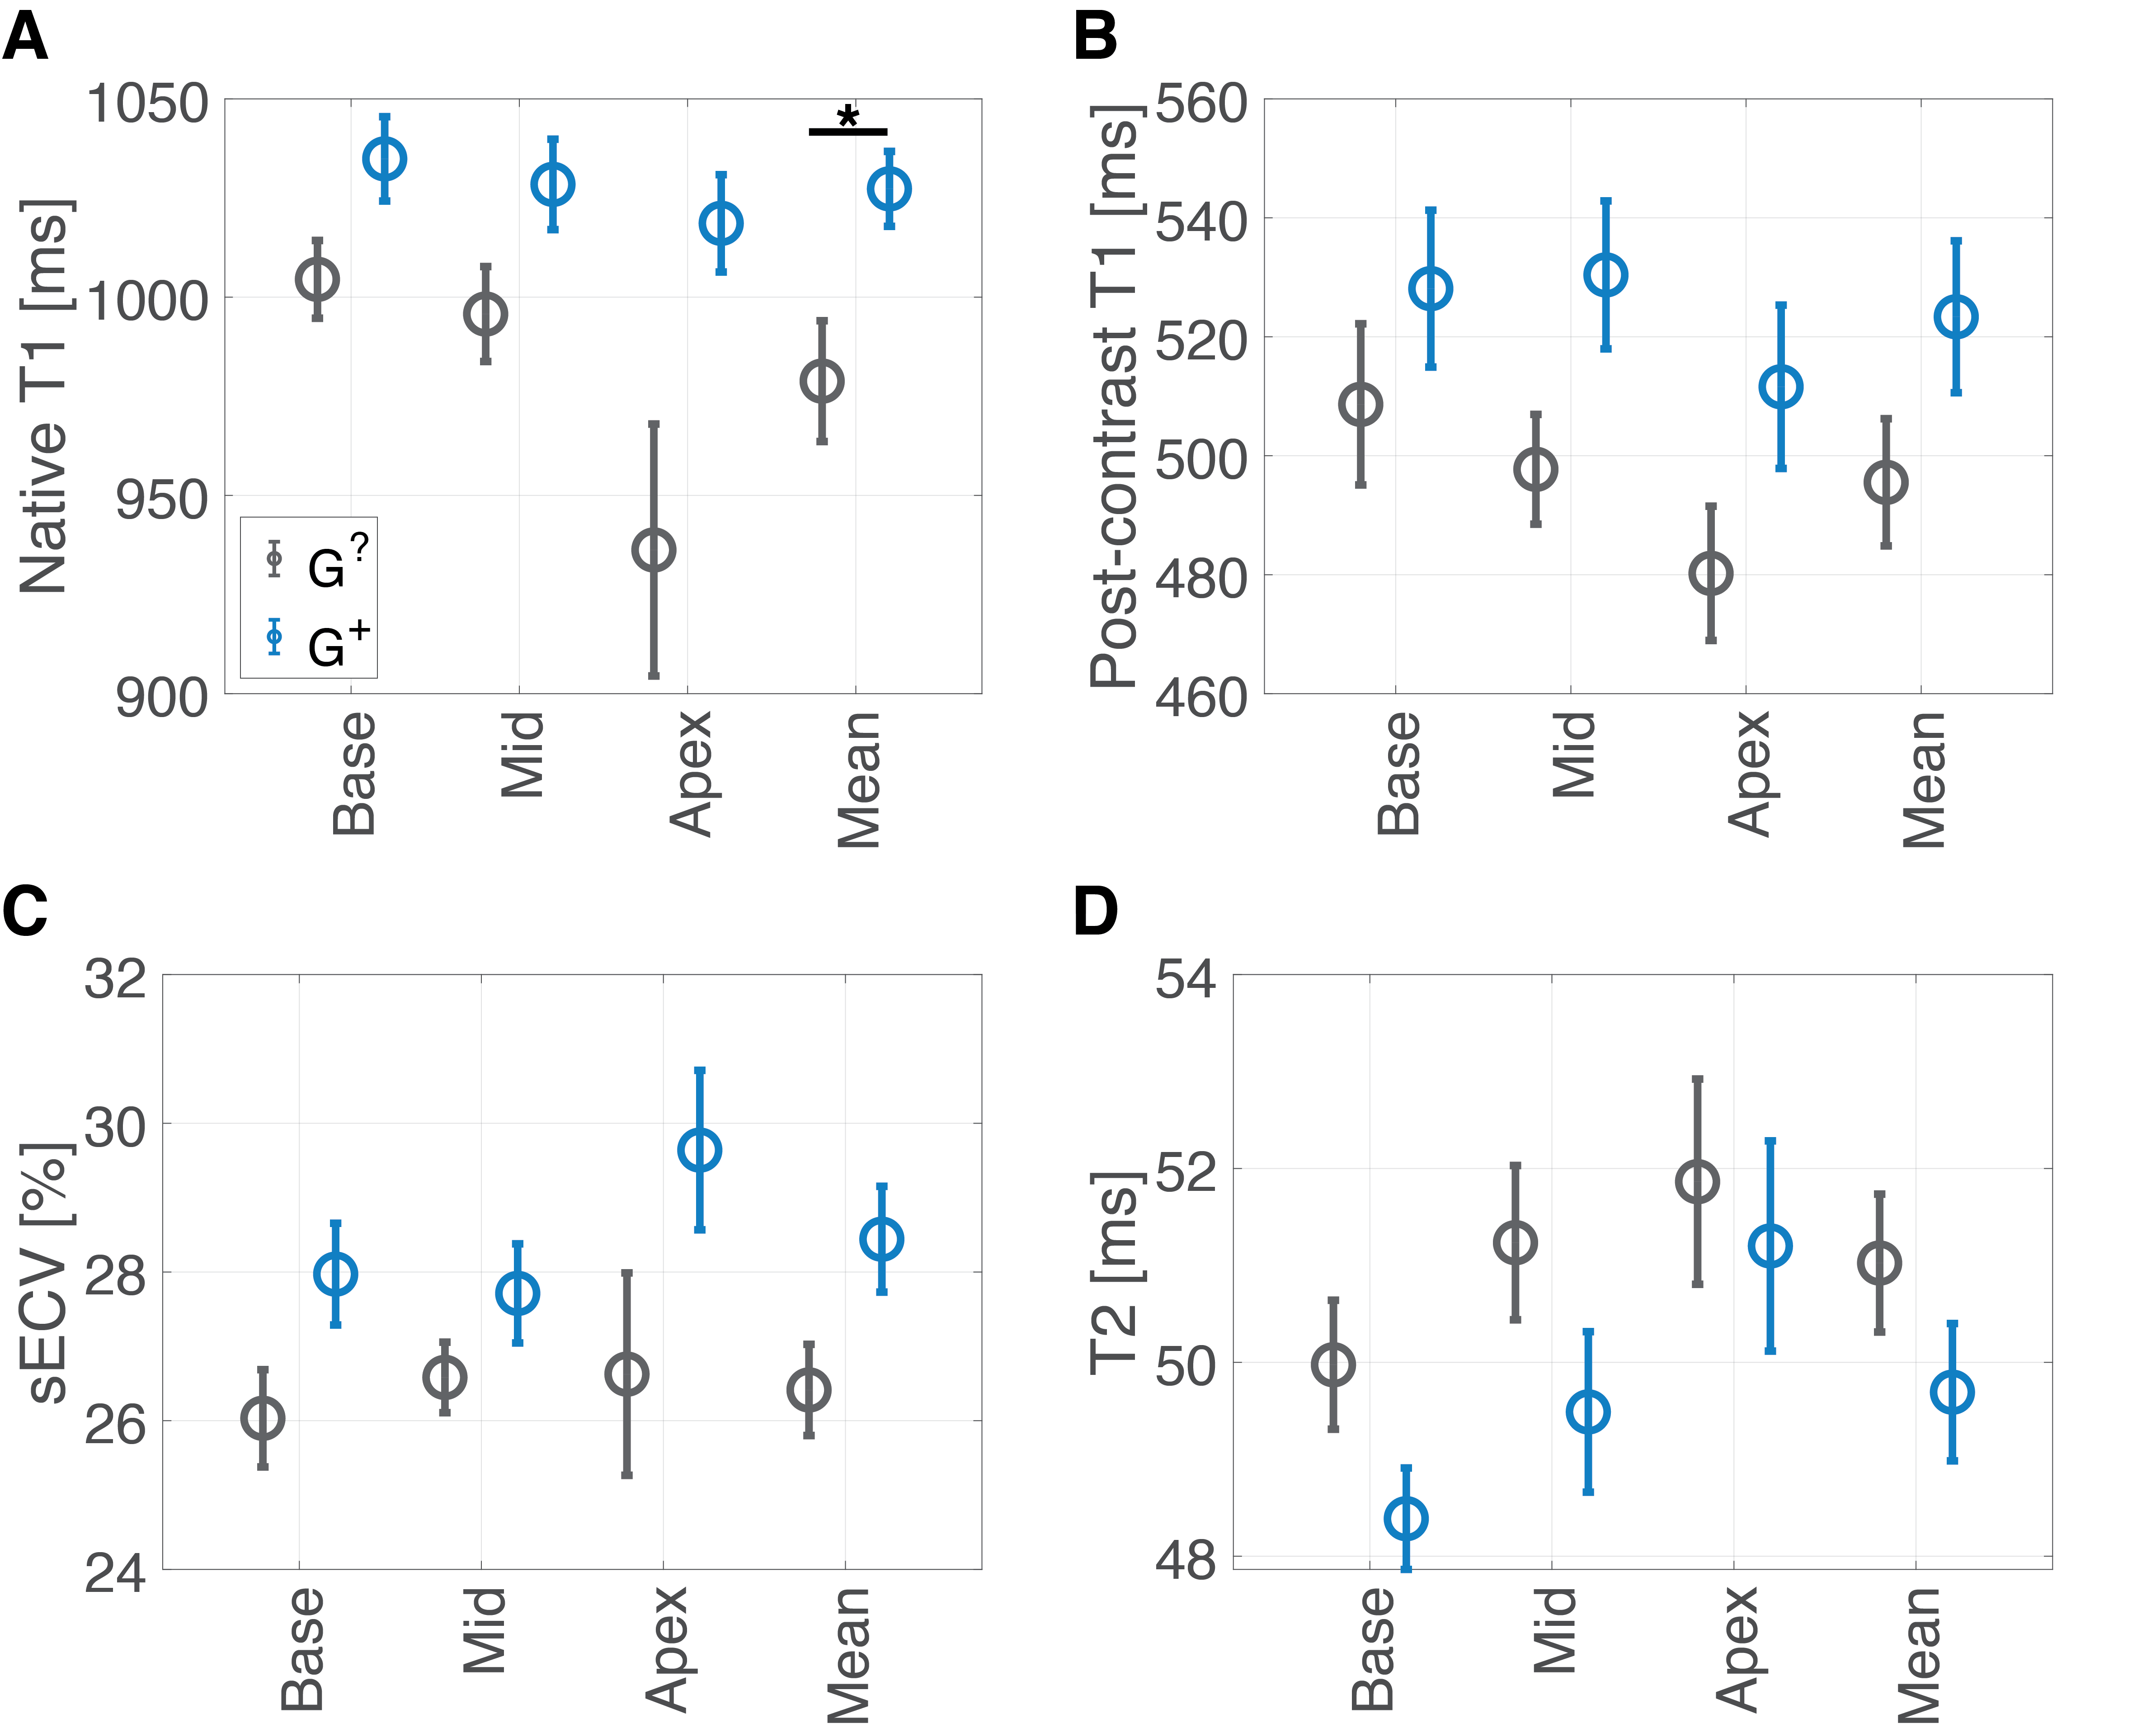
Of 92 individuals identified with an ACM variant, 18 had a qualifying cardiac MRI. We identified 19 individuals (genotype-unknown, G?, statistically likely genotype-negative) who satisfied control criteria. A summary of comparisons between groups is given in Figure 1. The groups were similar in age and sex. Global native T1 was elevated in G+ individuals vs. G? (mean±SEM G+ 1027±9 ms vs. G? 979±15 ms; p=0.04; Figures 1, 2, and 3A). A similar increase in sECV was present but not significant (mean±SEM G+ 28.4±0.7% vs. G? 26.4±0.6%; p=0.08). There was no significant difference in post-contrast T1 or myocardial T2 between groups (Figure 3). Finally, the rate of atypical LGE was higher in the G+ group (G+ 5/18 vs. 0/19; p=0.02).Discussion
In this small pilot study of patients with ACM-associated variants, we found increased native T1 and atypical LGE in the LV, likely representing diffuse myocardial fibrosis, compared to clinical controls. These results indicate that despite the lack of overt clinical cardiomyopathy, these individuals with desmosome variants may have subtle myocardial tissue remodeling. Similar prolongation of native T1 has been observed in patients with arrhythmogenic right ventricular cardiomyopathy (a sub-type of ACM) and non-ischemic dilated cardiomyopathy.9–11 Of note, the majority of G+ patients harbored variants in DSP or DSG2 variants. Variants in both of these genes have been associated with diffuse LV fibrosis, often preceding systolic dysfunction.12,13 While no statistical differences were observed in native T2 or sECV in these patients, it is possible that we were under-powered to detect a difference in these values due to the small sample size. Ultimately, replication in a larger cohort and longitudinal follow-up will be needed to determine the discriminative and prognostic potential of this approach.A major limitation of this study was that all control MRI studies had some clinical indication. Prospective studies involving healthy control subjects (and ACM-positive controls, where available) are required to confirm these results. Also, analysis of the right ventricle was precluded by the resolution limitation of current myocardial mapping techniques.
Conclusion
In this pilot study, deep phenotyping individuals with genetic risk for ACM with myocardial T1/T2 mapping of the LV identified a significant elevation of native T1 values and atypical LGE compared to controls, despite not meeting diagnostic criteria for ACM. Longitudinal follow-up with larger cohorts is needed to confirm these results.Acknowledgements
We acknowledge the data brokerage assistance of Nathan Stoudt and the contributions of MyCode participants.References
1. Haggerty CM, James CA, Calkins H, et al. Electronic health record phenotype in subjects with genetic variants associated with arrhythmogenic right ventricular cardiomyopathy: a study of 30,716 subjects with exome sequencing. Genet. Med. 2017;19:1245–1252.
2. Carruth ED, Young W, Beer D, et al. Prevalence and Electronic Health Record-Based Phenotype of Loss-of-Function Genetic Variants in Arrhythmogenic Right Ventricular Cardiomyopathy-Associated Genes. Circ. Genomic Precis. Med. 2019;12:487–494.
3. Kalia SS, Adelman K, Bale SJ, et al. Recommendations for reporting of secondary findings in clinical exome and genome sequencing, 2016 update (ACMG SF v2.0): a policy statement of the American College of Medical Genetics and Genomics. Genet. Med. 2016;19:249–255.
4. Puntmann VO, Carr-White G, Jabbour A, et al. T1-Mapping and Outcome in Nonischemic Cardiomyopathy. JACC Cardiovasc. Imaging 2016;9:40–50.
5. Swoboda PP, McDiarmid AK, Page SP, Greenwood JP, Plein S. Role of T1 mapping in inherited cardiomyopathies. Eur. Cardiol. Rev. 2016;11:96–101.
6. Ho CY, Abbasi SA, Neilan TG, et al. T1 measurements identify extracellular volume expansion in hypertrophic cardiomyopathy sarcomere mutation carriers with and without left ventricular hypertrophy. Circ. Cardiovasc. Imaging 2013;6:415–422.
7. Treibel TA, Fontana M, Maestrini V, et al. Automatic Measurement of the Myocardial Interstitium Synthetic Extracellular Volume Quantification Without Hematocrit Sampling. JACC Cardiovasc. Imaging 2016;9:54–63.
8. Benjamini Y, Hochberg Y. Controlling the false discovery rate: a practical and powerful approach to multiple testing. J. R. Stat. Soc. Ser. B 1995;57:289–300.
9. Bourfiss M, Prakken NHJ, van der Heijden JF, et al. Diagnostic Value of Native T1 Mapping in Arrhythmogenic Right Ventricular Cardiomyopathy. JACC Cardiovasc. Imaging 2019:2019–2021.
10. Puntmann VO, Voigt T, Chen Z, et al. Native T1 mapping in differentiation of normal myocardium from diffuse disease in hypertrophic and dilated cardiomyopathy. JACC Cardiovasc. Imaging 2013;6:475–484.
11. Towbin JA, McKenna WJ, Abrams DJ, et al. 2019 HRS expert consensus statement on evaluation, risk stratification, and management of arrhythmogenic cardiomyopathy. Hear. Rhythm 2019;16:e301–e372.
12. Smith ED, Lakdawala NK, Papoutsidakis N, et al. Desmoplakin Cardiomyopathy, a Fibrotic and Inflammatory Form of Cardiomyopathy Distinct From Typical Dilated or Arrhythmogenic Right Ventricular Cardiomyopathy. Circulation 2020;141:1872–1884.
13. Pilichou K, Nava A, Basso C, et al. Mutations in desmoglein-2 gene are associated with arrhythmogenic right ventricular cardiomyopathy. Circulation 2006;113:1171–1179.
Figures