2637
Isovolumic Relaxation Time and e' Metrics Evaluated by Deep-learning Analysis of Long-axis Cine: Correlations to Atrial Pressure and Fibrosis1Yale Unversity, New Haven, CT, United States, 2National Institutes of Health, Bethesda, MD, United States, 3Lund University, Lund, Sweden
Synopsis
Using a deep-learning tool for tracking the left ventricular valve plane on long-axis cine, markers of diastolic dysfunction could be easily evaluated, including e-prime, a-prime (atrial kick valve velocity), s-prime, and isovolumic relaxation time (IVRT). This analysis, performed in 23 patients with atrial fibrillation, revealed a dependence of both a-prime and IVRT on atrial fibrosis.
Introduction
Diastolic dysfunction is associated with many cardiovascular diseases, including heart-failure and atrial fibrillation (AF) (1). Recently, a feature-tracking (FT) method was introduced, to determine the left ventricular (LV) valvular motion (2) from long-axis cine images. This FT method allows evaluation of e-prime (e’), an essential marker of diastolic dysfunction (peak early diastolic valve-plane velocity). Peak systolic velocity of the valve, s-prime (s’), and peak velocity during the atrial kick (a-prime, a’) are also sometimes evaluated by echo and can be measured by MRI (3). Isovolumic relaxation time (IVRT) is another parameter which has been used to assess diastolic dysfunction and estimate pressure (4). IVRT is the time at the end of systole, between the aortic valve closure and mitral valve opening, during which flow is minimal. Typically, IVRT is about 80ms in healthy subjects by echo, but is prolonged in patients with impaired LV relaxation, and exhibits pseudonormalization at very high filling pressures (5). The measurement of IVRT is also possible using valve-plane tracking, although the limited temporal resolution of MRI might hinder accurate evaluation. Both analyses (e’ and IVRT) are simple in concept, yet highly detailed, requiring skill and time, even with the aid of feature-tracking. Recently, an automated deep-learning method (MVnet) for mitral valve insertion point tracking has been introduced (6). In this work, we investigated the use of this deep-learning algorithm to aid in measuring e’ and IVRT in a cohort of patients with AF and invasive atrial pressure measurements. We hypothesized that prolonged IVRT and reduced e’, indicating diastolic dysfunction, would be associated with higher pressure or greater atrial fibrosis.Methods
Subjects This retrospective chart-review was approved by our institution’s IRB. The cohort consisted of 36 AF patients who received a cardiac MR within the years of 2016-2018, and who had invasive left atrial (LA) pressure measurement prior to an ablation (20 ± 19 days between MRI and procedure); exclusion criteria included LVEF < 50% or an arrhythmia during their MRI. After exclusion, 23 subjects were studied.Imaging Parameters The cardiac MR cine images were acquired with 2x2x8mm3 spatial resolution, 30ms temporal resolution, using balanced SSFP cine acquisition (TR/TE/θ=3ms/1.5ms/50°) in the 2- and 4-chamber orientations. A short-axis cine stack was also acquired, with the same parameters. Fat-suppressed, ecg-gated and navigator-gated 3D atrial late gadolinium enhancement (LA LGE) was obtained in all subjects, using conventional methods (7).
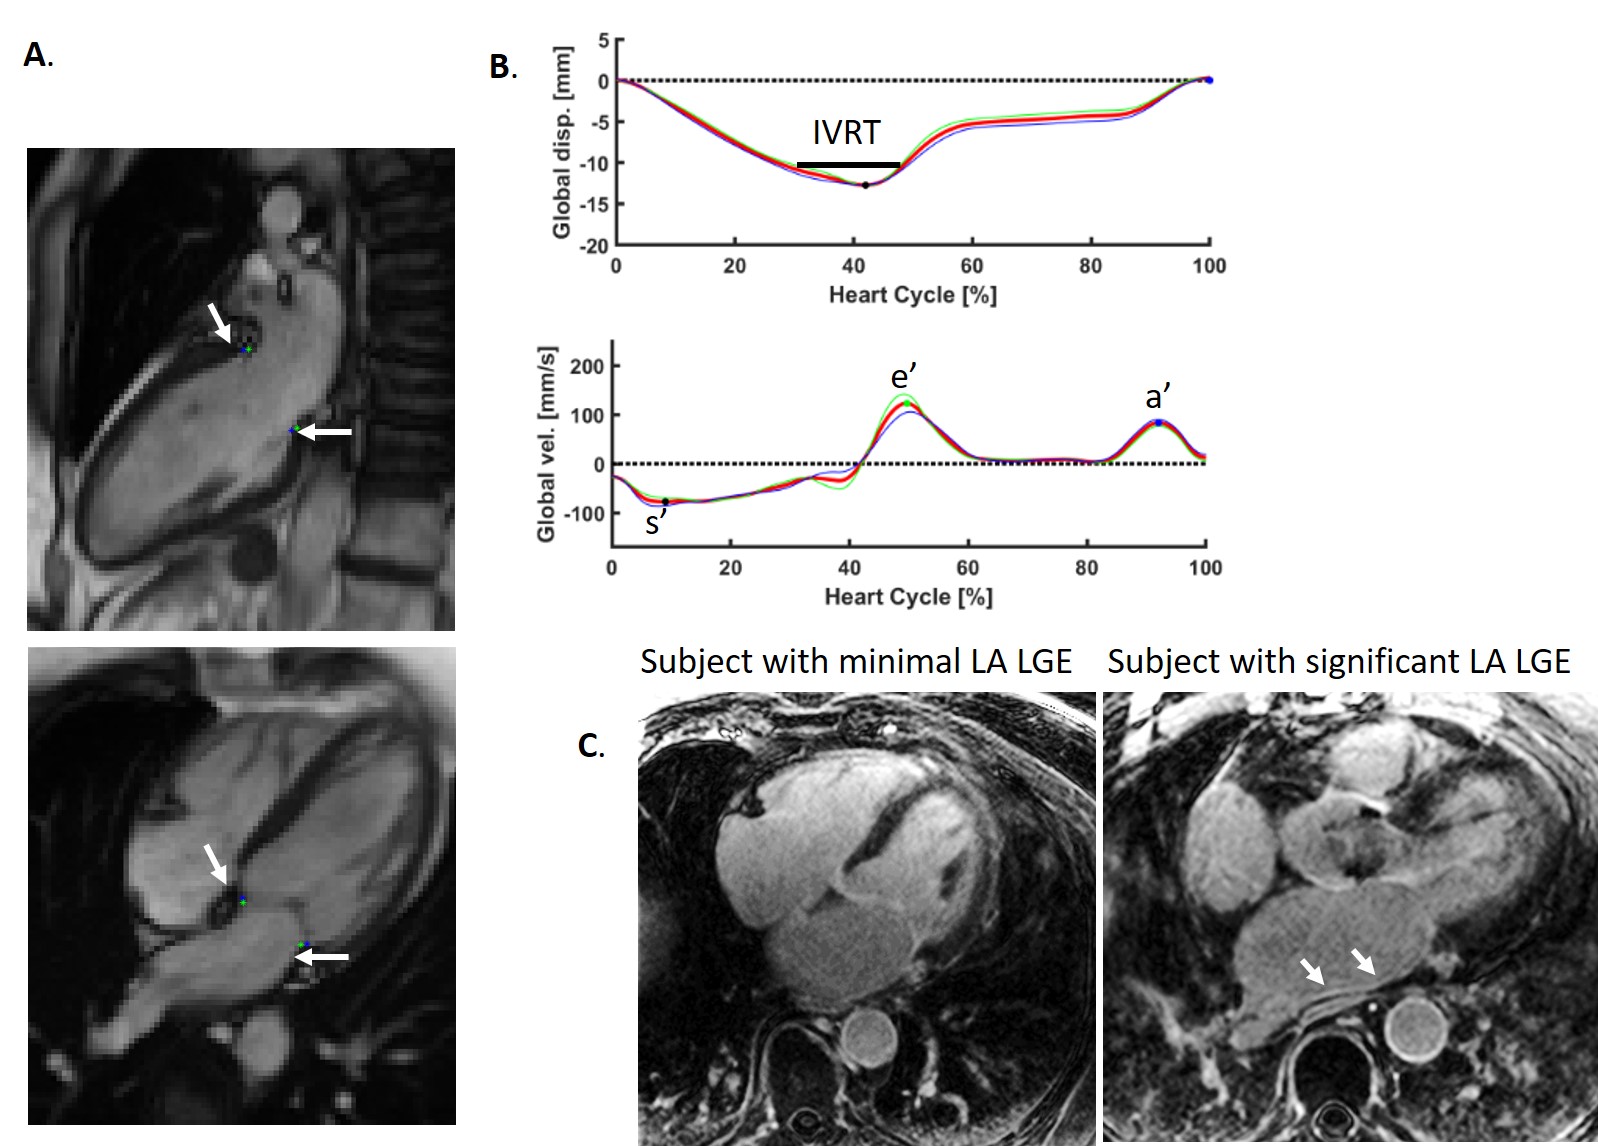
IVRT and e’ Measurement MVnet (6), a deep-learning algorithm for valve tracking, was used to track the valvular insertion points on 2- and 4-chamber views (Figure 1A). With these point coordinates,which were averaged and smoothed to eliminate discontinuities, the global mitral valve plane displacement was measured as the average perpendicular distance of the valvular insertion points to the initial plane set in end-diastole, whereas the global velocity was calculated as the derivative, as shown in Figure 1B. s’, e’ and a’ were measured by the valvular velocity, as the peak valve speed in systole (s’), early diastole (e’) and during the atrial kick (a’). IVRT was measured as the time during end-systole, in which the valve displacement values were within 5% of the peak valve displacement (Figure 1B). 5% was chosen empirically; the IVRT can be normalized by the RR interval. Image analysis was performed in Segment (8).
LA LGE evaluation: A qualitative evaluation of LA LGE as a marker of atrial fibrosis, itself also linked to diastolic dysfunction (7), was performed for each study, blinded to other data, graded as either mild or moderate (low LA LGE) or extensive atrial LGE (high LA LGE) (Figure 1C). In nine patients, LA LGE was not available.
Results
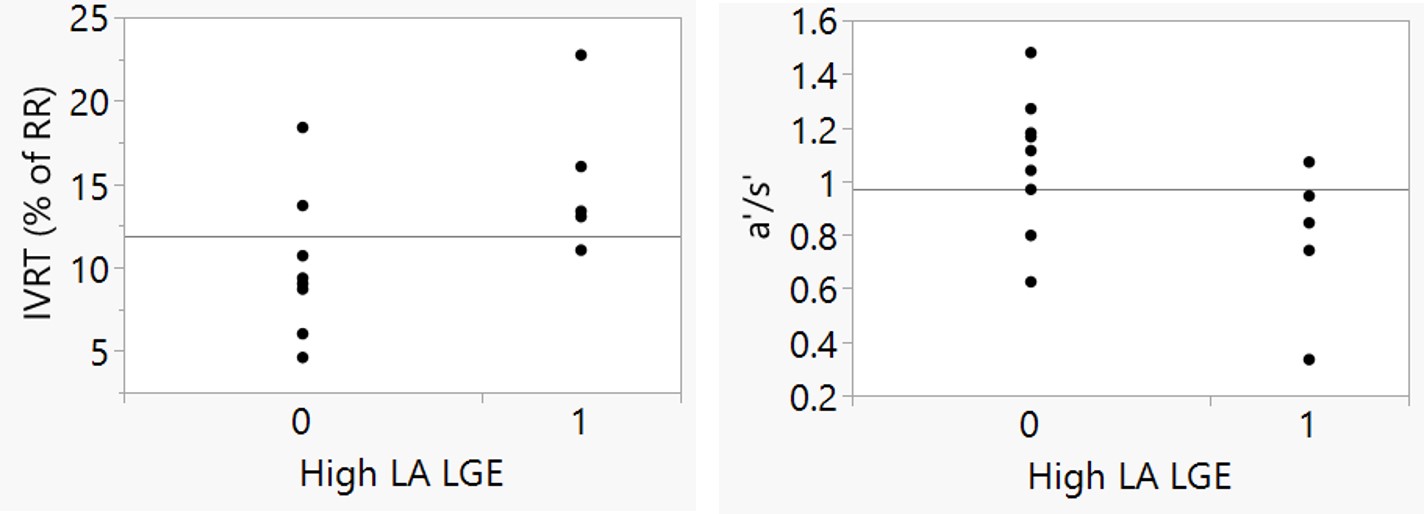
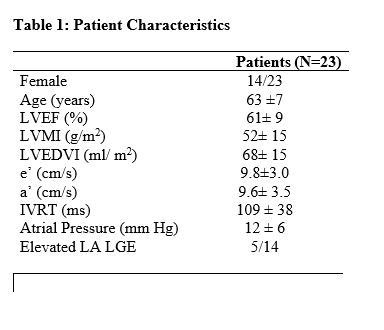
Measurement of e’ and IVRT required about 2 minutes of time per study. Table 1 presents the subjects included in this AF study. IVRT, as a percent of the RR interval, showed a trend towards increasing with age (R2=0.23, p=0.07), as expected. IVRT decreased with increasing BMI (R2=0.47, p=0.006), which is not expected. It showed no correlation with LA pressure or LV mass index, or LV EDVI, which are important indicators of diastolic function. Importantly, IVRT was higher in subjects with significant atrial fibrosis (15 ±4.5% with vs. 9.9± 4% without high LA LGE, p=0.032, Figure 2). Global e’ showed a decreasing trend with increasing LVMI (R2=0.23, p=0.08), which might be expected. No trend or relationship was found with age, LVEDVI, BMI, or pressure, or atrial fibrosis. Global a’ trended lower in subjects with significant LA LGE (10.4 ± 3.4 with lower LA LGE vs. 8.0 ± 3.8, with high LA LGE). The a’/s’ ratio was significantly lower in patients with higher LA LGE (0.78 ± 0.25 vs. 1.0 ± 0.28, p<0.05), indicating loss of atrial function with increased atrial fibrosis. Figure 2 shows the associations of LA LGE to IVRT and a’.Discussion
IVRT, e’ and a’ are rarely or never quantified using MRI. The relationship between these markers of diastolic dysfunction, and other biomarkers—e.g. atrial fibrosis—associated with high filling pressures and atrial remodeling, are therefore unknown. We have demonstrated that with deep-learning analysis methods, these metrics can now be easily evaluated, potentially revealing new understanding of physiology.Acknowledgements
This work was supported by the NIH (NHLBI R01HL144706). DCP acknowledges the great ideas of James W. Goldfarb, who described the possibility of machine learning enabled valve-tracking many years ago.References
1) Rosenberg MA, Manning WJ. Diastolic dysfunction and risk of atrial fibrillation: a mechanistic appraisal. Circulation. 2012 Nov 6;126(19):2353-62. doi: 10.1161/CIRCULATIONAHA.112.113233. PMID: 23129702.
2) Seemann F, Pahlm U, Steding-Ehrenborg K, Ostenfeld E, Erlinge D, Dubois-Rande JL, Jensen SE, Atar D, Arheden H, Carlsson M, Heiberg E. Time-resolved tracking of the atrioventricular plane displacement in Cardiovascular Magnetic Resonance (CMR) images. BMC Med Imaging. 2017 Feb 28;17(1):19. doi: 10.1186/s12880-017-0189-5. PMID: 28241751; PMCID: PMC5330030.
3) Seemann F, Baldassarre LA, Llanos-Chea F, Gonzales RA, Grunseich K, Hu C, Sugeng L, Meadows J, Heiberg E, Peters DC. Assessment of diastolic function and atrial remodeling by MRI - validation and correlation with echocardiography and filling pressure. Physiol Rep. 2018 Sep;6(17):e13828. doi: 10.14814/phy2.13828. PMID: 30187654; PMCID: PMC6125607.
4) Yoshizane T, Kawamura I, Kawasaki M, Tanaka R, Minatoguchi S, Nagaya M, Sato H, Ono K, Tomita S, Matsuo H, Noda T, Suzuki T, Minatoguchi S. Validation by Cardiac Catheterization of Noninvasive Estimation of Time Constant of Left Ventricular Pressure Decline as an Index of Relaxation by Speckle Tracking Echocardiography. Am J Cardiol. 2018 Jun 15;121(12):1645-1651. doi: 10.1016/j.amjcard.2018.02.061. Epub 2018 Mar 14. PMID: 29653833.
5 ) Dong, Am J Physiol Heart Circ Physiol. 2001.
6) Gonzales RA, Onofrey J, Lamy J, Seemann F, Heiberg E, and Peters DC. Time-resolved tracking of the atrioventricular plane displacement in long-axis cine images with residual neural networks, ISMRM, 2020.
7) Quail M, Grunseich K, Baldassarre LA, Mojibian H, Marieb MA, Cornfeld D, Soufer A, Sinusas AJ, Peters DC. Prognostic and functional implications of left atrial late gadolinium enhancement cardiovascular magnetic resonance. J Cardiovasc Magn Reson. 2019 Jan 3;21(1):2. doi: 10.1186/s12968-018-0514-3. PMID: 30602395; PMCID: PMC6317232.
8) Heiberg, E., Sjögren, J., Ugander, M., Carlsson, M., Engblom, H., & Arheden, H. (2010). Design and validation of Segment-freely available software for cardiovascular image analysis. BMC medical imaging, 10(1), 1.
Figures