2633
Linked Independent Component Analysis for Denoising multi-centre 7T MRI data1Department of Clinical Neurosciences and University of Cambridge Centre for Parkinson-plus, University of Cambridge, Cambridge, United Kingdom, 2Wolfson Brain Imaging Centre, University of Cambridge, cambridge, United Kingdom, 3Cognitive Neuroscience, Radboud University Medical Centre, Nijemen, Netherlands, 4Donders Institute, Centre for Cognitive Neuroimaging, Radboud University, Nijmegen, Netherlands, 5Sir Peter Mansfield Imaging Centre, School of Physics and Astronomy, University of Nottingham, Nottingham, United Kingdom, 6IMAGO7 Foundation, Pisa, Italy, 7German Centre for Neurodegenerative Diseases (DZNE), Magdeburg, Germany, 8Medical Research Council Cognition and Brain Sciences Unit, University of Cambridge, Cambridge, United Kingdom, 9Wolfson Brain Imaging Centre, University of Cambridge, Cambridge, United Kingdom, 10Department of Clinical Neurosciences, University of Cambridge, Cambridge, United Kingdom
Synopsis
Multi-site studies are an attractive option at ultra-high field (7T) as it is possible to pool larger number of datasets of healthy and patients increasing the statistical power of neuroimaging studies. However, differences on scanner hardware and software increase variability in the measurements obtained on across imaging sites.In this study we have piloted the application of a multimodal ICA approach for denoising scanner effects across two different 7T MRI scanner platforms.
Purpose
Magnetic resonance imaging (MRI) studies are commonly confronted with the problem of poor reliability of research findings, mostly because of lack of statistical power as the sample sizes are often too small.1 It is well accepted that pooling multi-study data has the potential to increase the statistical power to detect small effect sizes, or to investigate rare diseases.2However, a major hurdle to pooling such data is variability between MRI scanners (hardware and software), which translates into different scanning parameters and performance and, consequently, lack of consistency in MRI measurements. Linked-ICA (LICA) is a novel data-driven strategy that has recently been used to successfully denoise multimodal pooled MRI data from different studies.3 LICA uses a modular Bayesian framework to find common features across multiple modalities, detecting structured components, such as scanner or subject-wise effects, which can then be regressed out from the original data.4 In this study we have piloted the application of the LICA approach using both scanner field-maps, and T1w and T2*w MRI data from a 7T travelling-heads study5-7 in order to denoise scanner effects across two different 7T MRI scanner platforms.
Methods
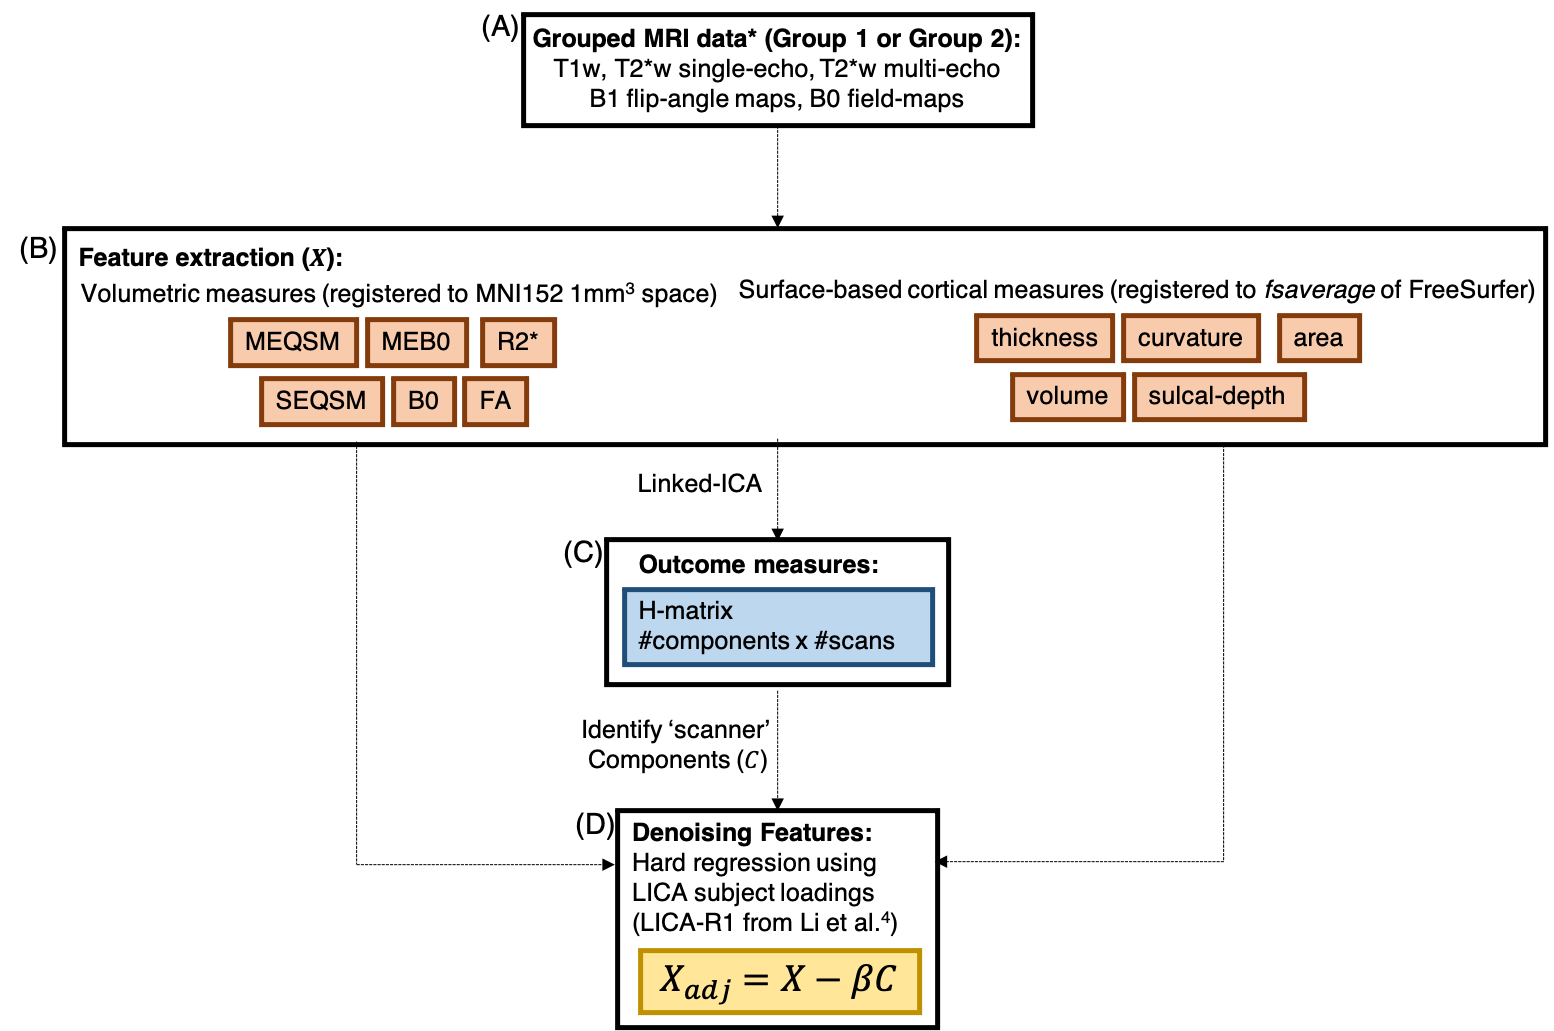
A subset of the multi-modal data from 10 participants collected from the UK7T travelling-heads study was used5, grouped according to the scanner type (Table 1). Imaging modalities included high-resolution structural T1w MP2RAGE, T2*w (QSM and R2*) and flip-angle and B0 field maps5. Structural MRI: T1w data was reconstructed offline and then processed in FreeSurfer8 as described by Mougin et al6. Surface files from each scan (volume, thickness, sulcal depth, curvature and surface area) were registered to a common space (using ‘fsaverage’), and smoothed.T2*w MRI: For each scan, QSM maps were reconstructed from the single-echo and multi-echo T2*w data as in7 (denoted SEQSM & MEQSM, respectively). From the multi-echo data, B0-maps were estimated from the background field removal step (ME-B0). R2* maps were estimated from the multi-echo data as in7. All data was then mapped to 1mm-isotropic MNI space via the MP2RAGE scan using ANTs9.Flip-angle and B0 field maps: Flip-angle maps (FA) acquired using the DREAM sequence10 and the vendors B0 field-maps (B0) were first registered to the native MP2RAGE image for each scan and then to MNI space, as previously described for the T2* data. Linked ICA: A python implementation of linked-ICA was used11-13 and was run independently for the two groups (Table 1). Because of the multi-modal multi-site nature of the dataset, this extended ICA algorithm allows all individual ICA factorizations to be linked through a shared common mixing matrix, that reflects ‘subject-wise’ contributions to each component. This allows extraction of common features linked to different scanners. For each group, a 4D file was constructed for each imaging outcome, by concatenating images for each modality across scans, using the same scan order for each modality (Figure 1(B)).9 independent components were extracted11, and scanner effects were identified from the output of the LICA subject loadings with Pearson-correlation. Denoised data was obtained by performing a single multivariate regression between the original data and the identified components (method R1 from 4). Average 𝛘 and standard-deviation (ROI-SD) values in selected ROIs from the Harvard-Oxford Atlas14 were extracted from the original and clean data in the two groups. Paired t-test was used to assess data before and after denoising and linear fitting was done to test site and group differences.Results
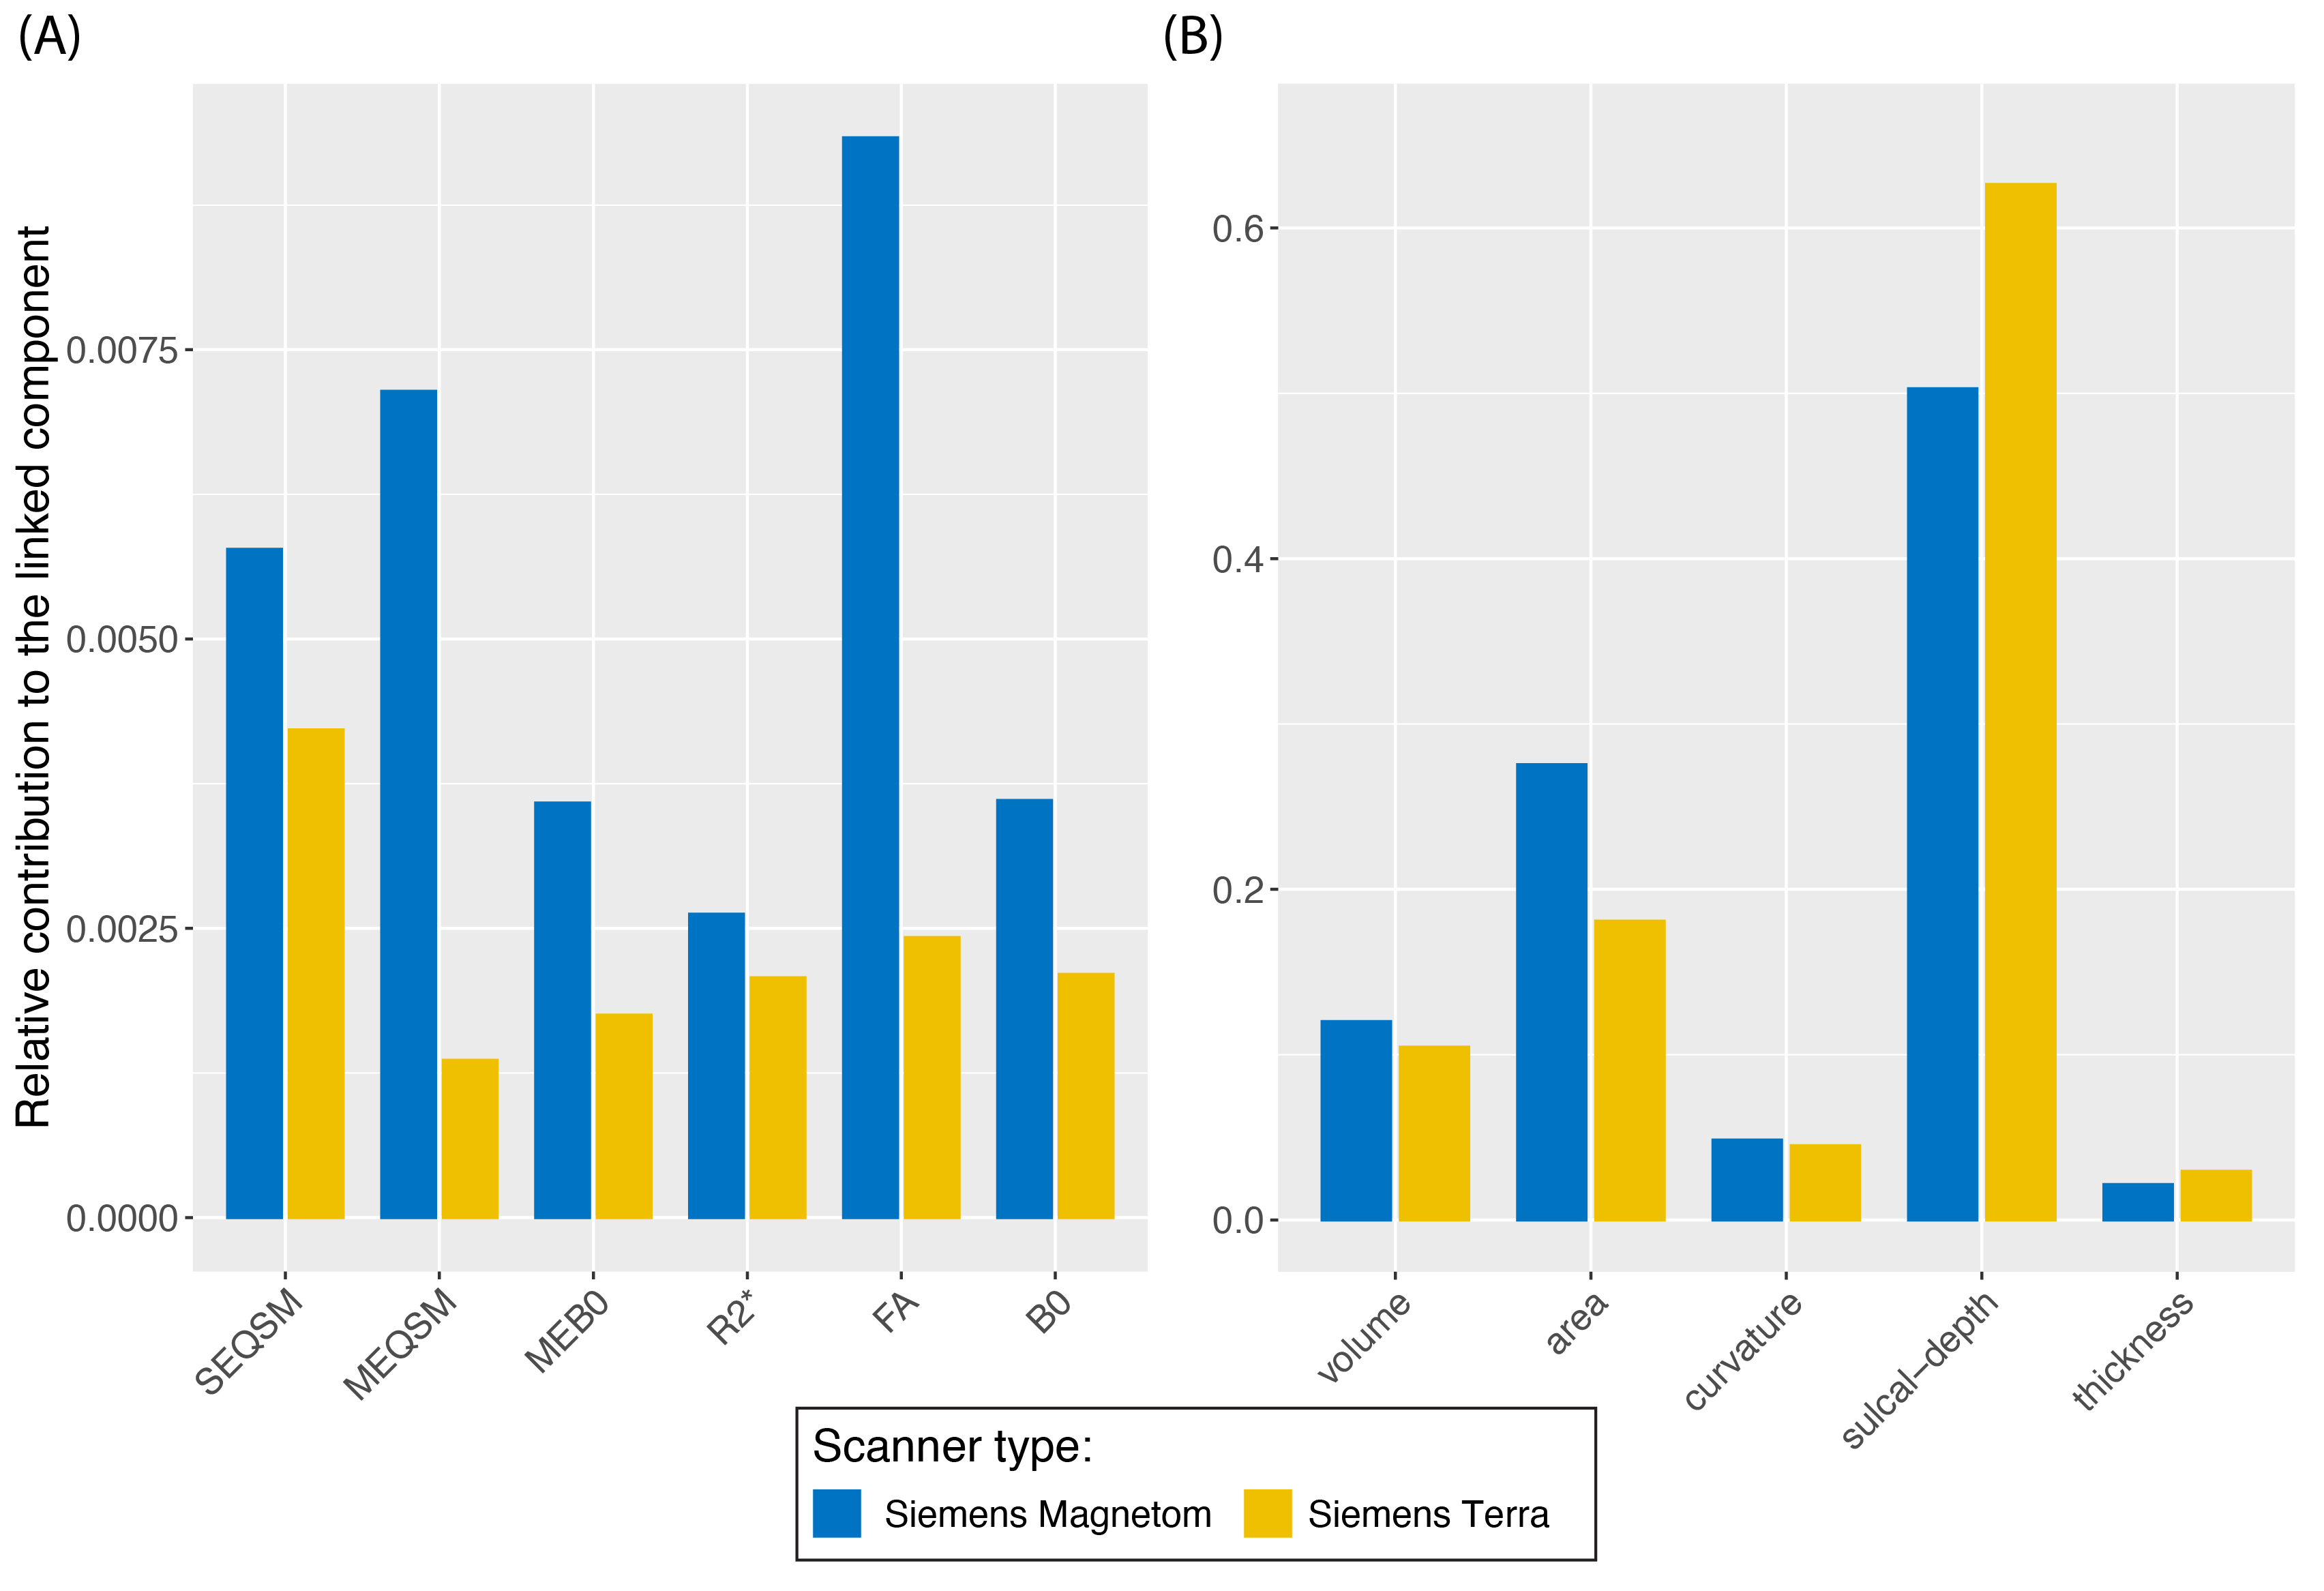
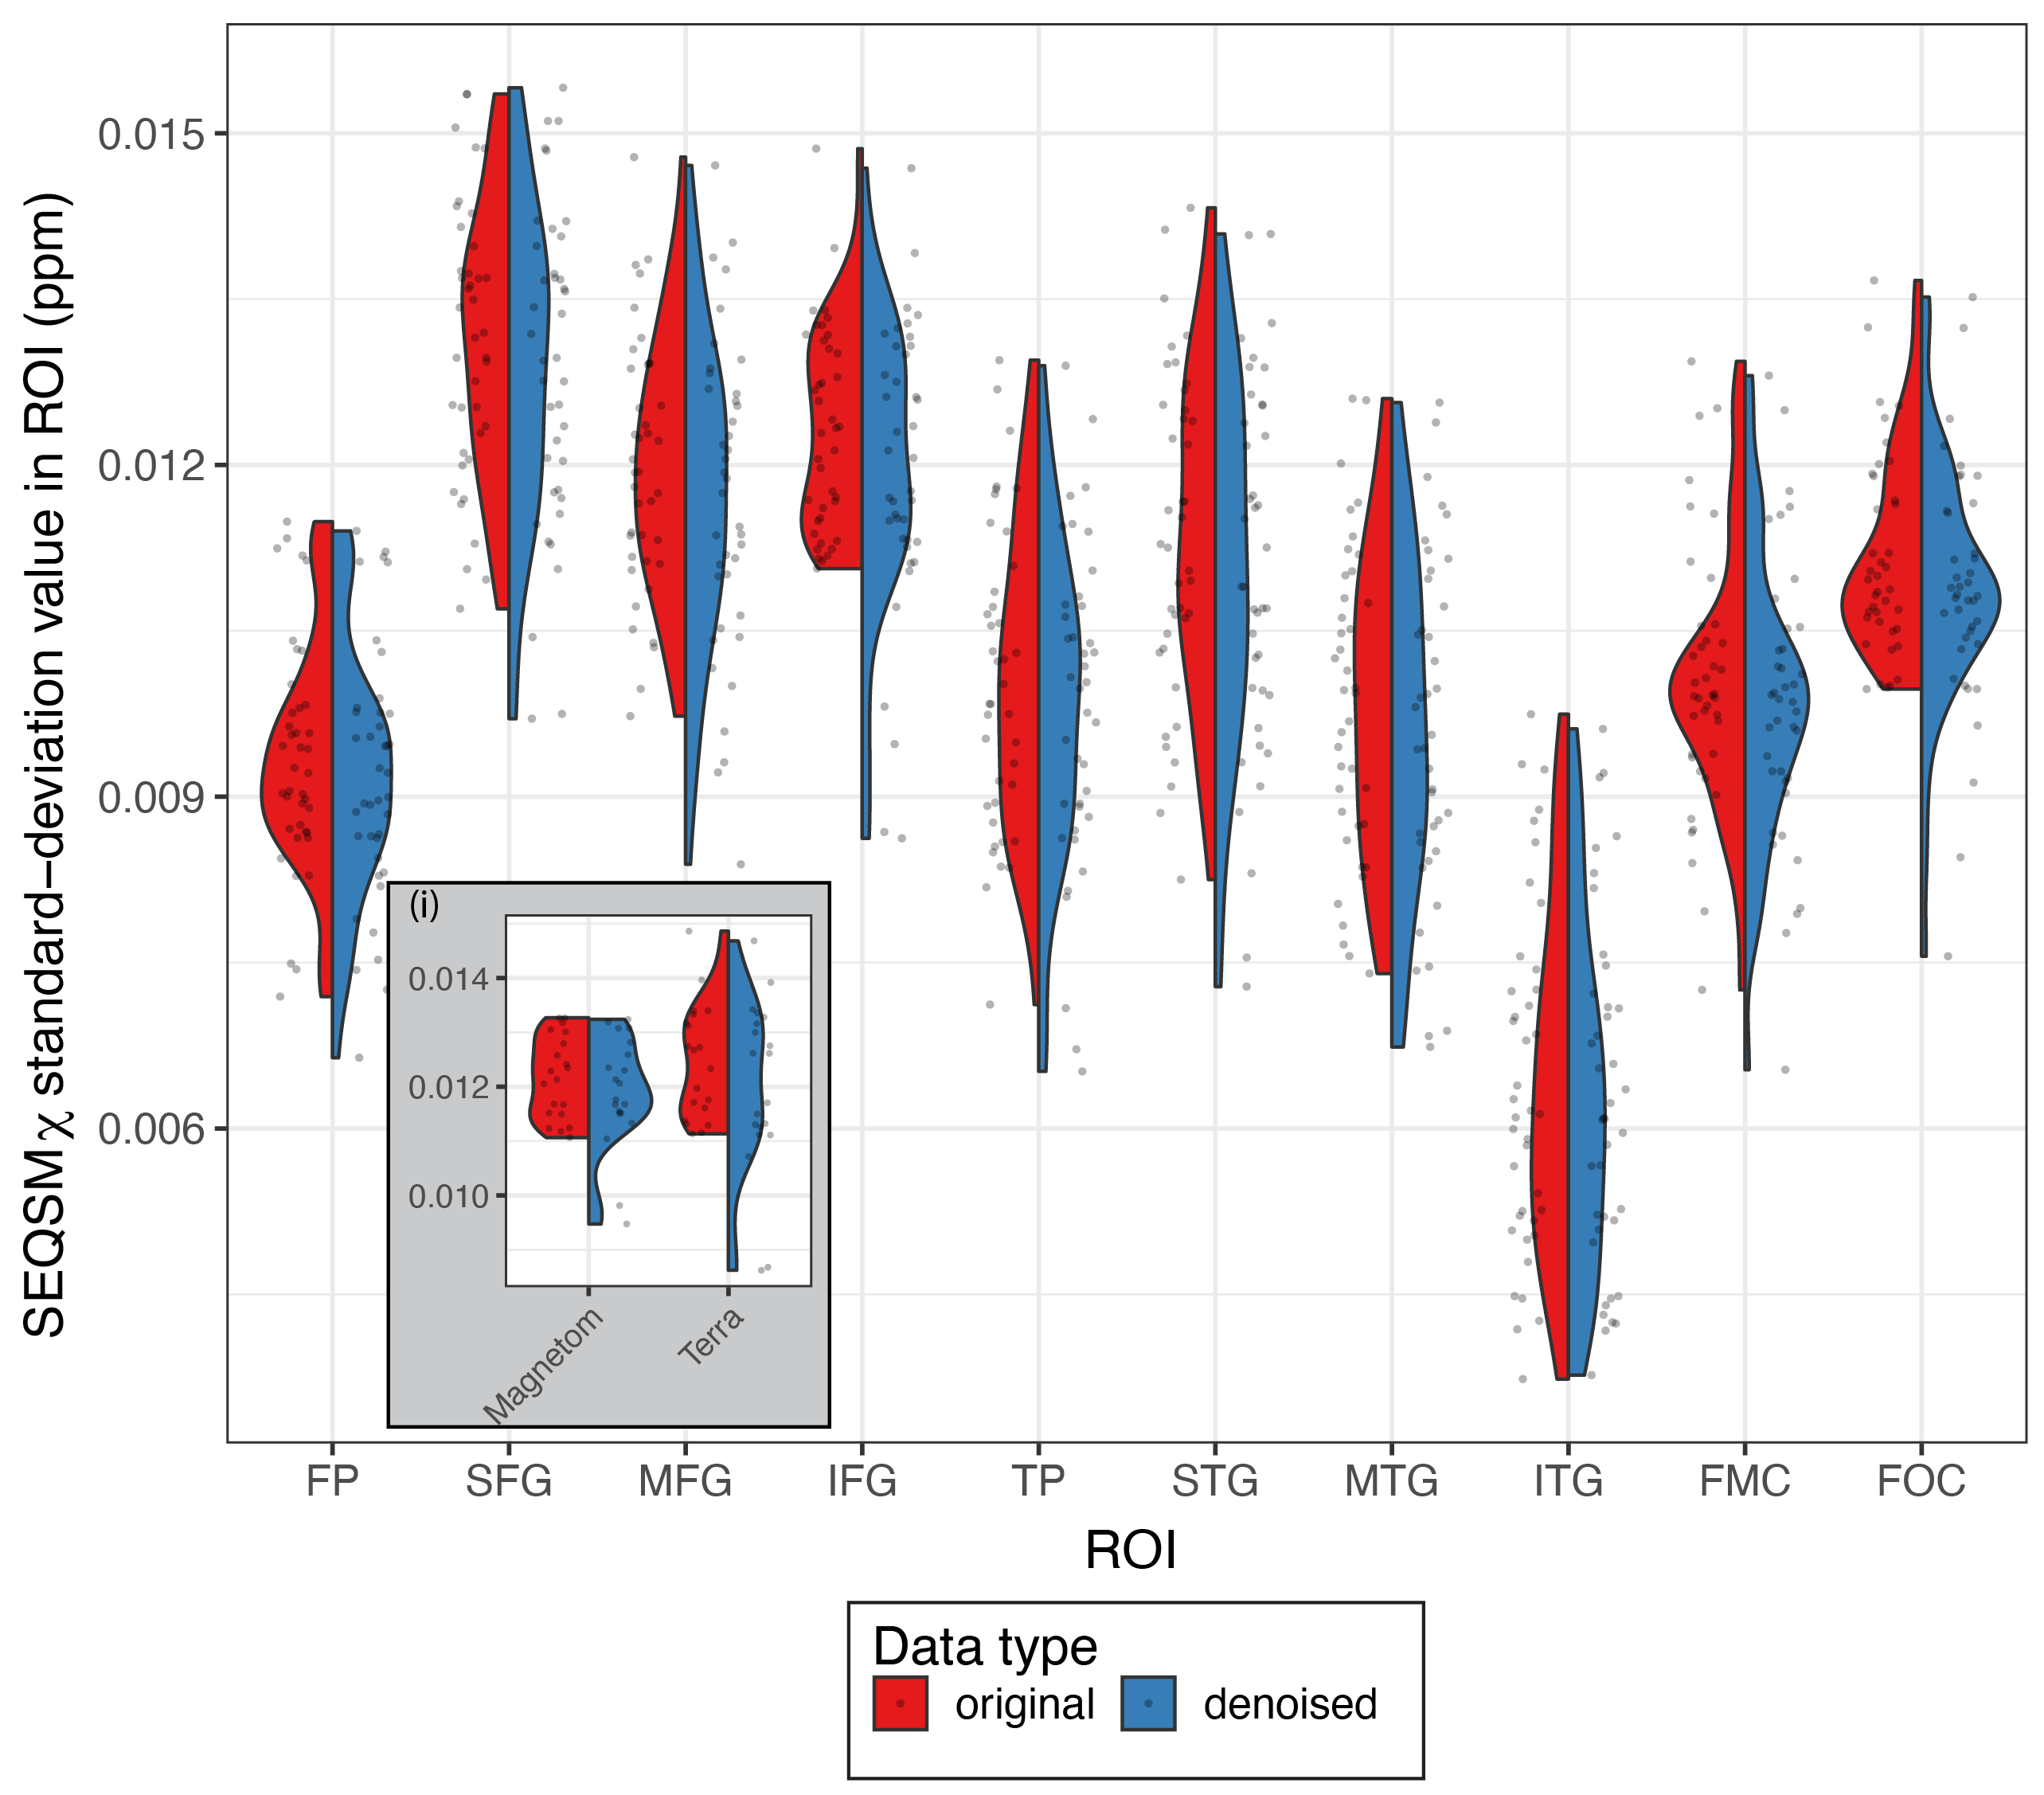
From the LICA models, one noise component from each group was correlated with scanner effects (group-1: r=0.41; p-value=0.012; group-2: r=0.36; p-value=0.031) (Figure 2). Both groups showed similar relative contributions from the different modalities to the linked-noise component identified with the scanner effects. Compared to the volumetric features, surface features identified primarily with scanner effects, with sulcal-depth being the highest and QSM measures the lowest (Figure 3).From all the SEQSM data, the average 𝛘 did not vary significantly (p=0.55) nor changed when using denoised data compared to the original data (paired t-test, p=0.28). As expected, ROI-SD values obtained from the original data were different across sites (p=0.01), and significantly higher compared to in the denoised data (Figure 4; paired t-test, p<0.001). The denoised data reduced the ROI-SD variability across sites, but not completely (p=0.04).Discussion
Linked independent component analysis was used to denoise ultra-high field multi-site multi-modal data. On two groups formed of data from the same scanner vendor, but different scanner platforms, LICA performed identically identifying similar noise components with matching modality contributions. Denoised data showed reduced variability across scanners compared to non-denoised data.Future work will involve applying the LICA method to a more heterogenous ultra-high field dataset from the EUFIND network.15This includes data from more than 20 different 7T sites spanning a greater variety of scanner vendors and platforms, which was acquired from an elderly population using pulse sequences and reconstruction harmonised on a “best effort” basis, without sequence modifications.
Acknowledgements
We acknowledge the NIHR Cambridge Biomedical Research Centre and MRC Clinical Research Infrastructure Award for 7T research. Personnel funding includes the Wellcome Trust, the Royal Society [098436/Z/12/B] and Cambridge Centre for Parkinson-plus.References
1. Button, K.S., Ioannidis, J.P., Mokrysz, C., Nosek, B.A., Flint, J., Robinson, E.S. and Munafò, M.R., 2013. Power failure: why small sample size undermines the reliability of neuroscience. Nature reviews neuroscience, 14(5), pp.365-376.
2. Tofts, P.S. and Collins, D.J., 2011. Multicentre imaging measurements for oncology and in the brain. The British journal of radiology, 84(special_issue_2), pp.S213-S226
3. Groves, A.R., Beckmann, C.F., Smith, S.M. and Woolrich, M.W., 2011. Linked independent component analysis for multimodal data fusion. Neuroimage, 54(3), pp.2198-2217
4. Li, H., Smith, S.M., Gruber, S., Lukas, S.E., Silveri, M.M., Hill, K.P., Killgore, W.D. and Nickerson, L.D., 2020. Denoising scanner effects from multimodal MRI data using linked independent component analysis. NeuroImage, 208, p.116388
5. Clarke, W.T., Mougin, O., Driver, I.D., Rua, C., Morgan, A.T., Asghar, M., Clare, S., Francis, S., Wise, R.G., Rodgers, C.T. and Carpenter, A., 2020. Multi-site harmonization of 7 tesla MRI neuroimaging protocols. Neuroimage, 206, p.116335
6. Mougin, O.E., Clarke, W.T., Driver, I., Rua, C., Morgan, A.T., Francis, S., Muir, K., Carpenter, A., Rodgers, C., Wise, R., Porter, D., Clare, S. and Bowtell, R., 2019. Robustness of PSIR segmentation and R1 mapping at 7T: a travelling head study. ISMRM, 27, pp. 237.
7. Rua, C., Clarke, W.T., Driver, I.D., Mougin, O., Morgan, Clare, S., Francis, S., Muir, K.W., Wise, R.G., Carpenter, A., Williams, G.B., Rowe, J.B., Bowtell., R., and Rodgers, C.T., 2020. Multi-centre, multi-vendor reproducibility of 7T QSM and R2* in the human brain: Results from the UK7T study. Neuroimage, 223, pp. 117358
8. Dale, A.M., Fischl, B. and Sereno, M.I., 1999. Cortical surface-based analysis: I. Segmentation and surface reconstruction. Neuroimage, 9(2), pp.179-194.
9. Avants, B.B., Tustison, N.J., Song, G., Cook, P.A., Klein, A. and Gee, J.C., 2011. A reproducible evaluation of ANTs similarity metric performance in brain image registration. Neuroimage, 54(3), pp.2033-2044.
10. Ehses, P., Brenner, D., Stirnberg, R., Pracht, E.D. and Stöcker, T., 2019. Whole‐brain B1‐mapping using three‐dimensional DREAM. Magnetic resonance in medicine, 82(3), pp.924-934.
11. Groves, A.R., Beckmann, C.F., Smith, S.M. and Woolrich, M.W., 2011. Linked independent component analysis for multimodal data fusion. Neuroimage, 54(3), pp.2198-2217.
12. Llera, A., Wolfers, T., Mulders, P. and Beckmann, C.F., 2019. Inter-individual differences in human brain structure and morphology link to variation in demographics and behavior. Elife, 8, p.e44443.
13. Wu, Z.M., Llera, A., Hoogman, M., Cao, Q.J., Zwiers, M.P., Bralten, J., An, L., Sun, L., Yang, L., Yang, B.R. and Zang, Y.F., 2019. Linked anatomical and functional brain alterations in children with attention-deficit/hyperactivity disorder. NeuroImage: Clinical, 23, p.101851.
14. Makris, N., Goldstein, J.M., Kennedy, D., Hodge, S.M., Caviness, V.S., Faraone, S.V., Tsuang, M.T. and Seidman, L.J., 2006. Decreased volume of left and total anterior insular lobule in schizophrenia. Schizophrenia research, 83(2-3), pp.155-171.
15. Düzel, E., Acosta‐Cabronero, J., Berron, D., Biessels, G.J., Björkman‐Burtscher, I., Bottlaender, M., Bowtell, R., Buchem, M.V., Cardenas‐Blanco, A., Boumezbeur, F. and Chan, D., 2019. European Ultrahigh‐Field Imaging Network for Neurodegenerative Diseases (EUFIND). Alzheimer's & Dementia: Diagnosis, Assessment & Disease Monitoring, 11(1), pp.538-549.
Figures