2631
Hybrid bias correction of thoracic zero echo time (ZTE) images
Chang Sun1, Roido Manavaki1, Jason Tarkin2, Christopher Wall2, James HF Rudd2, Fiona J Gilbert1, and Martin J Graves1
1Department of Radiology, University of Cambridge, Cambridge, United Kingdom, 2Division of Cardiovascular Medicine, University of Cambridge, Cambridge, United Kingdom
1Department of Radiology, University of Cambridge, Cambridge, United Kingdom, 2Division of Cardiovascular Medicine, University of Cambridge, Cambridge, United Kingdom
Synopsis
Bias correction in the thoracic region is challenging due to the low proton density in the lung. Traditional retrospective bias correction techniques, such as surface fitting method and the histogram-based method, suffer from over suppression in the lung regions or increased noise in the tissue. We propose a hybrid bias correction method that combines the advantages of the surface fitting and the histogram-based methods. The hybrid method normalized the signal intensity in lung and reduced the signal variation in tissue.
Introduction
Bias artifact is a low frequency variation of intensity across an image caused by hardware limitations1. Retrospective correction is commonly used to estimate and correct the bias field using surface fitting or histogram-based methods. Although surface fitting is more robust and suppresses noise2, it can fall into local minima when applied to the lung region, due to the low proton density. In addition, surface fitting often over suppresses the signal intensity in lung, creating difficulties in segmentation. To address this problem, we present a hybrid bias correction method that improves thoracic signal intensity uniformity by combining the surface fitting with a histogram-based method.Method
Image acquisitionImages were acquired on a 3T PET/MR scanner (SIGNA, GE Healthcare, Waukesha, WI). 3D images were acquired using the product ZTE (radial) pulse sequence and a 48-channel neck and chest coil in nine patients TE: 16µs, TR: 228ms, flip angle (FA): 1o, voxel size 1.9×1.9×2.6mm3, RBW: ±244kHz, NEX: 4, field-of-view (FOV): 50cm. In- and out-of-phase images were acquired using a dual echo 3D Dixon sequence and the system body coil with TE1 : 1.11ms, TE2 : 1.67ms, TR: 4.05ms, FA: 5o, voxel size 1.9x1.9x2.6mm3, RBW: ±166kHz, NEX: 0.7, FOV: 50cm. Water and fat separated images were subsequently calculated.
Image processing
The ZTE image (Figure 1A) was manually co-registered with the Dixon (in-phase, out-phase, water, fat; Figure 1D-G) images using rigid transformation. B-spline surface fitting (N4ITK)3 and histogram-based bias correction4 were used to create separate bias corrected ZTE images ( ZTEN4, ZTEhist; Figure 1B,C), together with their estimated bias fields (Figure 1J,K). To account for intensity differences, all bias-corrected images and bias fields were normalized by their mean intensity in tissue. Prior to intensity normalisation, two-class fuzzy c-means clustering was applied to ZTEN4 images to generate a body mask. Within each body mask, the mean tissue intensity was estimated with a two-class Gaussian mixture model (GMM). Following intensity normalisation, principal component analysis was applied to the normalised Dixon images to extract the first two principal components. Segmentation of the lung region utilised a five-cluster k-means algorithm with the two Dixon principal components and the normalized ZTEN4 image as inputs (Figure 1H,I). A tissue region was derived by subtracting the lung segmentation from the body mask. A hybrid bias field was generated by replacing the N4ITK bias field in the lung region with values from the histogram-based bias field. A 2D Gaussian filter (FWHM: 7.1) was used to smooth the bias field at the edges of the lung segmentation (Figure 1L). The original ZTE image (Figure 1A) was divided by this hybrid bias field to produce a bias-corrected ZTE image (ZTEhybrid; Figure 1M). To evaluate the performance of each bias correction method, the coefficient of variation (CV) and coefficient of joint variation (CJV) were calculated:
$$CV(I_i)=\frac{\sigma(I_i)}{\mu(I_i)}$$
$$CJV(I_i,I_j)=\frac{\sigma(I_i)+\sigma(I_j)}{\mid\mu(I_i)-\mu(I_j)\mid}$$
where $$$i,j$$$ are indices of classes, $$$I_i$$$is the image intensity for class $$$i$$$, $$$\sigma$$$ is the standard deviation and $$$\mu$$$ is the mean. A Wilcoxon signed rank test with Bonferroni correction was used for statistical comparison. p-values <0.05 were considered statistically significant.
Results
Figure 2 illustrates the probability density function (PDF) of the signal intensity in the lung and tissue regions (n = 9). Compared to the original ZTE PDF (Figure 2A), the N4ITK method (Figure 2B) normalized the signal intensity in tissue but not in lung. The histogram-based method (Figure 2C) broadened lung signal intensities, but the tissue signal intensity was less uniform than N4ITK. The hybrid method (Figure 2D) combines the lung PDF from the histogram method and the tissue PDF from N4ITK. The hybrid method demonstrated a lower coefficient of variation in the body (Figure 3A). Consistent with the results shown in Figure 2, tissue regions showed less variability for the hybrid algorithm than for the histogram-based method (Figure 3B). No significant difference between algorithms was found for the lung (Figure 3C). Additionally, the hybrid method showed higher inter-class joint variation between the lung and tissue regions than N4ITK (Figure 3D).Discussion
An assumption of N4ITK is that the bias field varies at a low frequency, and hence the image intensity variation is locally uniform. This does not hold in the lung, where signal intensity is low and non-uniform. Histogram methods based on local histogram analysis are more suited to images with a range of intensity values at the local level, but they are more sensitive to noise. The hybrid method combines the advantages of the N4ITK and histogram-based methods. It provided the lowest tissue signal variation among all three methods, and a lung signal distribution more consistent with the known variation of signal intensity in the lung.Because the true bias fields were not measured in these experiments, the comparison with the coefficient of variation and coefficient of joint variation may not fully assess the performance of each bias correction method. To accurately compare the bias correction performance, bias field mapping and simulation will be necessary for future improvement.
Conclusion
The hybrid bias correction method combined different bias correction strategies for the lung and the tissue region. The method reduced signal variation in tissue, normalized the signal in lung, and can potentially be used for ZTE based PTE/MR attenuation correction.Acknowledgements
This work was supported by the Wellcome Trust (211100/Z/18/Z), the Cancer Research UK Cambridge Centre [A25177], and the NIHR Cambridge Biomedical Research Centre (BRC).References
- Van Leemput, K., Maes, F., Vandermeulen, D. & Suetens, P. Automated model-based bias field correction of MR images of the brain. IEEE Trans. Med. Imaging 18, 885–896 (1999).
- Hou, Z. A review on MR image intensity inhomogeneity correction. Int. J. Biomed. Imaging 2006, 1–11 (2006).
- Tustison, N. J. et al. N4ITK: Improved N3 bias correction. IEEE Trans. Med. Imaging 29, 1310–1320 (2010).
- Wiesinger, F. et al. Zero TEMR bone imaging in the head. Magn. Reson. Med. 75, 107–114 (2016).
Figures
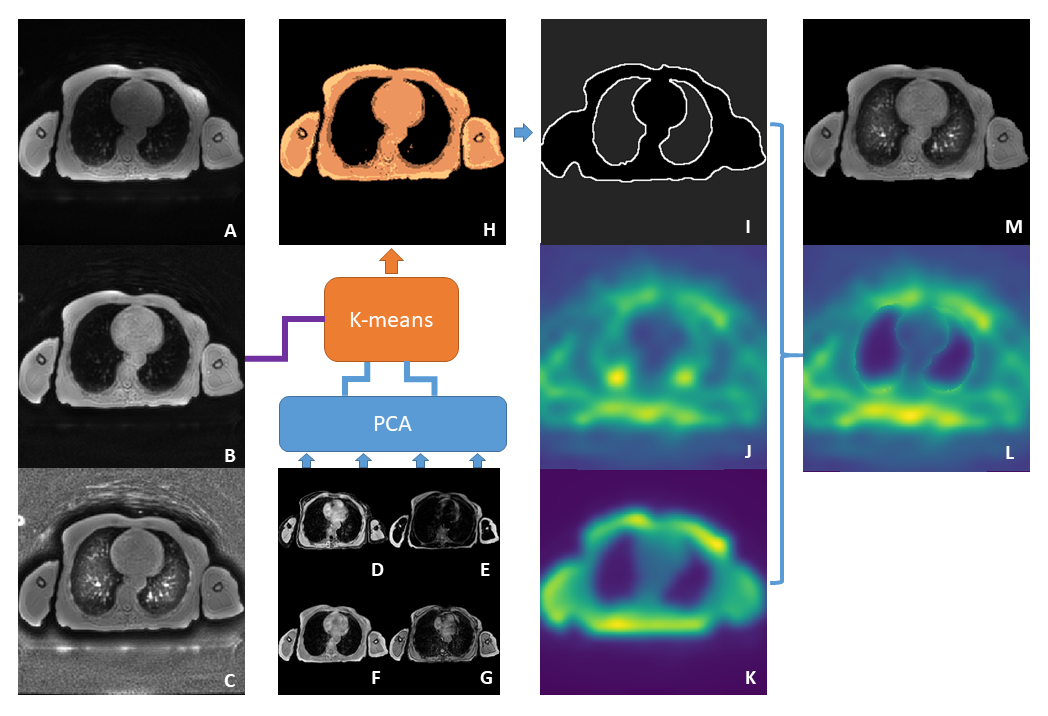
Figure 1. The
original ZTE image (A) is bias corrected with N4ITK (ZTEN4; B) and histogram-based methods ( ZTEhist; C). PCA is applied to
the Dixon images (D-G) to extract the first two principal
components. These are input into a five-class k-means cluster (H) together
with the normalised ZTEN4 image to obtain
a lung segmentation (I). A hybrid bias field (L) is created by replacing the
lung region values in the ZTEN4 bias field (J)
with those from the ZTEhist bias field (K).
After smoothing the lung edges, a bias-corrected ZTE image (M) is calculated by dividing (A) by the
hybrid bias field (L).
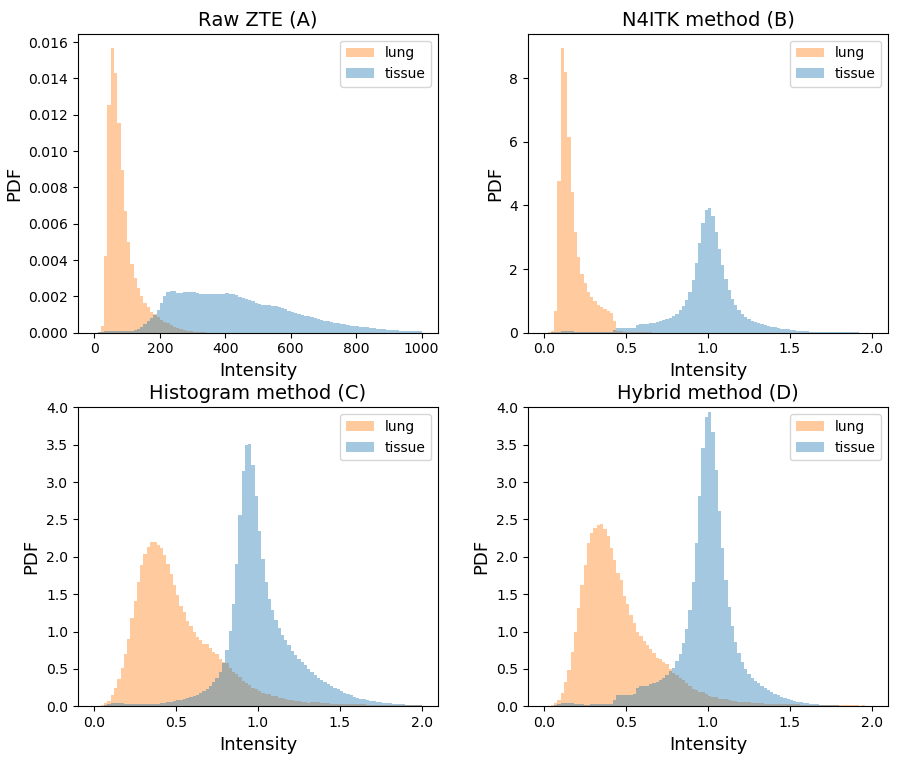
Figure 2. Probability density function (PDF) of the tissue
and lung regions.
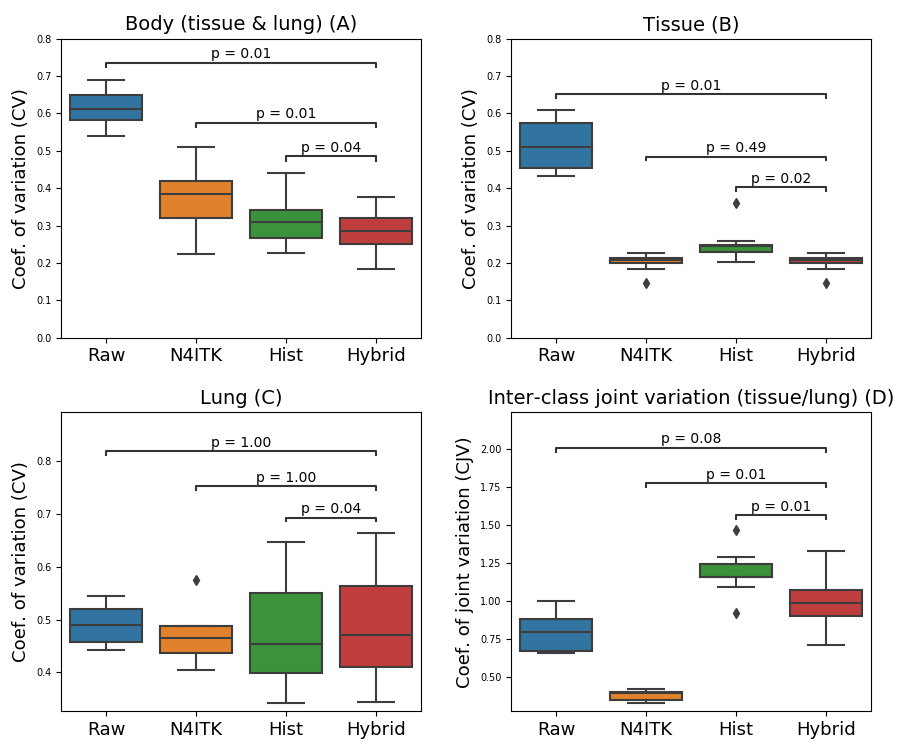
Figure 3. Boxplot showing the coefficient of variation for
the body, tissue and lung regions (n = 9 patients). Subplot D illustrates the corresponding
coefficient of joint variation for tissue and lung.