2630
A Singular Value Shrinkage Approach to Remove Artifacts from Neuro-electrophysiology Data Recorded During fMRI at 16.4T1Center for Magnetic Resonance Research, University of Minnesota, Minneapolis, MN, United States, 2Mechanical Engineering, University of Minnesota, Minneapolis, MN, United States
Synopsis
Acquiring neuro-electrophysiology signal simultaneously with fMRI is hindered by electromagnetic field interactions that generate artifacts, including fMRI gradient induced artifacts in the neuro-electrophysiology data. This abstract presents a novel method using a separation boundary on the singular value decomposition of the first difference of artifact-contaminated data to accurately reconstruct clean neural signals. The separation boundary can be estimated from a brief baseline recording period followed by simultaneous fMRI and neuro-electrophysiological data acquisition. The method is successfully demonstrated on neural recording data acquired simultaneously with time-series echo planar imaging at 16.4T.
Introduction
Simultaneous acquisition of neuro-electrophysiology and functional magnetic resonance imaging (fMRI) provides complimentary data to correlate fast processes with high spatial specificity (neuronal action potentials) and the slower blood-oxygen-level-dependent (BOLD) dynamics and functional connectivity imaged by fMRI. The use of ultrahigh field (UHF) in fMRI provides superior signal-to-noise and contrast-to-noise ratios, enhances the BOLD contribution from the microvasculature and improves the specificity of fMRI mapping (1,2). Unfortunately, fMRI data acquisition introduces large artifacts in neuro-electrophysiology recordings due to the time-varying magnetic gradients coupling into neural recording hardware. Previous solutions to this problem involved artifact template subtraction and/or regression approaches, and the use of principal component analysis (PCA) to provide additional basis functions for artifact removal (3–14). However, choosing the correct number of principal component axes corresponding to artifacts is not straightforward. In this abstract we present a novel approach to artifact removal that utilizes the discrete time-derivative of neural recording data acquired during fMRI at UHF (16.4T) to provide a clear boundary for separation of artifacts and neuro-electrophysiology.Methods
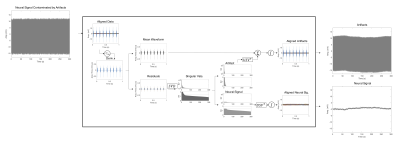
MRI-compatible multi-electrode arrays were acquired from NeuroNexus and chronically implanted into the cortex of female Sprague-Dawley rats. Subsequently, rats were anesthetized with isoflurane (nosecone) with their heads fixed. A single-loop 1H surface coil (698 MHz) was positioned over the head and the rat was placed in a 16.4T animal scanner (Varian). Respiration and body temperature were monitored and maintained within normal ranges. Animal procedures were approved by the IACUC at the University of Minnesota. Echo-planar imaging (EPI - single shot, 8 slices, TR = 1000 ms, TE = 12 ms, 0.375 mm in-plane resolution, 0.5 mm slice thickness, 300 repetitions) was performed simultaneously with neuro-electrophysiological recording at 24.4 kHz using a Tucker-Davis Technologies system. The fMRI scanning artifacts were separated from neural recording data using a singular value decomposition (SVD)– PCA approach, outlined in Fig. 1. The first difference of artifact contaminated data was computed and a matrix was formed from data aligned by TR. The mean artifact waveform was removed, centering the data matrix and leaving a combination of artifact residuals and neural signals. The residual data matrix was separated into artifacts and neural signals through soft shrinkage of singular values. The separation boundary is estimated by Equation 1, was found through trial-and-error in modifying the positive bulk edge of the MP-distribution (15) on neuro-electrophysiology acquired without artifacts.$$s_{+}=\sigma\sqrt{N}\left( 1+\sqrt{\beta\left(\frac{16}{9}-\frac{1}{3}\beta^{1/2}\right)} \right); \beta = \frac{M}{N}; 0<\beta\leq1\space\space\space\space\space\space\space\space\space\space Eq. (1)$$
Equation 1 provides an objective boundary $$$(s_{+})$$$ to separate artifacts and neural recording data based on the matrix size (M x N) and the standard deviation $$$(\sigma)$$$ of the first difference of the neural recording data. After separation, the artifact contributions are added to the mean artifact waveform to compute the artifact estimate, and neuro-electrophysiology data is reconstructed from the SVD matrices.
Results
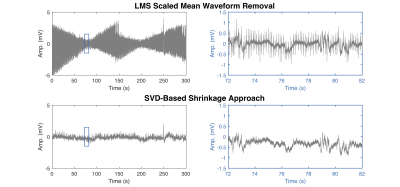
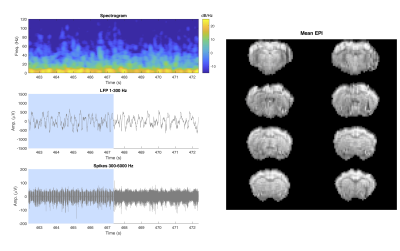
The effectiveness of our singular value shrinkage approach to artifact removal is highlighted in Figs. 2 and 3. Figure 2 compares artifact removal through the alternative method of least mean squares (LMS) artifact template fitting (top) to singular value shrinkage separation (bottom). LMS artifact fitting leaves substantial residual interferences whereas the SVD-based shrinkage approach is able to uncover clean local field potential (LFP) signals prior to additional filtering. Figure 3 presents the LFP spectrogram and time-domain plots centered around the transition from EPI acquisition to post-scan to show that the data during and after scanning are of the same quality detected from a representative electrode. The neuron spiking signal is also presented in the lower left panel, which was obtained through additional processing previously reported (16,17). The mean EPI images acquired during the neural recording are illustrated on the right-side of Fig. 3.Discussion
The singular value shrinkage approach to separate the time-derivative of fMRI scanning artifacts and neuro-electrophysiology is highly effective and does not require manual and subjective estimation of the separating boundary, thanks to Equation (1) which bounds the first difference of neural recording data acquired without artifacts. This merit enables excellent quality LFP to be uncovered from the scanning artifacts which will benefit study of the brain activation and neurovascular coupling at the scale of functional columns and layers. Incorporating adaptive virtual referencing techniques also enables visualization of the neuronal action potential signals. To this point we have utilized a very conservative soft-shrinkage approach to artifact separation based on Equation (1) that aims to completely preserve neural signal contributions to the singular values. However, using an optimal shrinkage strategy on the first difference of neural recording data presents a potential path to full spectrum neuro-electrophysiology (LFP and spikes) during UHF fMRI without signal gaps in the neuron spike signal obtainable by the current state-of-the-art.Conclusion
We have presented a new approach to artifact removal from neuro-electrophysiology acquired during UHF fMRI that builds on previous PCA-based approaches. The first difference of neural recording data is positively bounded by Equation (1), allowing clear separation of artifacts from neuro-electrophysiology. This technique allows simultaneous fMRI and electrophysiology recording at UHF with high fidelity and robustness as tested at 16.4T for future study of neurovascular coupling and brain function at the meso-scale of functional columns and laminae in animal models.Acknowledgements
The authors would like to thank Dr. Yuncong Ma for helpful discussion regarding simultaneous fMRI and neural recording. This work was supported in part by NIH grants of R01 MH111413, R01 NS118330, P41 EB027061, P30 NS076408, S10 RR025031, the W.M. Keck Foundation, and by the University of Minnesota’s MnDRIVE (Minnesota’s Discovery, Research and Innovation Economy) initiative.References
1. Duong TQ, Yacoub E, Adriany G, Hu X, Ugurbil K, Kim S-G. Microvascular BOLD contribution at 4 and 7 T in the human brain: Gradient-echo and spin-echo fMRI with suppression of blood effects. Magn. Reson. Med. 2003;49:1019–1027.
2. Uǧurbil K, Adriany G, Andersen P, et al. Ultrahigh field magnetic resonance imaging and spectroscopy. Magn. Reson. Imaging 2003;21:1263–1281.
3. Allen PJ, Josephs O, Turner R. A method for removing imaging artifact from continuous EEG recorded during functional MRI. Neuroimage 2000;12:230–239.
4. Logothetis NK, Pauls J, Augath M, Trinath T, Oeltermann A. Neurophysiological investigation of the basis of the fMRI signal. Nature 2001;412:150–157.
5. Duffy BA, Choy M, Chuapoco MR, Madsen M, Lee JH. MRI compatible optrodes for simultaneous LFP and optogenetic fMRI investigation of seizure-like afterdischarges. Neuroimage 2015;123:173–184.
6. Tu W, Ma Y, Neuberger T, Zhang N. Simultanoues whole brain resting state fMRI and full-spectrum electrophysiology in rodents. In: Proc Intl Soc Mag Reson Med. ; 2020. p. 1342.
7. Goldman RI, Stern JM, Engel Jr. J, Cohen MS. Acquiring simultaneous EEG and functional MRI. Clin. Neurophysiol. 2000;111:1974–1980.
8. Garreffa G, Carni M, Gualniera G, et al. Real-time MR artifacts filtering during continuous EEG/fMRI acquisition. Magn. Reson. Imaging 2003;21:1175–1189.
9. Mirsattari SM, Ives JR, Bihari F, Leung LS, Menon RS, Bartha R. Real-time display of artifact-free electroencephalography during functional magnetic resonance imaging and magnetic resonance spectroscopy in an animal model of epilepsy. Magn. Reson. Med. 2005;53:456–464.
10. Niazy RK, Beckmann CF, Iannetti GD, Brady JM, Smith SM. Removal of FMRI environment artifacts from EEG data using optimal basis sets. Neuroimage 2005;28:720–737.
11. Negishi M, Abildgaard M, Nixon T, Constable RT. Removal of time-varying gradient artifacts from EEG data acquired during continuous fMRI. Clin. Neurophysiol. 2004;115:2181–2192.
12. Rosa MJ, Kilner J, Blankenburg F, Josephs O, Penny W. Estimating the transfer function from neuronal activity to BOLD using simultaneous EEG-fMRI. Neuroimage 2010;49:1496–1509.
13. Pan W-J, Thompson G, Magnuson M, Majeed W, Jaeger D, Keilholz S. Broadband Local Field Potentials Correlate with Spontaneous Fluctuations in Functional Magnetic Resonance Imaging Signals in the Rat Somatosensory Cortex Under Isoflurane Anesthesia. Brain Connect. 2011;1:119–131.
14. Scheeringa R, Fries P, Petersson K-M, et al. Neuronal dynamics underlying high-and low-frequency EEG oscillations contribute independently to the human BOLD signal. Neuron 2011;69:572–583.
15. Marchenko VA, Pastur LA. Distribution of eigenvalues for some sets of random matrices. Mat. Sb. 1967;114:507–536.
16. Cruttenden C, Zhu W, Zhang Y, Rajamani R, Zhu X-H, Chen W. Adaptive Virtual Referencing Enables Recording of Extracellular Action Potentials in a 16.4 Tesla Animal Research MRI Scanner. In: Proc Intl Soc Mag Reson Med. ; 2020. p. 1341.
17. Cruttenden CE, Zhu W, Zhang Y, et al. Adaptive virtual referencing for the extraction of extracellularly recorded action potentials in noisy environments. J. Neural Eng. 2020;17:056011.
Figures


