2629
The optimization of three adiabatic pulses with constant amplitude spin-lock1Shenzhen Institute of Advanced Technology,Chinese Academy of Sciences, Shenzhen, China, 2Shenzhen College of Advanced Technology, University of Chinese Academy of Sciences, Shenzhen, China, Shenzhen, China, 3Research Centre for Medical AI, Shenzhen Institutes of Advanced Technology, Chinese Academy of Science, Shenzhen, China, Shenzhen, China
Synopsis
An optimization aimed at shortening pulse durations was carried out for three types of adiabatic spin-lock pulses by means of Bloch simulation. The variance of a part of the trajectory of Mz with respect to a range of off-resonance values was calculated to find the optimal pulse parameters and decent T1ρ-weighted imaging and T1ρ mapping results were obtained.
Introduction
The spin-lattice relaxation in the rotating frame (T1ρ) is a novel contrast that can reflect the slow motional characteristics of macromolecules and has been considered to be a potential early biomarker for various pathological processes. T1ρ weighting can be generated using most MRI sequences by adding a spin-lock pulse before the acquisition. However, the spin-lock pulse is sensitive to B1 and B0 inhomogeneities, which may cause severe artifacts on the image. Several methods has been proposed to mitigate this problem, including [2-8], adiabatic pulses with constant [8-15] or time varying amplitude [16-21] spin-lock. Among these methods, adiabatic pulse with constant amplitude spin-lock has been shown to be robust to B1 and B0 inhomogeneities. Also, it utilizes the same mechanism as the conventional constant amplitude spin-lock pulse, compared with adiabatic pulse with time varying amplitude. There are several methods for adiabatic pulse design. In this work, we aim to find the optimized pulse design parameters for three types of adiabatic pulse, and compare their performance.Methods
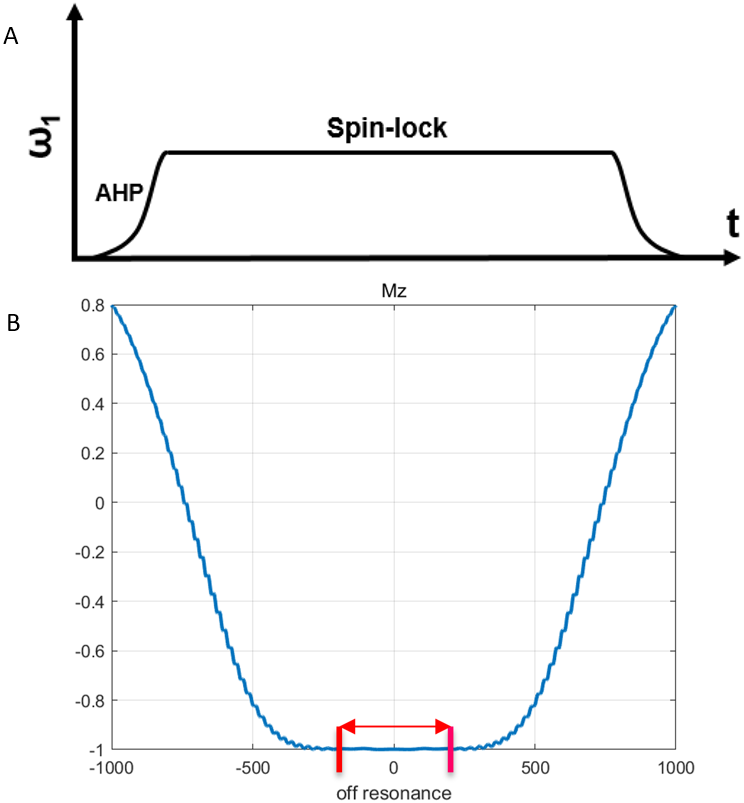
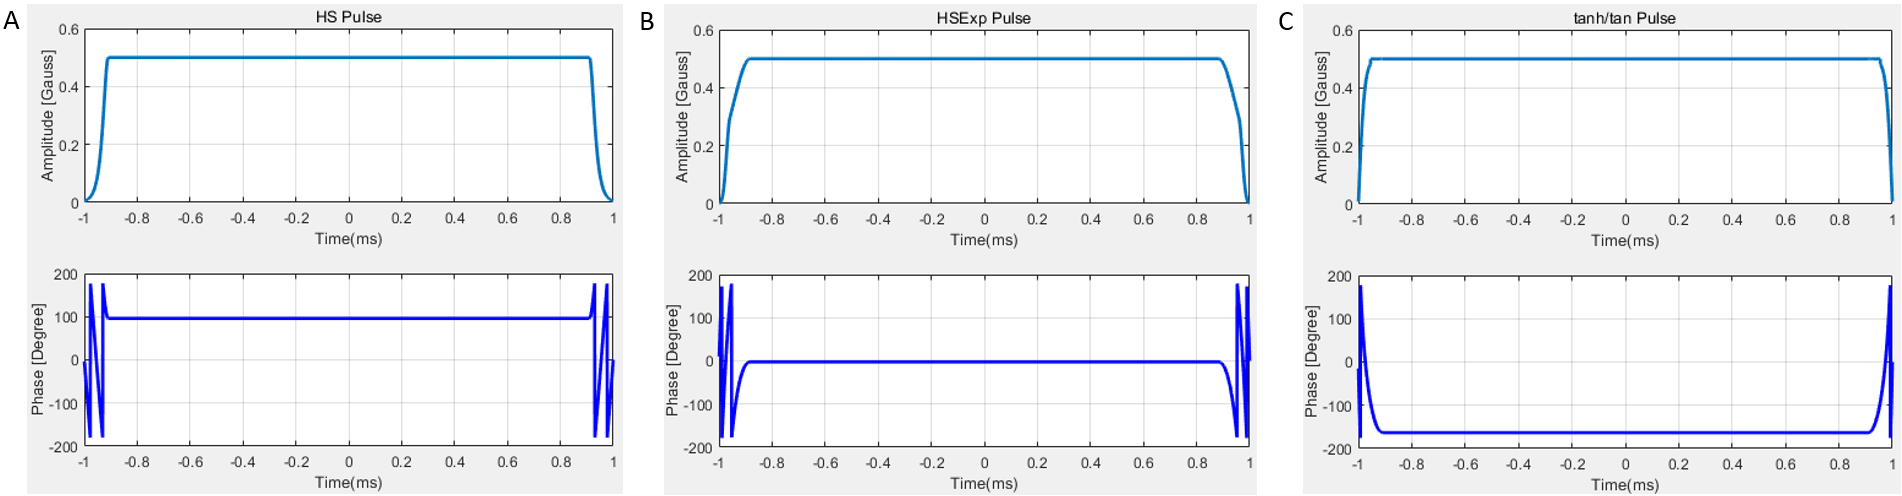
The waveform of the adiabatic pulse with constant amplitude spin-lock is shown in Figure 1. The AHP and the reverse AHP are placed at the beginning and the end of the constant amplitude spin-lock RF pulse. Three types of adiabatic pulses, including hyperbolic secant (HS), HSExp (a windowed amplitude modulation on HS pulse) and hyperbolic tangent/tangent (tanh/tan) adiabatic full passage were involved in our study. The amplitude and frequency modulated function of the three pulses are shown as follows:For the HS pulse
$$\omega_1(t)=\omega_1^{max}sech(\beta(2t/T_p-1))$$
$$\omega_{RF}(t)-\omega_c=Atanh(\beta(2t/T_p-1))$$
For the HSExp pulse
$$\omega_1(t)=\omega_1^{max}sech(2\pi A/\mu(t-T_p))H(t)$$
$$\Delta\omega_p(t)=2\pi A(exp(-t/T_pef)-exp(-ef))+\Delta\omega$$
$$H(t)\begin{cases}t≤t_{window}: 0.42-0.5cos(\pi t/t_{window})+0.08cos(2\pi t/t_{window})\\t>t_{window}: 1\end{cases}$$
For the tanh/tan pulse
$$\omega_1(t)=\omega_1^{max}tanh(2\xi t/T_p) (0<t<0.5T_p)$$
$$\omega_1(t)=\omega_1^{max}tanh(2\xi (1-t/T_p)) (0.5T_p<t<T_p)$$
$$\omega_{RF}(t)-\omega_c=A(tan(\kappa(2t/T_p-1))/tan(\kappa)) (0<t<T_p)$$
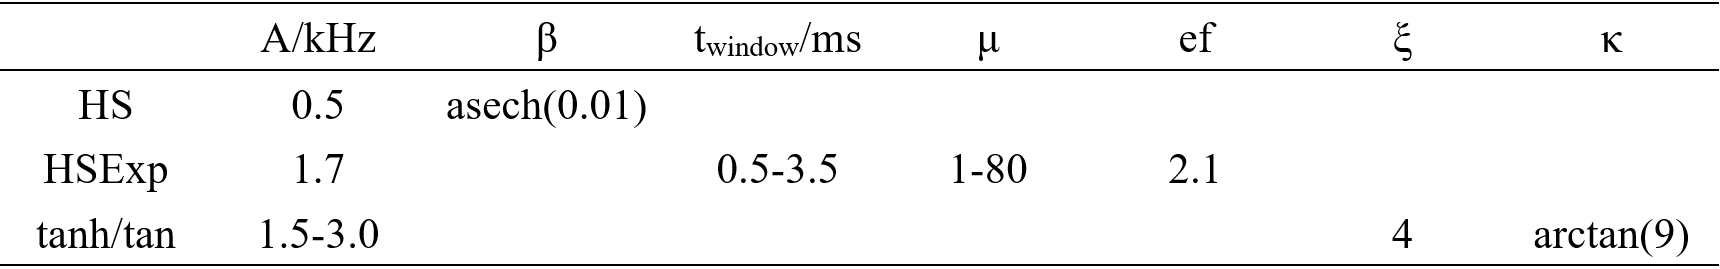
Where $$$\omega_1^{max}$$$ is the maximum pulse amplitude, $$$β$$$ is a dimensionless truncation factor, $$$T_p$$$ is pulse length, $$$\omega_c$$$ is the carrier frequency, $$$A$$$ is the bandwidth/2, $$$\mu$$$ and $$$ef$$$ are dimensionless parameters and $$$\xi$$$ and $$$\kappa$$$ are constants. The stability degree for each pulse was calculated using Bloch simulation. The off-resonance range was chosen from -200 to 200 Hz (Figure 1). The variance of the longitudinal magnetization Mz after the adiabatic spin-lock pulse within the above range was calculated using the following formula and was defined as the degree of stability.
$$s=(1/(n-1)\sum_{i=1}^n(x_i-\overline x)^2)^{1/2}$$
Where $$$n$$$ is the amount of the off-resonance range, $$$x_i$$$ is each Mz value with respect to this range, and $$$\overline x$$$ refers to the average of the sum of Mz values. Optimization was performed by brute force over a range of design parameters (shown in Table 1). Due to the hardware limitation of the total RF pulse duration, a short AHP duration of 4 ms is used in this study to allow a maximum spin-lock duration. Since previous study has shown that insensitivity to B1 and B0 inhomogeneities can be achieved when $$$\omega_1^{max}=\omega_sl$$$ [1], we fixed the spin-lock frequency as 500Hz. Spin-lock duration in simulation was 60ms for HSExp pulse and 80ms for HS and tanh/tan pulses. Both phantom and in vivo experiments were conducted. The bSSFP sequence was applied after adiabatic pulses to obtain the T1ρ-weighted images.
Results and Conclusion
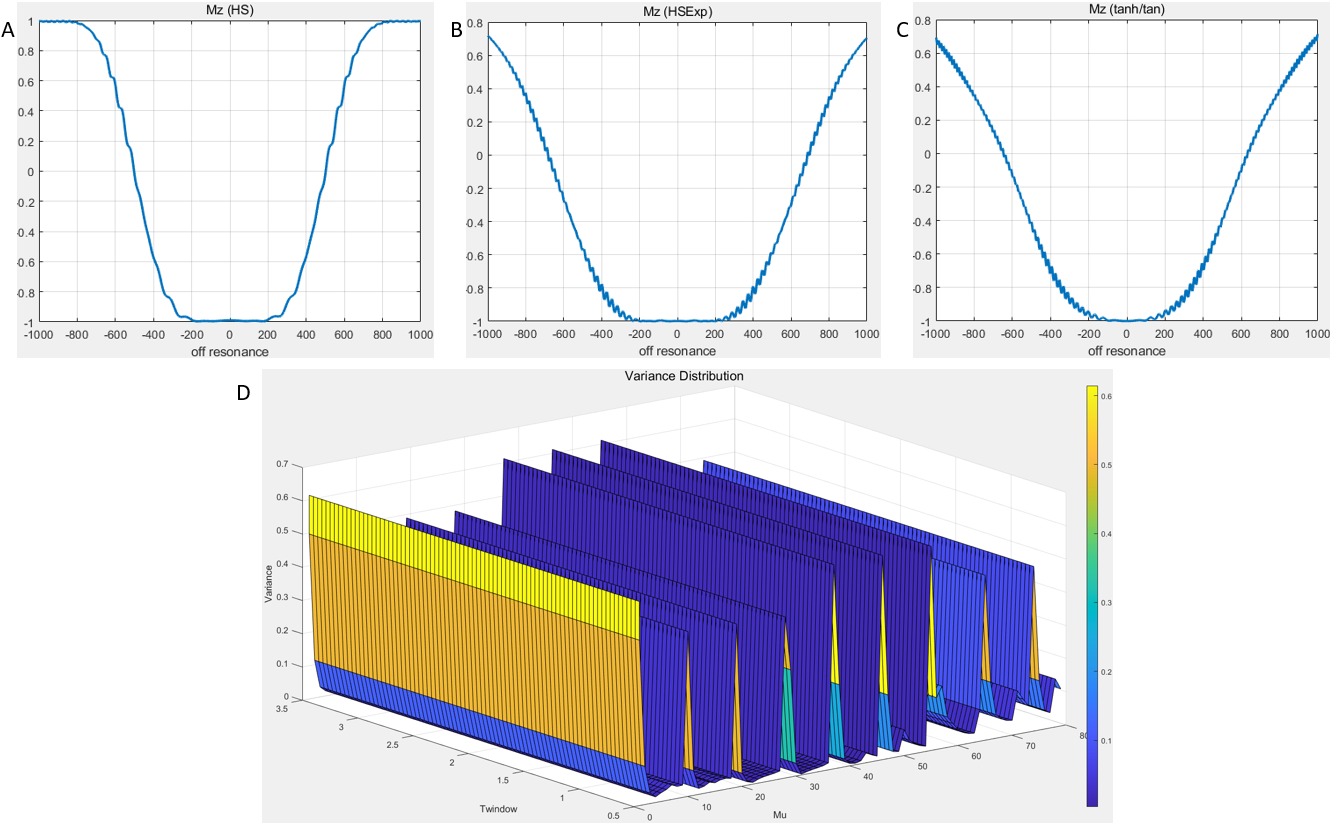
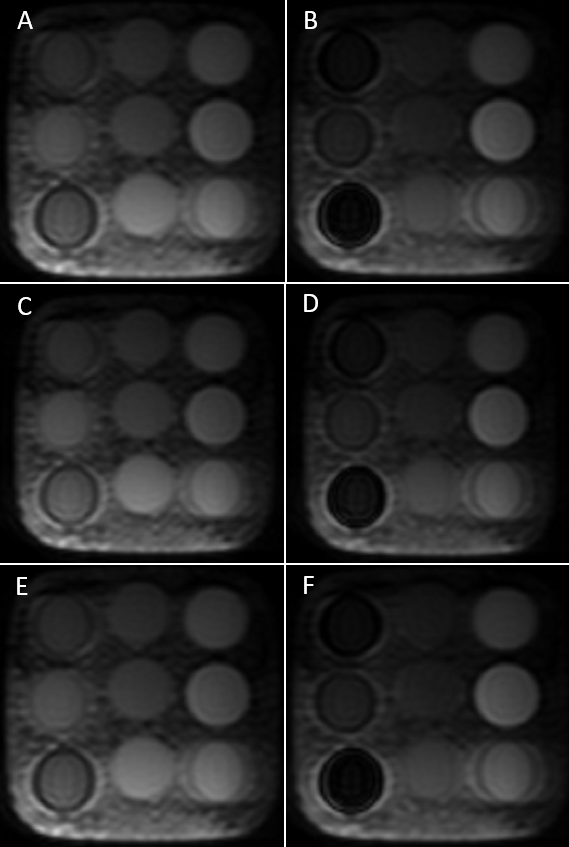
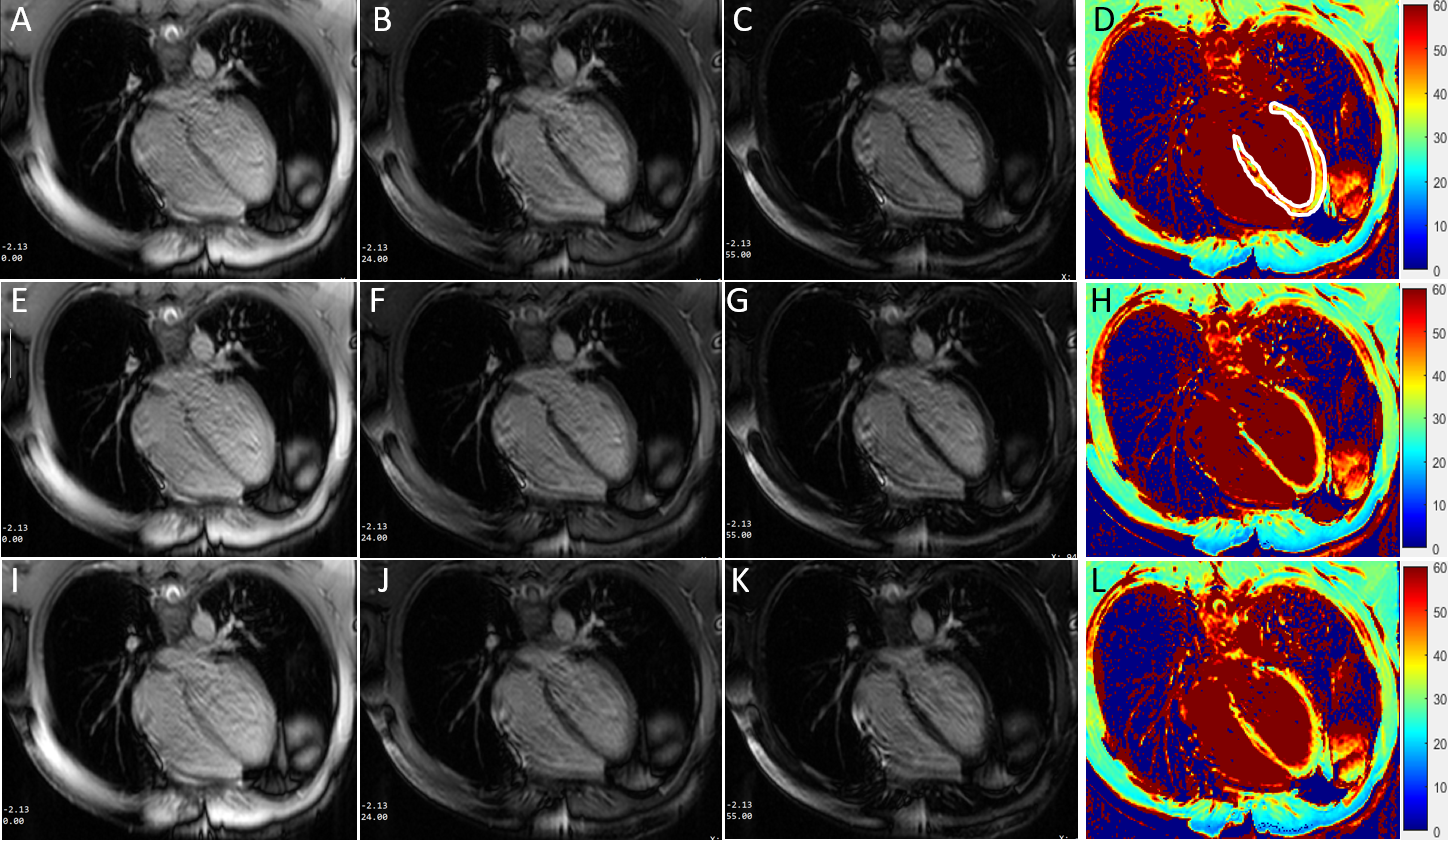
When pulse duration = 4ms, the optimized parameters for HS pulse: A = 0.5 kHz and β = asech(0.01). For HSExp pulse: twindow = 1.4 ms and μ = 25 (Figure 4). And for tanh/tan pulse: A = 2.2 kHz. Among these three pulses evaluated by simulation (Figure 2), HS pulse achieved the highest stability degree (Figure 3). In phantom study, three optimized pulses all produced acceptable T1ρ-weighted images as shown in Figure 4. In vivo study, T1ρ-weighted images and T1ρ map were obtained (Figure 5) , thus conclusion can be drawn that adiabatic pulses with short duration and proper parameters shows no clear deficiency in terms of imaging and mapping qualities in spite of some artifacts that we expect were due to inadequate breath-holding.Acknowledgements
This work is supported in part by the National Natural Science Foundation of China under grant nos. 61771463,81971611, National Key R&D Program of China nos. 2020YFA0712202, 2017YFC0108802 , the Innovation and Technology Commission of the government of Hong Kong SAR under grant no. MRP/001/18X, and the Chinese Academy of Sciences program under grant no. 2020GZL006..References
1. Jiang B , Chen W . On-resonance and off-resonance continuous wave constant amplitude spin-lock and T1ρ quantification in the presence of B1 and B0 inhomogeneities[J]. NMR in Biomedicine, 2018, 31.
2. Charagundla SR, Borthakur A, Leigh JS, Reddy R. Artifacts in T1ρ-weighted imaging: correction with a self-compensating spin-locking pulse. J Magn Reson. 2003;162(1):113-121.
3. Witschey WR, Borthakur A, Elliott MA, et al. Artifacts in T1ρ-weighted imaging: compensation for B1 and B0 field imperfections. J Magn Reson. 2007;186(1):75-85.
4. Chen W, Takahashi A, Han E. Quantitative T1ρ imaging using phase cycling for B0 and B1 field inhomogeneity compensation. Magn Reson Imaging. 2011;29(5):608-619.
5. Dixon WT, Oshinski JN, Trudeau JD, Arnold BC, Pettigrew RI. Myocardial suppression in vivo by spin locking with composite pulses. Magn Reson Med. 1996;36(1):90-94.
6. Yuan J, Li Y, Zhao F, Chan Q, Ahuja AT, Wang Y-XJ. Quantification of T1ρ relaxation by using rotary echo spin-lock pulses in the presence of B0 inhomogeneity. Phys Med Biol. 2012;57(15):5003-5016.
7. Mitrea BG, Krafft AJ, Song R, Loeffler RB, Hillenbrand CM. Paired self-compensated spin-lock preparation for improved T1ρ quantification. J Magn Reson. 2016;268:49-57.
8. Chen W. Artifacts correction for T1rho imaging with constant amplitude spin-lock. J Magn Reson. 2017;274:13-23.
9. Schuenke P, Koehler C, Korzowski A, et al. Adiabatically prepared spin-lock approach for T1ρ-based dynamic glucose enhanced MRI at ultrahigh fields. Magn Reson Med. 2016;78(1):215-225.
10. Santyr GE, Fairbanks EJ, Kelcz F, Sorenson JA. Off-resonance spin locking for MR imaging. Magn Reson Med. 1994;32(1):43-51.
11. Gröhn OH, Mäkelä HI, Lukkarinen JA, et al. On- and off-resonance T1ρ MRI in acute cerebral ischemia of the rat. Magn Reson Med. 2002;49(1):172-176.
12. Gröhn HI, Michaeli S, Garwood M, Kauppinen RA, Gröhn OHJ. Quantitative T1ρ and adiabatic Carr-Purcell T2 magnetic resonance imaging of human occipital lobe at 4 T. Magn Reson Med. 2005;54(1):14-19.
13. Jokivarsi KT, Niskanen J-P, Michaeli S, et al. Quantitative assessment of water pools by T1ρ and T2ρ MRI in acute cerebral ischemia of the rat. J Cereb Blood Flow Metab. 2008;29(1):206-216.
14. Cobb JG, Xie J, Gore JC. Contributions of chemical exchange to T1ρ dispersion in a tissue model. Magn Reson Med. 2011;66(6):1563-1571.
15. Okuaki T, Takayama Y, Nishie A, et al. T1ρ mapping improvement using stretched-type adiabatic locking pulses for assessment of human liver function at 3 T . Magn Reson Imaging. 2017;40:17-23.
16. Taheri S, Sood R. Spin-lock MRI with amplitude- and phase-modulated adiabatic waveforms: an MR simulation study. Magn Reson Imaging. 2006;24(1):51-59.
17. Michaeli S, Sorce DJ, Springer CS, Ugurbil K, Garwood M. T1ρ MRI contrast in the human brain: modulation of the longitudinal rotating frame relaxation shutter-speed during an adiabatic RF pulse. J Magn Reson. 2006;181(1):135-147.
18. Michaeli S, Sorce D, Garwood M. T2ρ and T1ρ adiabatic relaxations and contrasts. Curr Anal Chem. 2008;4(1):8-25.
19. Mangia S, LiimatainenT, Garwood M, Michaeli S. Rotating frame relaxation during adiabatic pulses vs. conventional spin lock: simulations and experimental results at 4T. Magn Reson Imaging. 2009;27(8):1074-1087.
20. Ellermann J, Ling W, Nissi MJ, et al. MRI rotating frame relaxation measurements for articular cartilage assessment. Magn Reson Imaging. 2013;31(9):1537-1543.
21. Andronesi OC, Bhat H, Reuter M, Mukherjee S, Caravan P, Rosen BR. Whole brain mapping of water pools and molecular dynamics with rotating frame MR relaxation using gradient modulated low-power adiabatic pulses. Neuroimage. 2014;89:92-109.
Figures