2628
Parallelized Blind MR Image Denoising using Deep Convolutional Neural Network
satoshi ITO1, taro SUGAI1, kohei TAKANO1, and shohei OUCHI1
1Utsunomiya University, Utsunomiya, Japan
1Utsunomiya University, Utsunomiya, Japan
Synopsis
To improve the denoising performance of a convolutional neural network (CNN), a parallelized blind image denoising (ParBID) was proposed and demonstrated. ParBID procedure is similar to SENSE technique, 1) linear combination of adjacent 2D sliced noisy images, 2) blind noise level CNN denoising, and 3) separation of linearly combined and denoised images by solving linear equation. Experimental studies showed that the PSNR and the SSIM were improved for all noise levels, from 2.5% to 7.5%. ParBID showed that the greatest PSNR improvements were obtained when three slice images were used for linear image combination.
Introduction
Recently, the application of deep learning to the image denoising problem has attracted significant attentions [1]. In the present study, the denoising CNN was improved by two approaches. Several images with different noise distributions can be obtained by combining adjacent slice images linearly with different weighting coefficients. Blind noise removal using the CNN is useful and effective for denoising these combined images. Since combined images suffer from blurring, sliced images are separated by solving linear equations. Parallelized blind image denoising was compared with the single image denoising CNN and other denoising filters.Method
The parallelized blind image denoising (referred to herein as ParBID) procedure consists of three steps. Figure 1 illustrates the scheme of the ParBID. The first step is the linear combination of multi-slice images with given weights. Let the k-th slice image be $$$r_k =\rho_k +\delta_k $$$ where $$$\rho_k $$$ is a noise-free image, and $$$\delta_k $$$ is the noise superimposed on the image $$$\rho_k $$$, then the linear combination of slice images $$$i_s$$$ are written as follows using weight coefficients $$$a_{s,k}$$$:$$i_s = \sum_{k} a_{s,k} r_k \label{lincom}\\= \sum_k a_{s,k} \rho_k+\sum_k a_{s,k} \delta_k … (1)$$
Equation (1) can be made linear equations by varying weight coefficients $$$a_{s,k}$$$. By assembling noisy and combined images in vectors, Eq.(1) can be rewritten as:
$${\bf I^T= \bf A \bf R^T} , .. (2)$$
where $$${\bf R} =(r_1, r_2,..., r_n)$$$, $$${\bf I}=(i_1, i_2,..., i_m)$$$, $$$\bf A$$$ is $$$n \times m$$$ size weight coefficient matrix. The second step is blind denoising of the combined images:
$$d_s={\rm DnCNNB}(i_s), …(3)$$
where BDnCNN refers to Blind DnCNN operation [1], and $$$d_s$$$indicates the denoised image. Since averaged image $$$i_s$$$ has a higher SNR than $$$r_s$$$ and the noise distribution on $$$i_s$$$ varies according to weights $$$a_{s,k}$$$ in Eq. (1), the manner of noise removal is considered to vary in each denoising process of $$$i_s$$$ in Eq. (3). The third step is the separation of linearly combined images by solving linear equations. Blurring of images is canceled by this final step:
$${\bf P^T= (\bf A^{T} \bf A)^{-1} \bf A^{T} \bf D ^T} ... (4)$$
where $$${\rm \bf P}$$$ and $$${\bf D}$$$ are vectors of separated denoised image $$$p_s$$$ and image $$$d_s$$$, respectively, and $$${\bf P} =(p_1, p_2, ..p_n)$$$ and $$${\rm \bf D} =(d_1, d_2, ..d_m)$$$. Image sequence $$$(p_1, p_2, ..p_n)$$$ is the output of ParBID.
Results & Discussions
Examinations of from 2-slice to 4-slice ParBID were performed at noise levels of 2.5%, 5.0%, and 7.5%. Figure 2 shows the results using BDnCNN[1] and BM3D [2] at each noise level. The PSNR and the SSIM improve up to three slices and then decrease for all noise levels in BDnCNN whereas the change in PSNR and SSIM are very small in BM3D. The improvement in the PSNR was greater for lower noise levels at 2.5%, and the improvement in the SSIM is greater for higher noise levels at 7.5% in BDnCNN. Figure 3 shows the denoised image with ParBID in BDnCNN. Enlarged images of the region inside the red box are compared. The linear combination of adjacent images (b), (d) with target image (c) is shown in image (e). Subimages (e) through (h) show the denoised images using single-slice BDnCNN and the 2- and 3-slice ParBID, respectively. Application of ParBID to an experimentally obtained MR image is shown in Fig. 4. Magnitude images (256×256) were used for testing (slice thickness 1.2 mm). Subimage (a) is the target image and (b), (c) are adjacent images of (a). Subimages (d) through (f) are denoised image by single slice BDnCNN, 2-slice ParBID, and 3-slice ParBID, respectively. Denoised images (f) and (l) obtained by 3-slice ParBID clearly retain image contrast, as shown in the region indicated by the white arrow. These images indicate that details of images are preserved to a much higher degree in 3-slice ParBID. Consider the slice intervals from middle $$$p_2$$$ to other intervals in 4-slice ParBID. There is one slice interval between $$$p_2-p_1$$$ and $$$p_2-p_3$$$, and two slice intervals between $$$p_2$$$ and $$$p_4$$$. The similarity of the image distribution will be reduced when the slice interval is greater than one. Therefore, the PSNR of 4-slice ParBID becomes slightly smaller than that of the middle slice in 3-slice ParBID. Signal-to-noise ratio (SNR) varies spatially even in a single noisy image. BDnCNN can adaptively denoise spatially variant noisy images, in contrast, BM3D try to denoise images with a fixed SNR, therefore it is considered that ParBID could not improve denoising performances with ParBID.Conclusion
Parallelized image denoising using blind denoising has the possibility to further improve the denoising performance of the denoising CNN using linear combination of images.Acknowledgements
This study was supported in part by JSPS KAKENHI(19K04423) and the Kayamori Foundation of Informational Science Advancement. We would like to thank Canon Medical Systems.References
- Zhang K, Zuo et al. Beyond a Gaussian Denoiser: Residual Learning of Deep CNN for Image Denoising. IEEE Trans. Image Processing 2017; 26: 3142-3155.
- Dabov K, Foi A, Katkovnik V et al. Image Denoising by Sparse 3-D Transform-Domain Collaborative Filtering. IEEE Trans. Image Processing 2007; 16: 2080-2095.
Figures
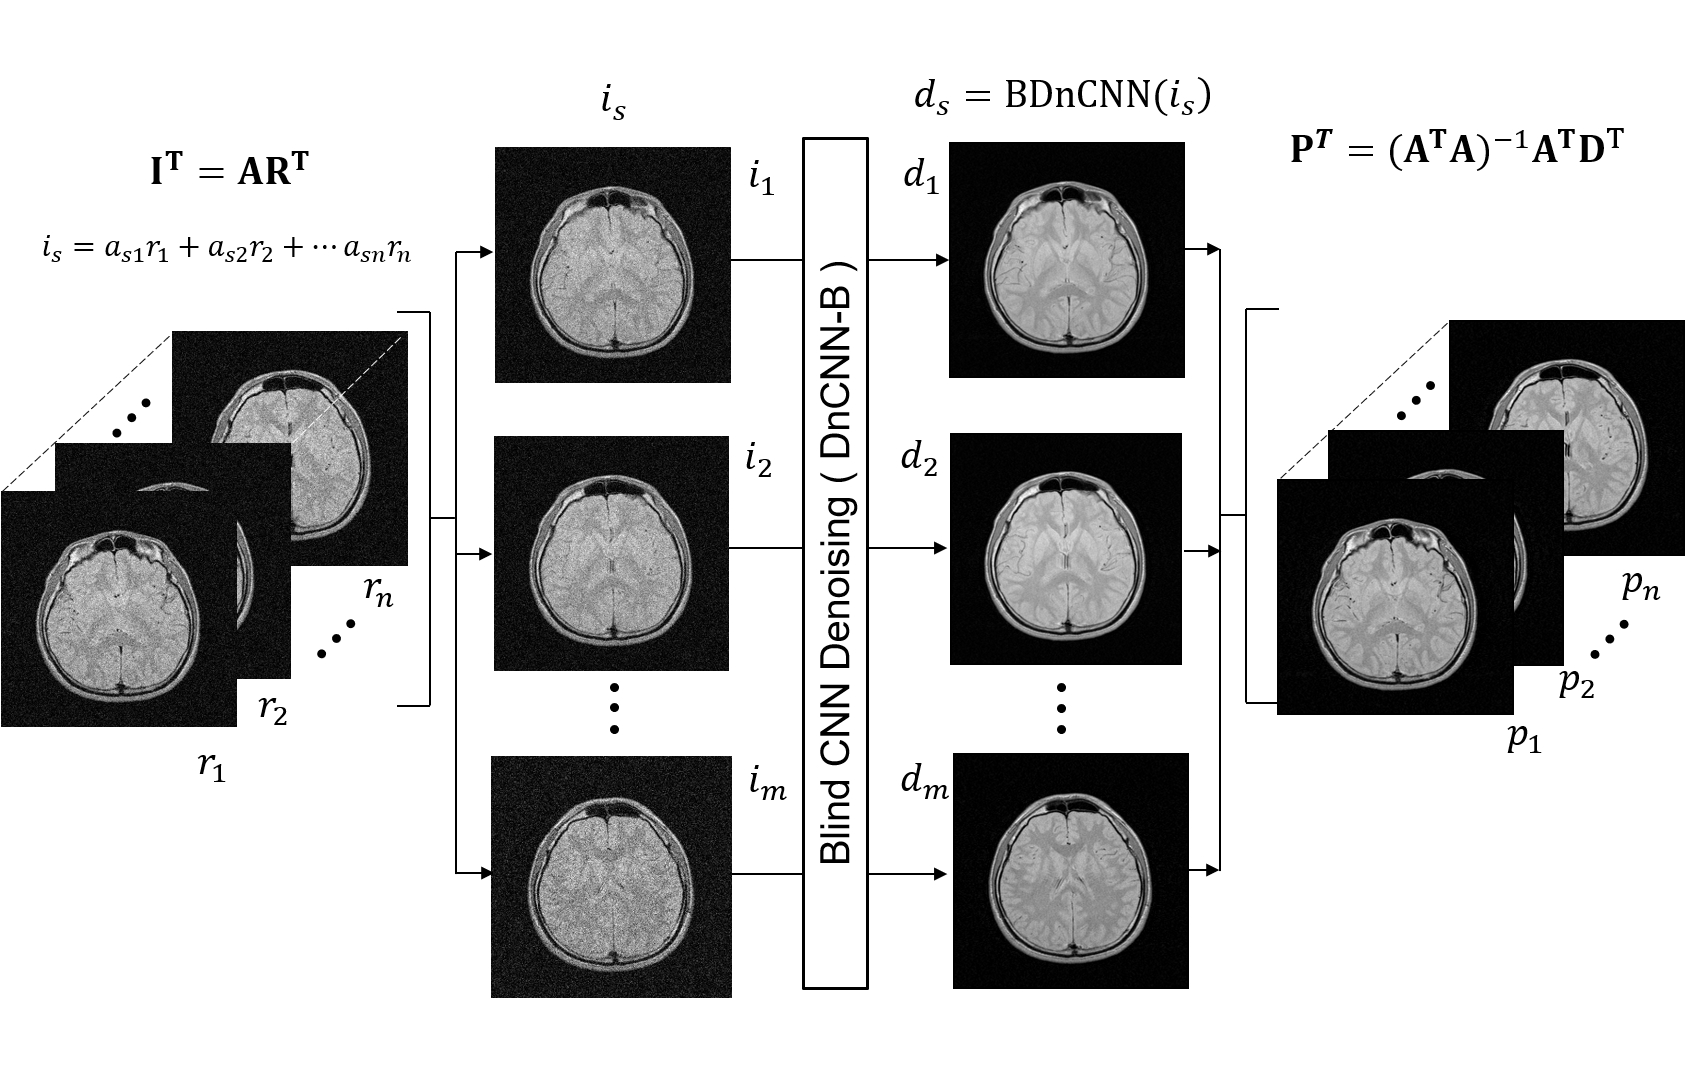
Figure 1. Schematic of parallelized blind image denoising (ParBID).
The first step is the linear combination of
adjacent images with given weights $$$a$$$.
The second step is the blind DnCNN of the combined images. The third step is
the separation of linearly combined images by solving linear equations.
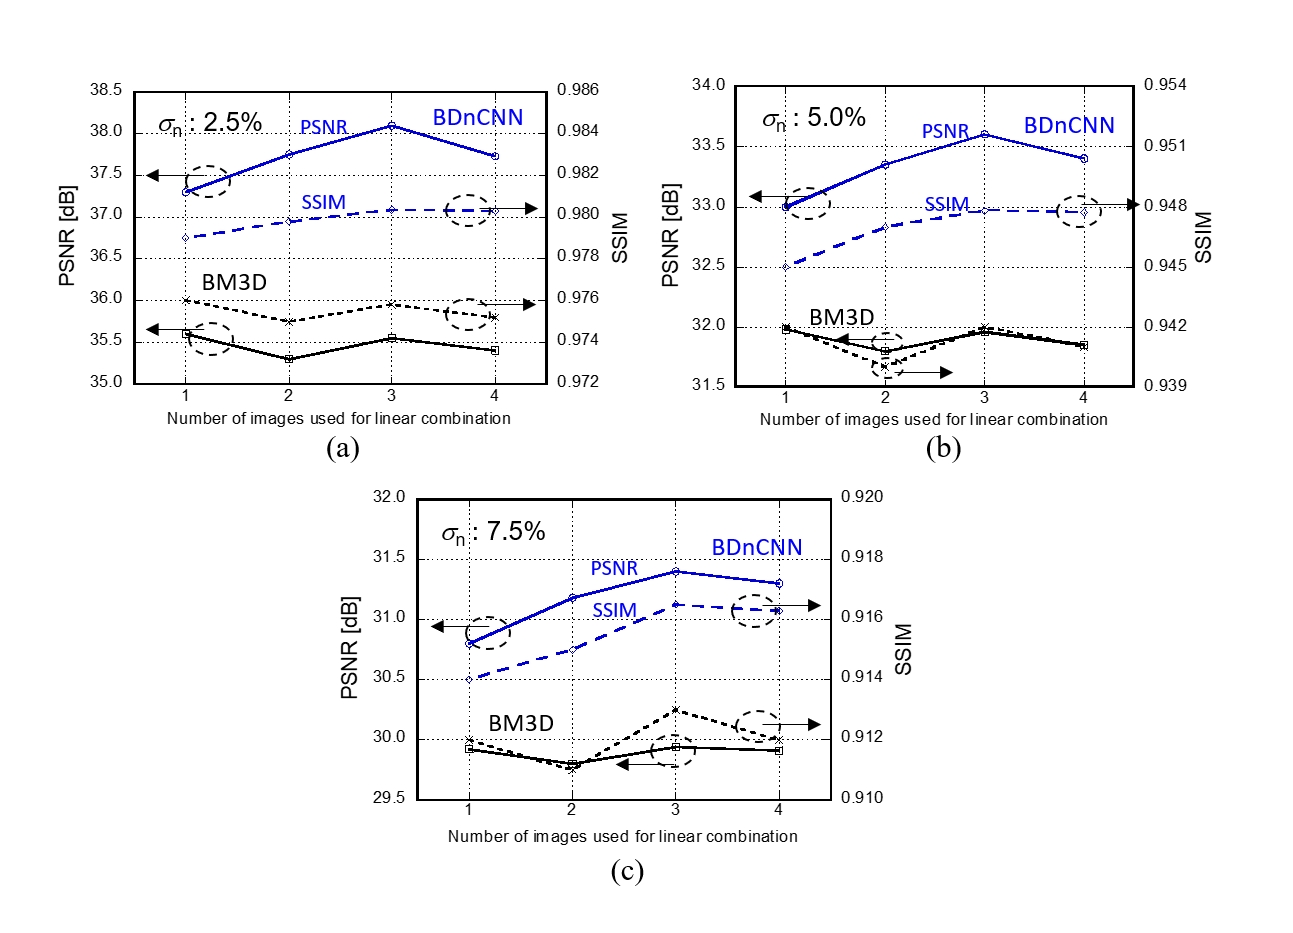
Figure 2. Results of PSNR and SSIM evaluation with ParBID using DnCNN and BM3D.
PSNR results for 2.5%, 5.0% and 7.5% noise levels are shown in (a), (b), (c)
respectively with reference to number of images used for linear combination.
PSNR and SSIM are improved in BDnCNN based ParBID, while BM3D based ParBID show
small or no improvements.
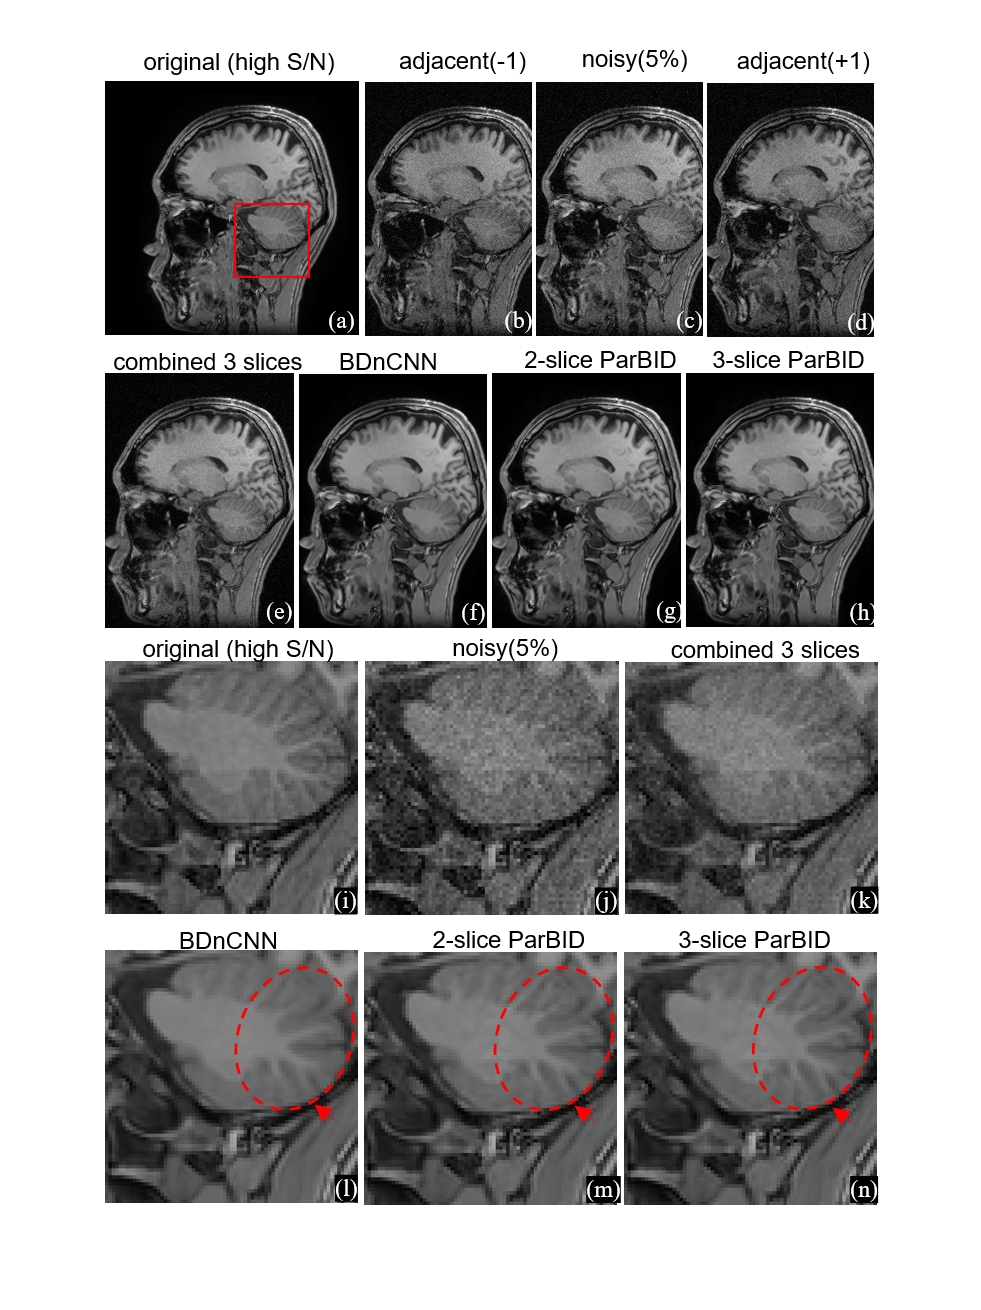
Figure 3. Denoised image with
ParBID in BDnCNN. Original image is shown in (a), and target noisy image is
(c). The linear combination of adjacent images (b), (d) is shown in image (e).
Subimages (e) through (h) show the denoised images using single-slice BDnCNN
and the 2- and 3-slice ParBID using BDnCNN. Subimages (i) through (n) are the
enlarged images.
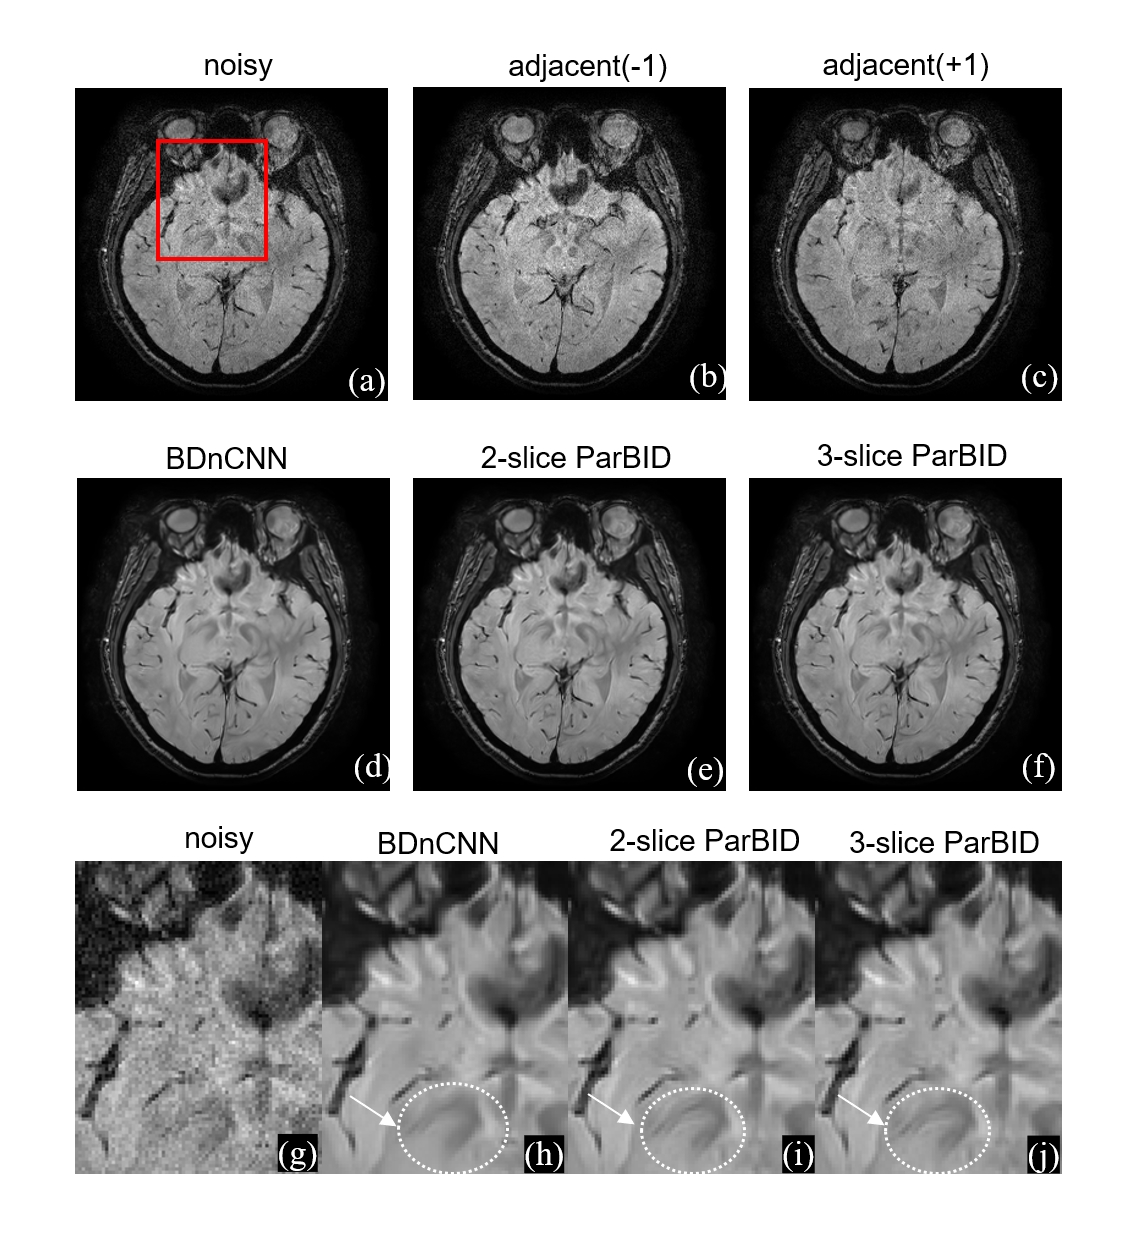
Figure 4. Results of application to experimentally obtained image. Magnitude
images (256×256) were used for testing. Subimage (a) is the target image, and
subimages (d) through (f) are denoised image by single slice BDnCNN, 2-slice, and 3-slice ParBID using BDnCNN, respectively. Subimages (g) through
(j) are enlarged images. Denoised images (f) and (j) obtained by 3-slice ParBID
clearly retain image contrast, as shown in the region indicated by the white
arrow.