2626
Phase-cycled balanced TFE disentangled using configuration states: Multi-purpose imaging for the MRI-Linac workflow
Astrid van Lier1, Yulia Shcherbakova1, and Cornelis van den Berg1
1UMC Utrecht, Utrecht, Netherlands
1UMC Utrecht, Utrecht, Netherlands
Synopsis
Phase
cycled bGRE images disentangled into configuration modes can be used to
generate alternative signal contrasts for for example for radiotherapy delineation purposes while
simultaneously geometrical errors due to B0 inhomogeneity can be quantified.
Numerical simulations show the change in modulation for different
configurations states. In vivo experiments on the male pelvis are used to illustrate
the changed image contrast and obtained B0 map against the reference method.
Introduction
Objectives for MRI image contrasts on an MRI-Linac are plural: it should be fast (to reduce intrafraction motion), hold sufficient contrast (to delineate the tumor and organs at risk) and deliver information about possible geometrical errors (through B0 inhomogeneities). It is desired that a single image acquisition holds this information to ease delineation and treatment planning. Here we show that the magnitude and phase images derived configuration space analysis [1] of phase-cycled (PC) balanced GRE acquisition can fulfill this task. We show that representation of the MRI PC signals in configuration states allows for manipulation of the standard bGRE mixed T2/T1 contrast towards a T1w contrast while simultaneously compensating for banding artifacts and obtaining the B0 field. Alteration in contrast between the prostate, rectal wall and the obturator internus is measured to exemplify the advantage of this technique.Methods
Using numerical solutions of bGRE and configuration states signal equations [2] for a physiologically relevant range of T1 and T2 values, we calculate the signal modulation of standard PC-bGRE and the configuration states for the in vivo experiment detailed hereafter. For standard PC-bGRE, modulation of sum-of-squares (SoS) signal is used. In a healthy male volunteer we measured a PC- bGRE of the pelvis using 7 phase cycles (1.5T, TR = 9.2 ms, TE = 4.6 ms, flip angle = 30°) along with a B0 map for reference (TE1/TE2 = 4.6/9.2ms). The configuration states were disentangled by a fourier analysis over the phase cycles, using the standard ‘fft’ routine in Matlab. Signal intensity was measured in prostate, rectum, obturator internus by delineating those structures. For reference, the SoS over all PCs was taken.Results
In figure 1 the signal modulation as a function of T1 and T2 for the different methods is show-cased. For the in vivo example M0, M1 and M-1 and SoS images are derived (figure 2) to illustrate the signal modulation. Contrast differences are objectified by measuring the relative contrast (figure 3). Using the phase of the complex fourier elements S0 and S-1, a B0 map is derived which is displayed along a reference method B0 map (figure 4).Discussion
The balanced GRE signal is modulated by the well-known T2/T1 ratio (figure 1). While for the configuration states M0, M1 and M-1 the signal modulates mostly though variations in T1 (for higher T2 values). Though the modulation pattern for the modes at higher T2 is similar, the amplitude of the modulation is different. For T2 ~< 10 ms, M-1 and M1 show a sudden drop in signal intensity. The variation in contrast and modulation becomes apparent while looking at the signal intensity difference between rectum and prostate (figure 2). Also, a small hyper intense lesion in the prostate is only visible in the SoS and M0 image. Furthermore, the hyper intense signal of free water (urine) is moderated in the M0 and M1 image, though for M0 the simultaneously the bright fat signal is maintained allowing better visualization of the bladder wall. Quantitatively M-1 shows a beneficial contrast for differentiating between prostate and the adjacent rectum and obturator internus (figure 3). The configuration based B0 map shows a similar pattern and amplitude of B0 inhomogeneity. For example, the inhomogeneity ventrally is nicely depicted. In a MR Linac workflow, B0 inhomogeneity close to the skin alter the appearance of the body contour. This has a direct effect on the calculated radiological path length. The effect of sequence parameter setting and minimal number of required PCs on the obtained contrast and B0 map accuracy will be further explored.Conclusion
Phase cycled bGRE images disentangled into configuration modes can be used to generate alternative image contrasts for delineation purposes while simultaneously geometrical errors due to B0 inhomogeneity can be obtained. Each image highlighting different features. Differences in contrast can be exploited to improve target and OAR visualization and delineation either using manual or automatic delineation routines using a single sequence. We foresee that, as this method uses readily available acquisition techniques and a straightforward numerical fourier deconvolution, offline configuration reconstructions will merely take seconds and can be used in the MRI-Linac workflow.Acknowledgements
No acknowledgement found.References
1 https://doi.org/10.1002/mrm.28542
2 https://doi.org/10.1002/mrm.20986
Figures
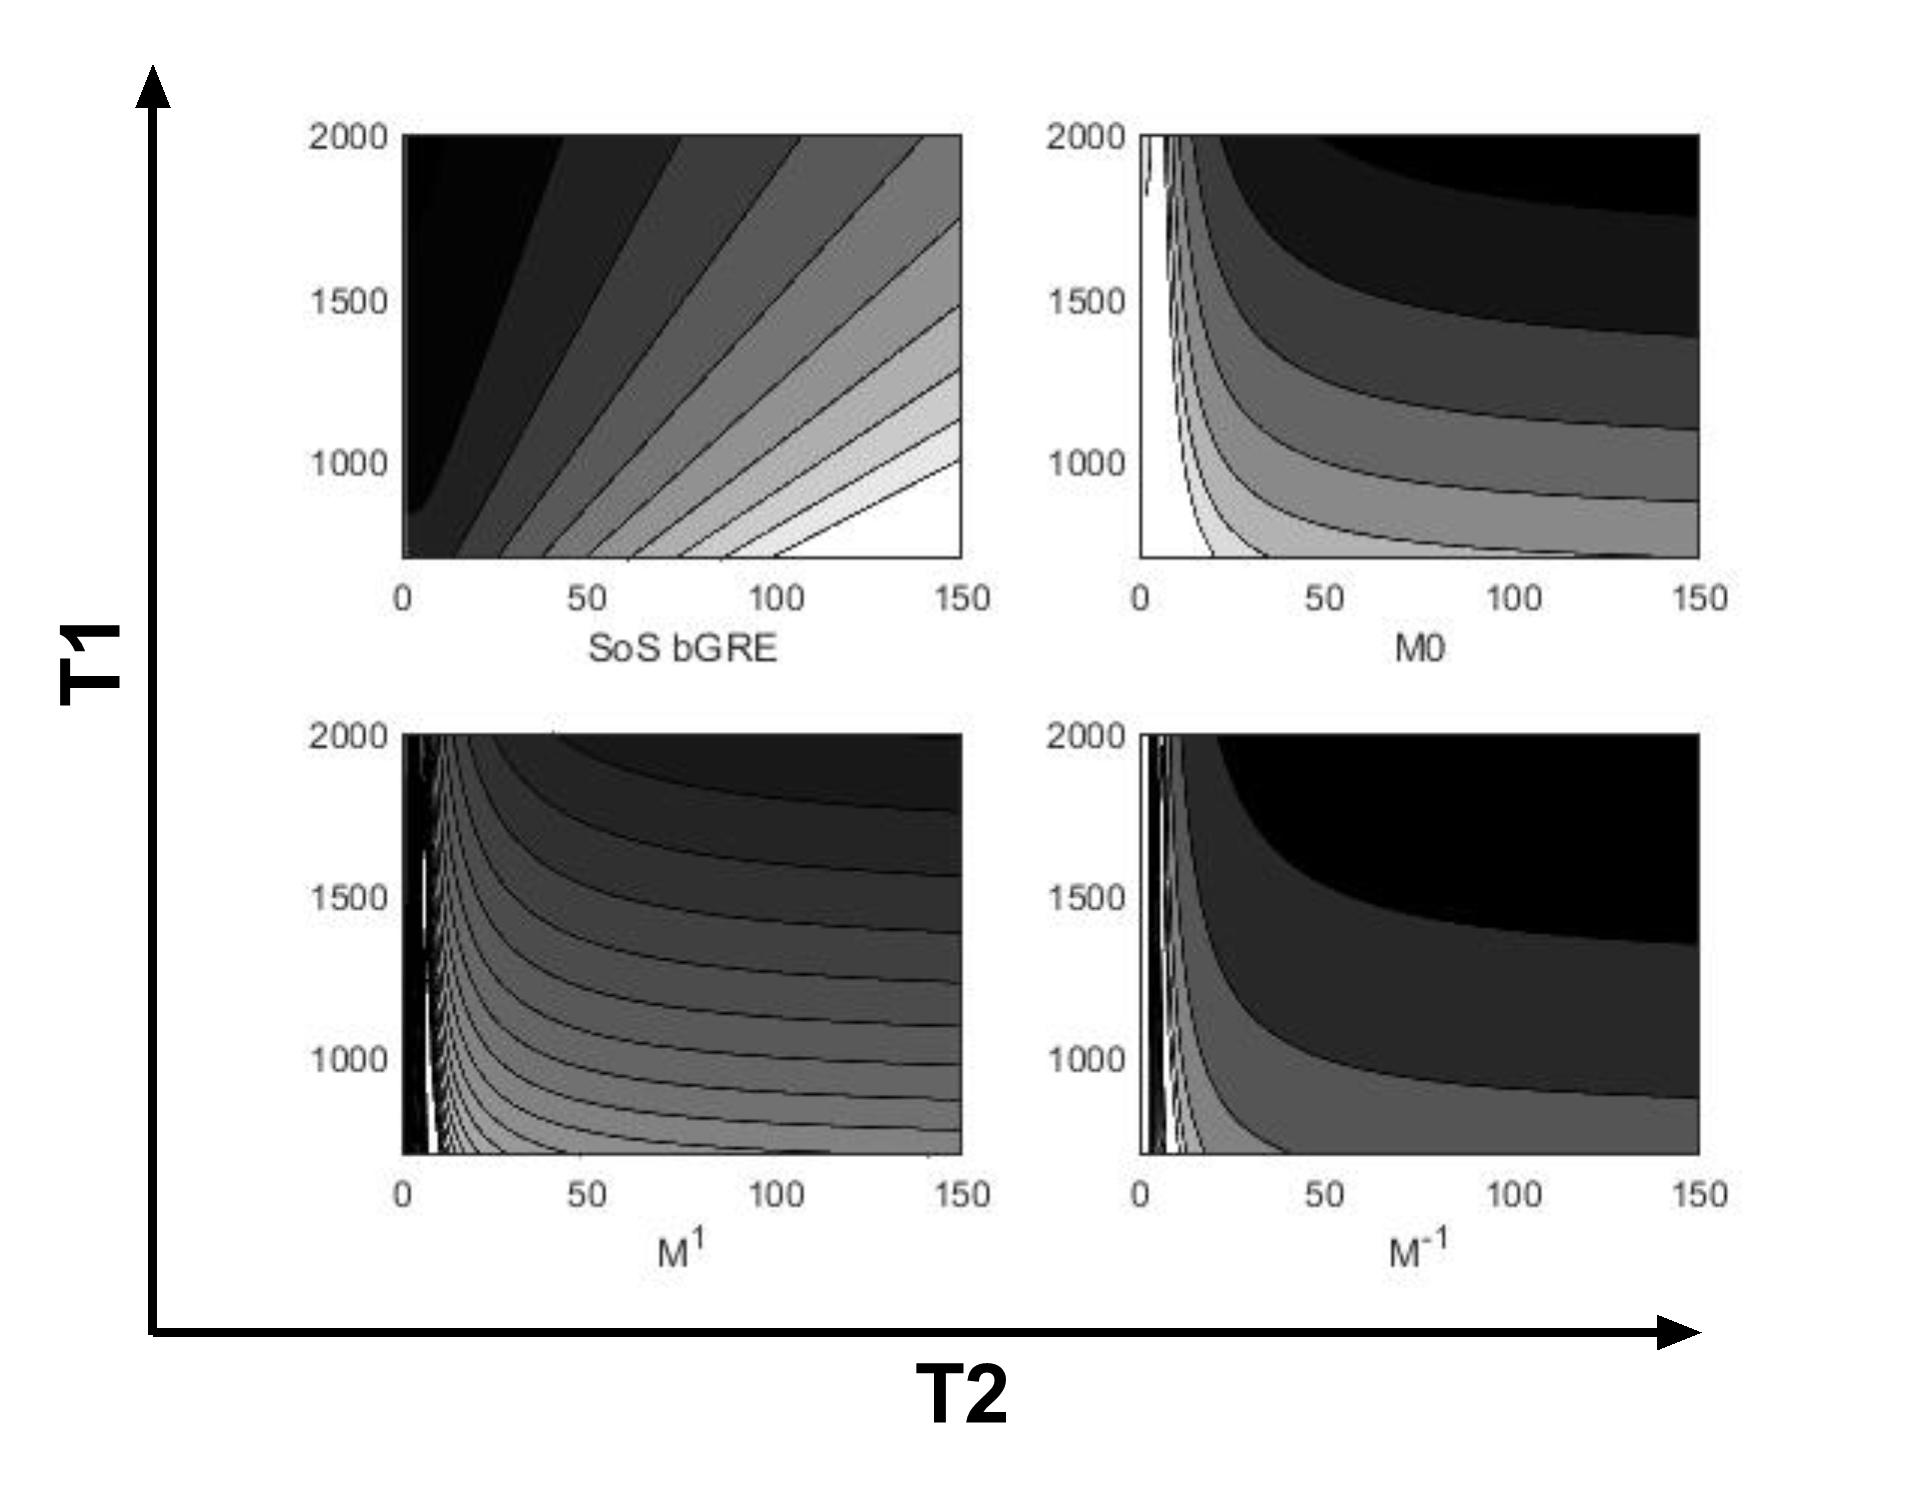
Signal
intensity as a function of T1 and T2 for the sum of squares (SoS) bGRE signal
and configuration states M0, M1 and M-1. For
the configuration states a logarithmic scale is used, each isocontour represents
the same amplitude of signal change. Please note, that proton density and
receive sensitivity also modulate image signal intensity, and are not accounted
for in this analysis.
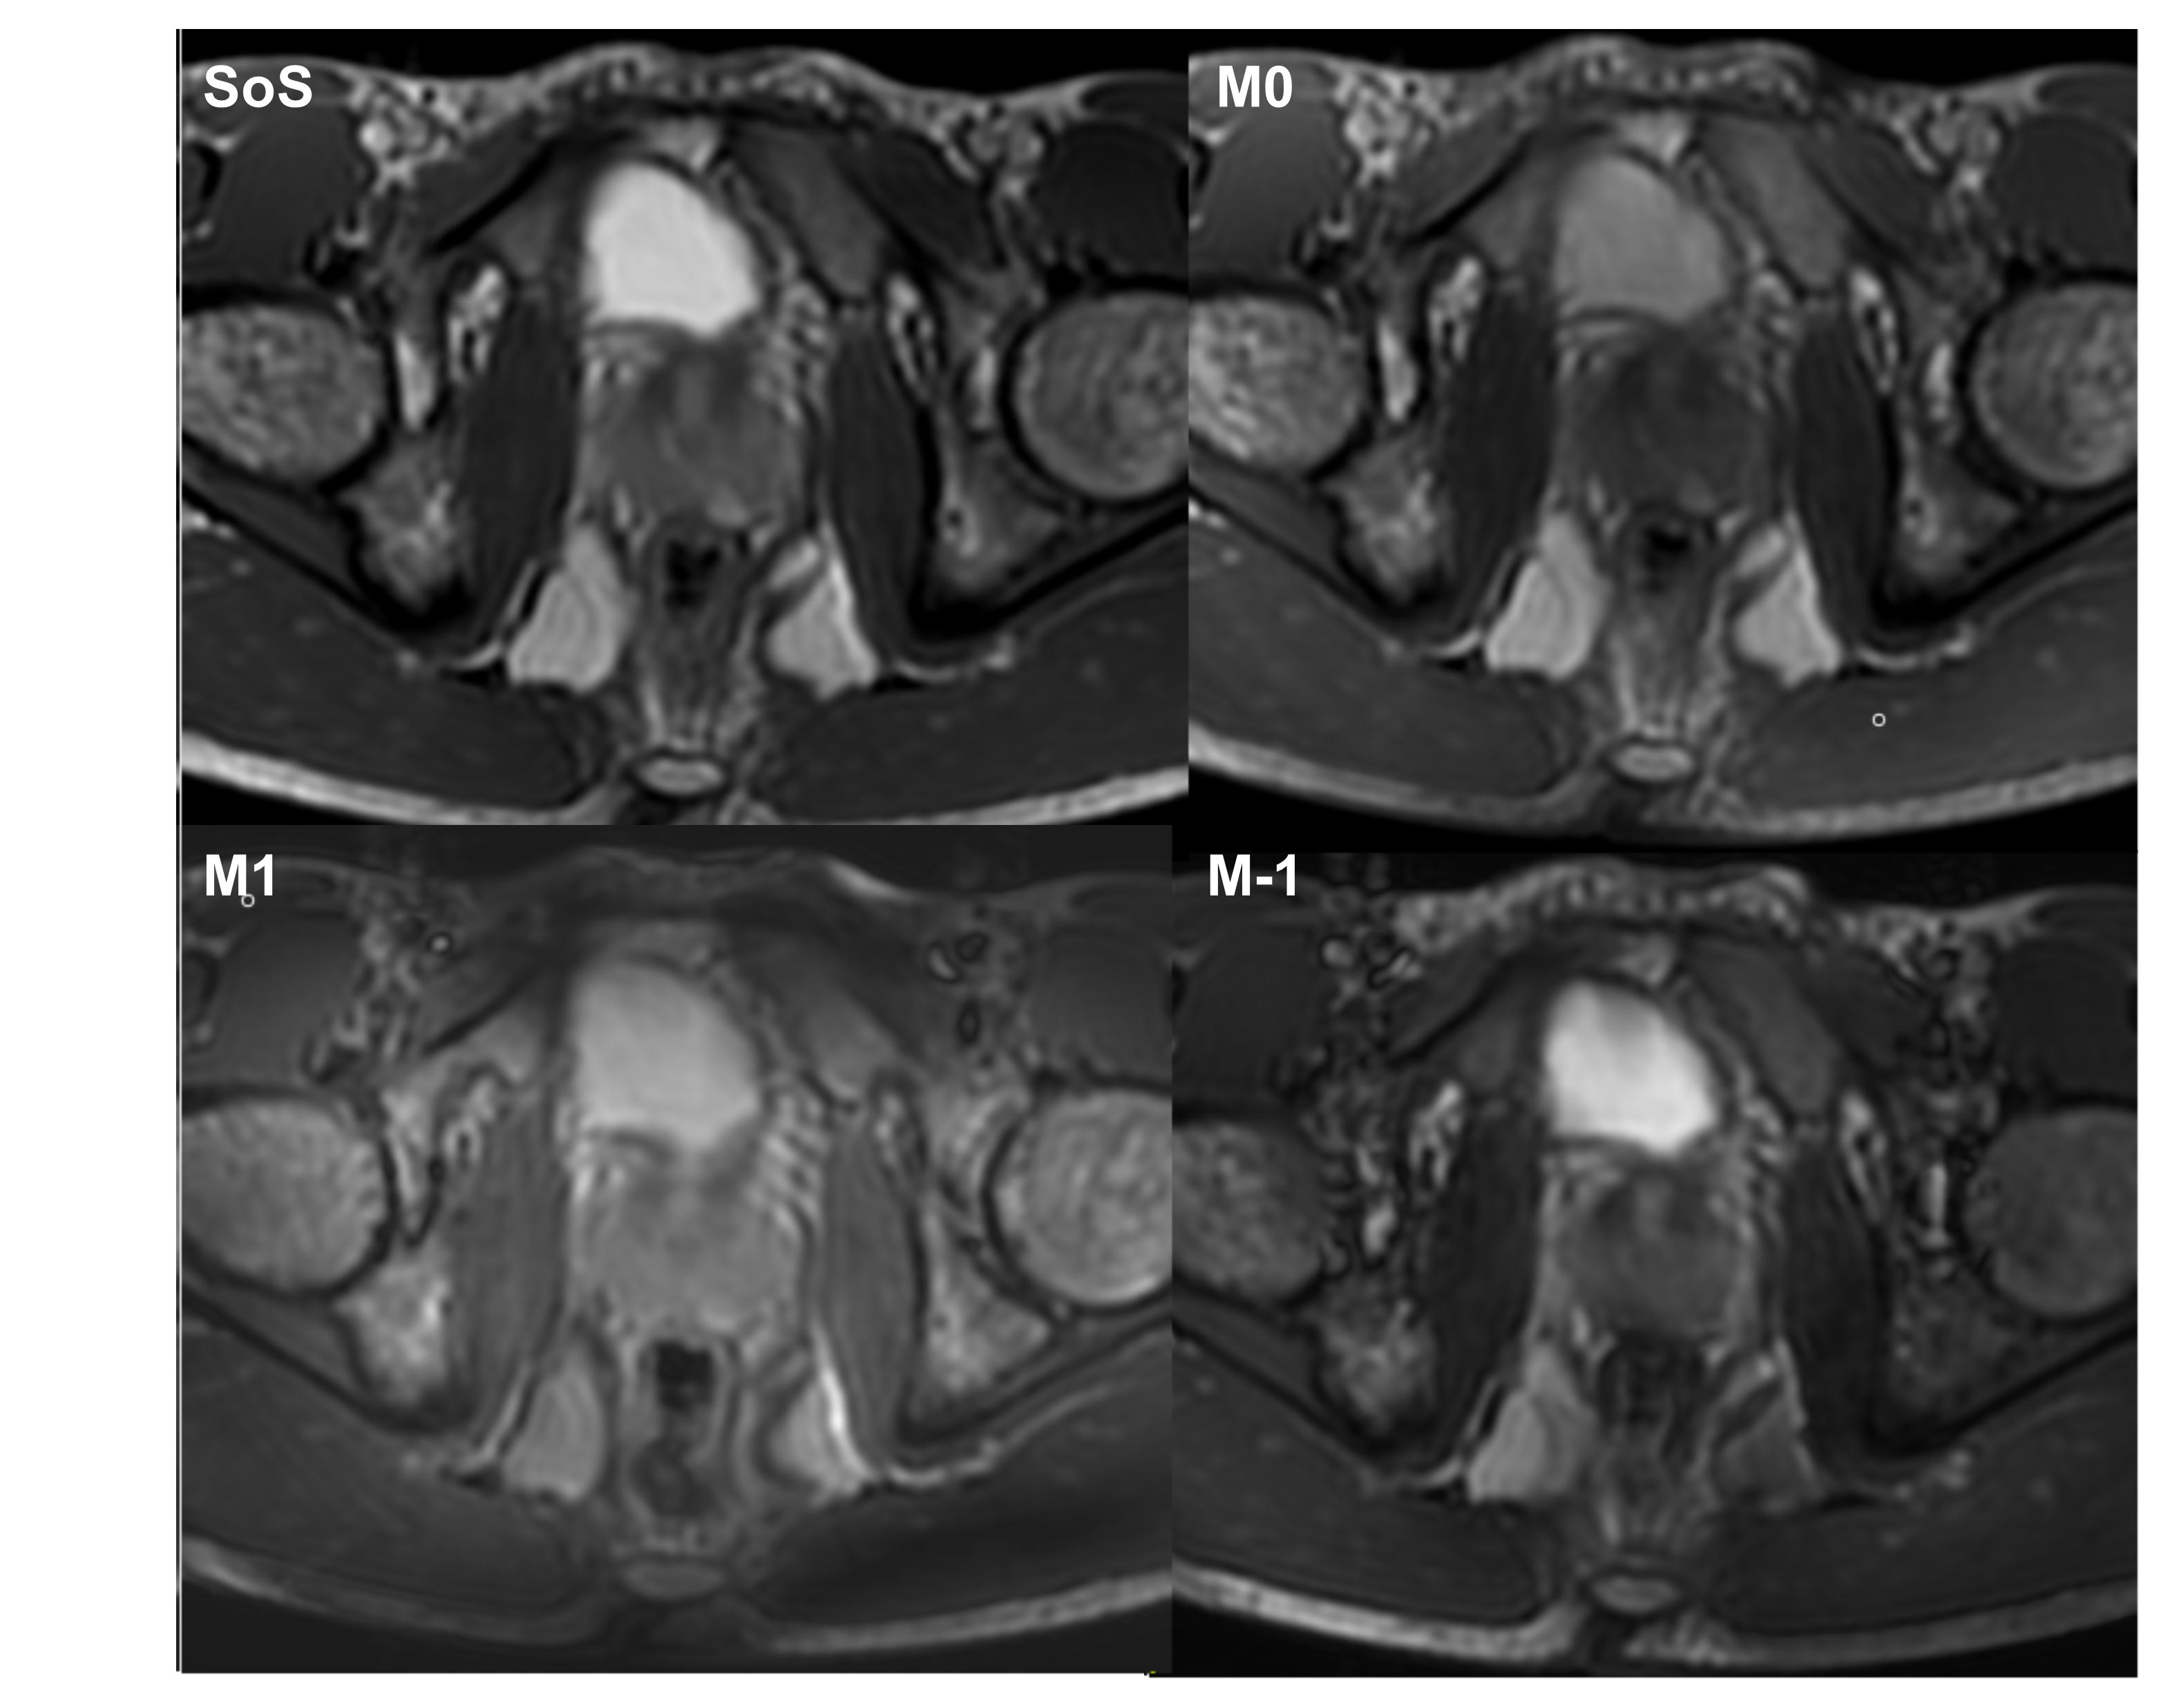
Phase
cycled bGRE scans of the male pelvis, shown as: sum of squares (SoS) bGRE
signal and first three configuration states M0, M1 and M-1.
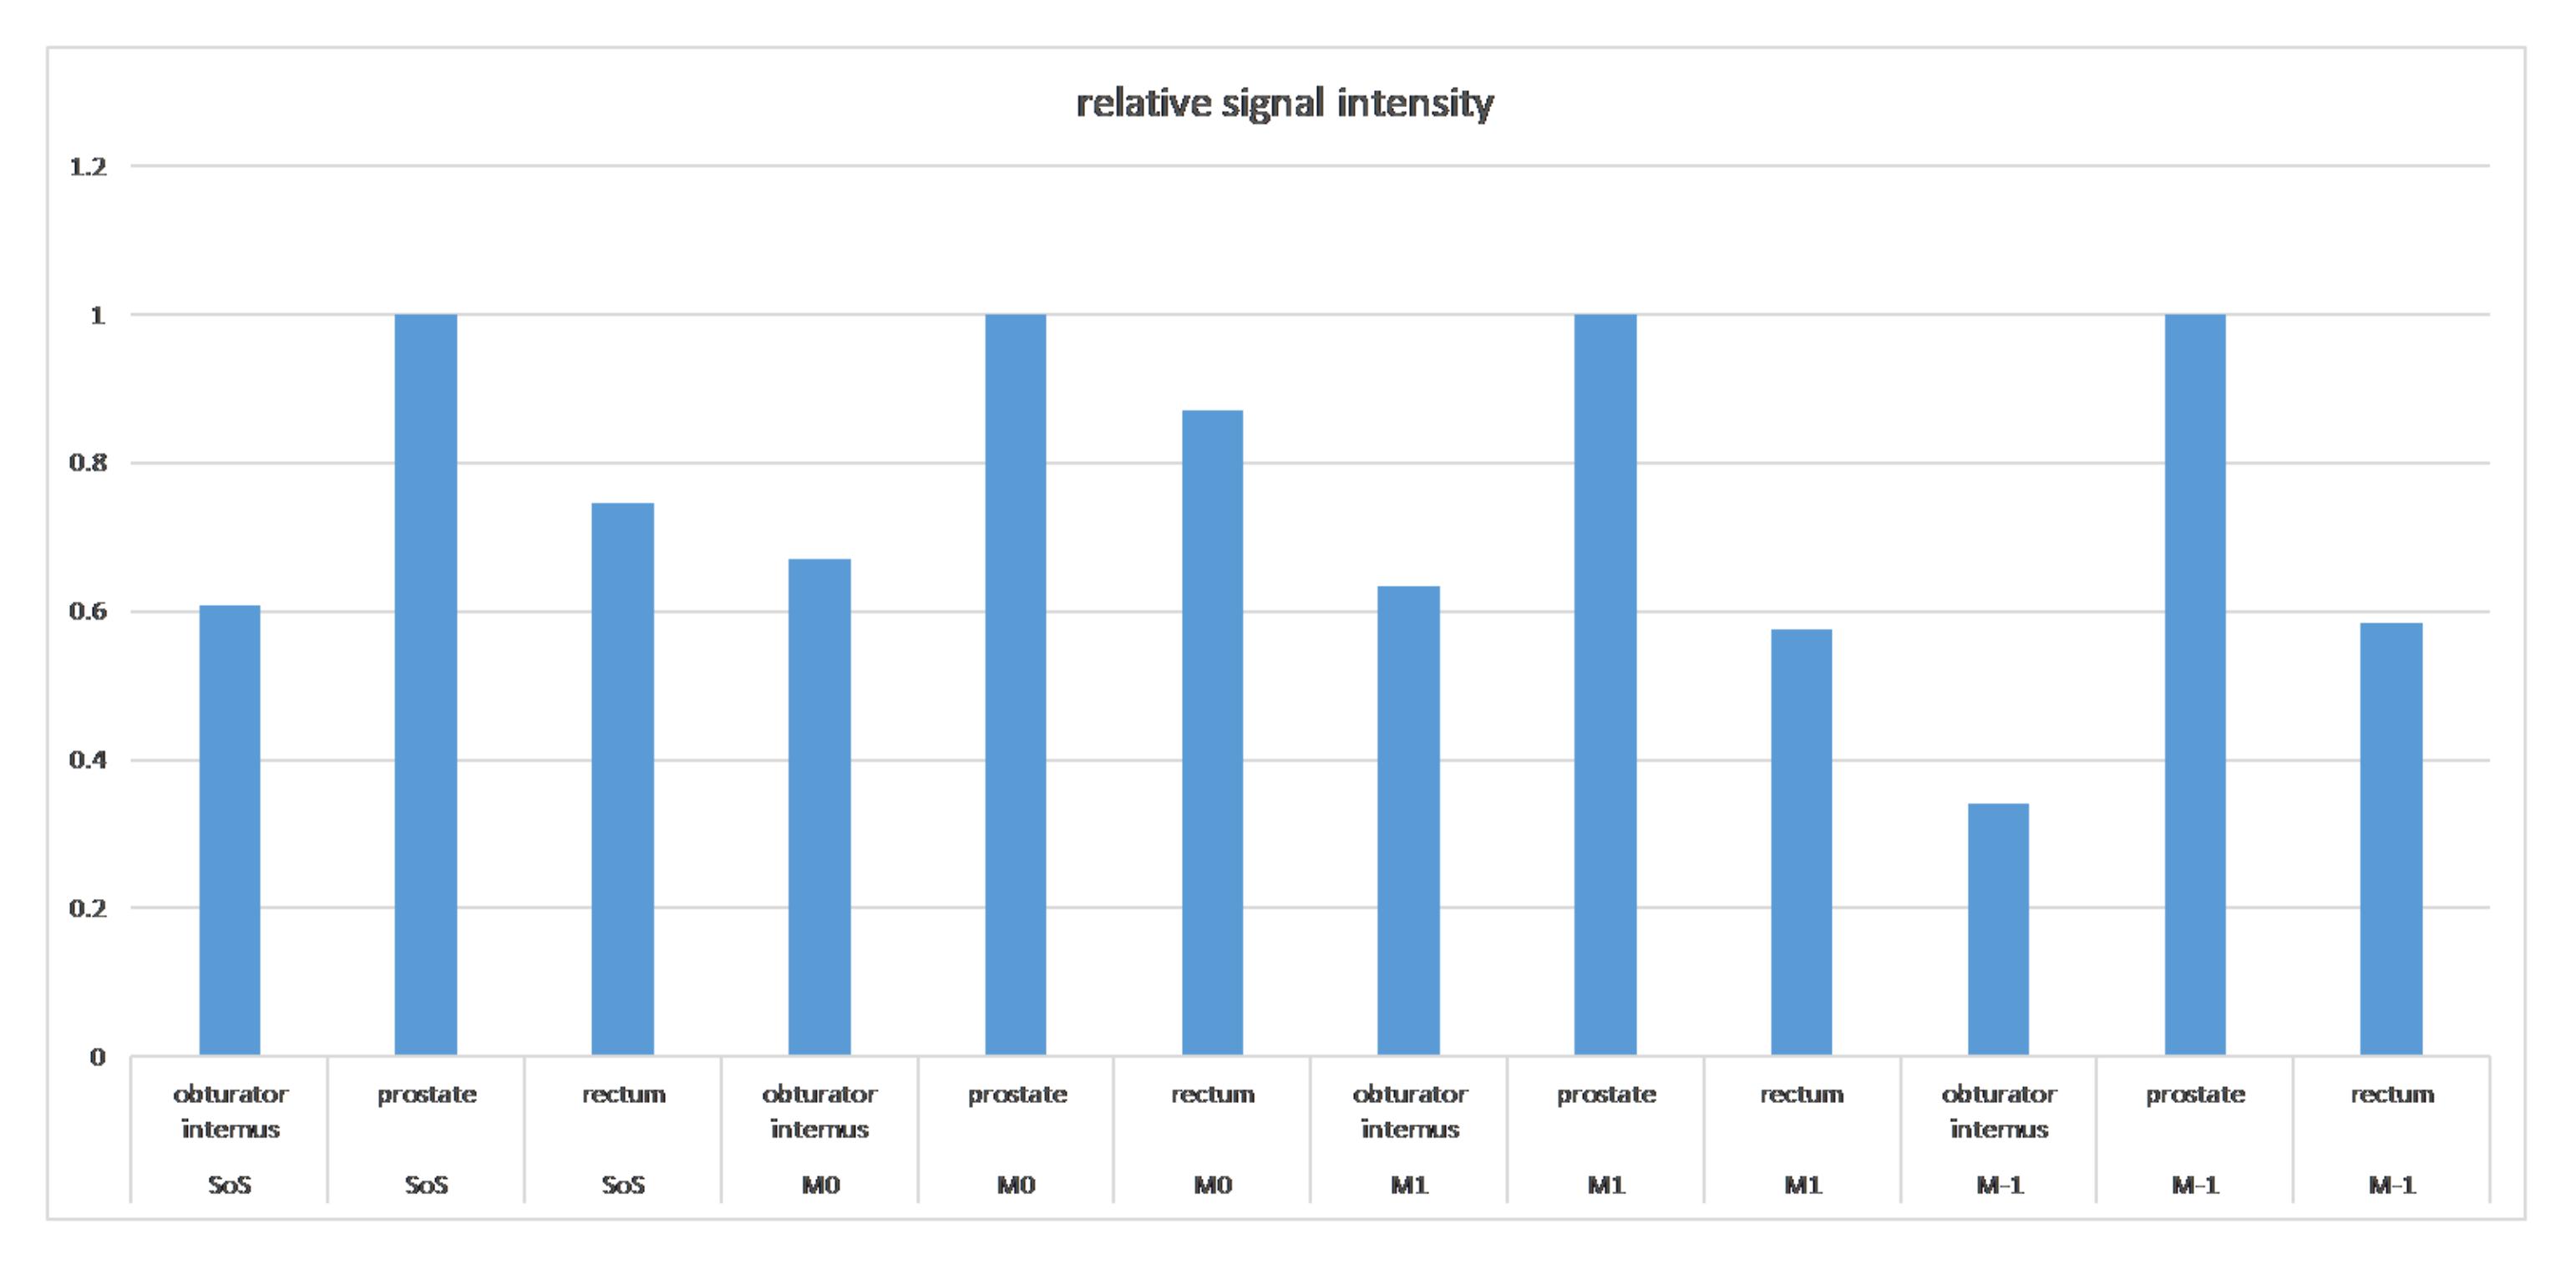
Relative signal intensity of
rectal wall and the obturator internus with repect to the prostate for the SoS bGRE image and the M0, M1 and M-1 configuration states.
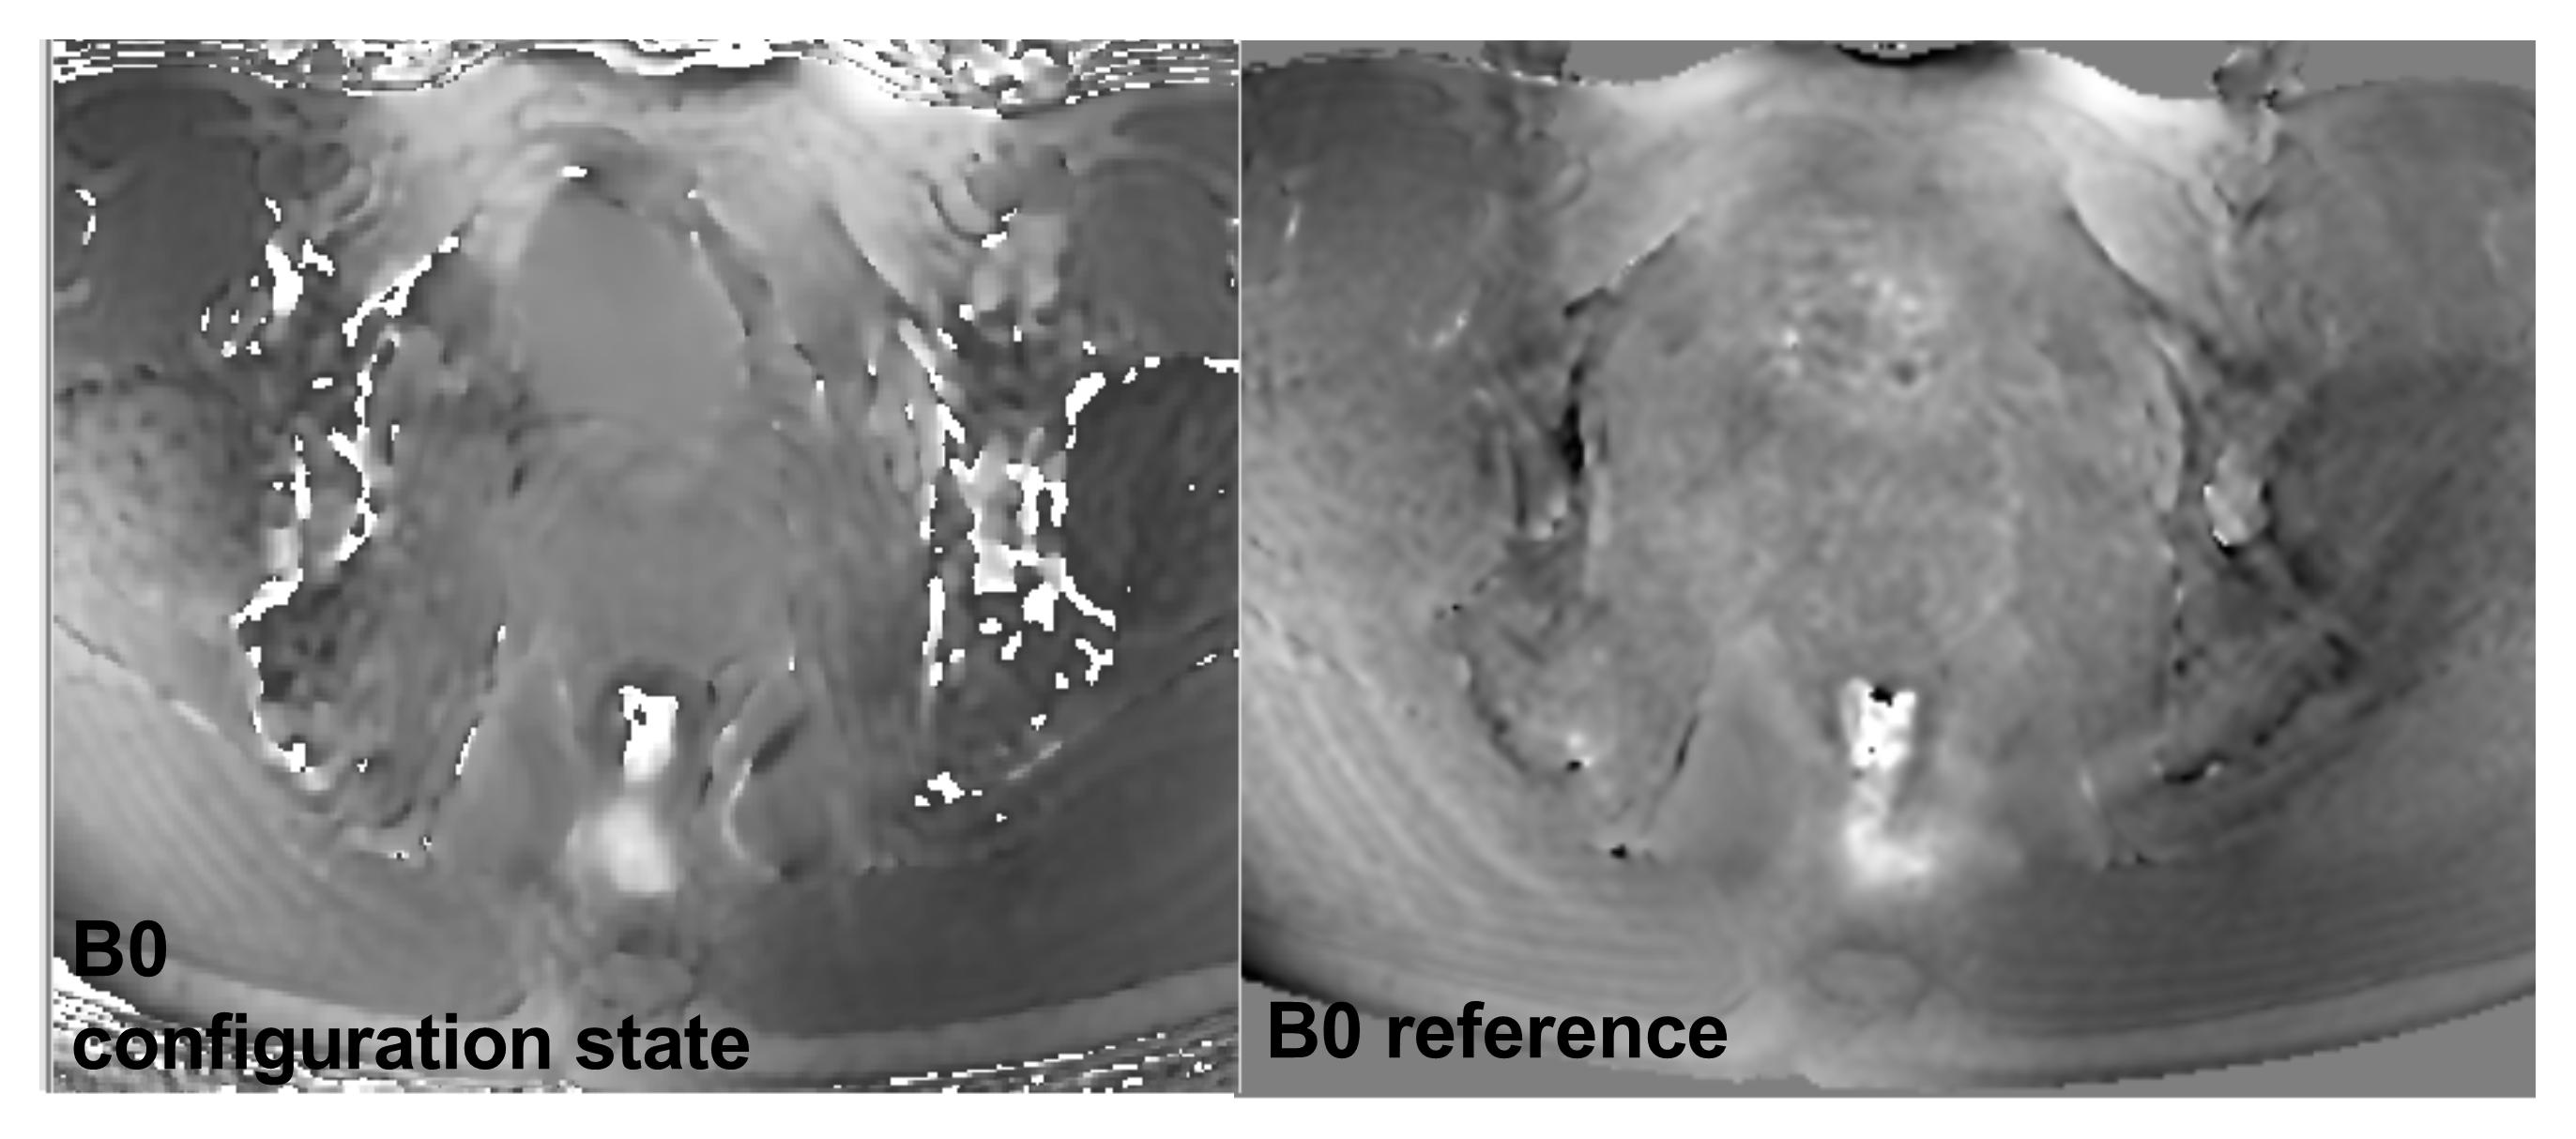
B0
map derived through configuration states and the reference method. Both methods
are scaled to show the same range of off-resonance (100 Hz)