2625
Optimised sampling for low-dimensional compressed sensing1Physics, University of Nottingham, Nottingham, United Kingdom, 2Medicine, University of Nottingham, Nottingham, United Kingdom
Synopsis
Optimising compressed sensing sampling can yield a significant increase in measured and observed image quality over heuristic sampling methods. Using an example image, such as a previous acquired scan of the same anatomy, a bespoke sampling pattern can be designed that optimally samples the data. This increase in image quality allows for greater acceleration or better SNR with the same imaging time over standard methods such as variable density Poisson disc sampling. This has been tested on a 0.5T upright MR scanner in phantoms.
Introduction
High resolution, high dimensional imaging is easily accelerated with compressed sensing methods as the data sets are highly compressible1, but low dimensional, low resolution imaging also requires acceleration. The sampling schemes used in compressed sensing experiments are not often given much attention. It is known that the sampling should not introduce coherent artifacts and there are heuristics used to achieve this, such as Poisson disc sampling1. Variable density sampling is advantageous as the centre of k-space often contributes most to image quality. Heuristic methods give acceptable results over a wide range of different cases, however, it is likely that it is possible to design the sampling process for the expected spatial frequency content of the scan and so achieve superior results. The frequency distribution of MR data varies significantly from mostly low frequency in smooth body tissues to more high frequency weighted in MR angiography. Typically a single parameter is tuned to account for this (in power-law distributions), but much more control can be applied. This work proposes a simple method for optimising a sampling pattern for a particular image based on previous scans of similar anatomy and contrast, and test it in phantom images assessed by image quality metrics and visual inspection.Theory
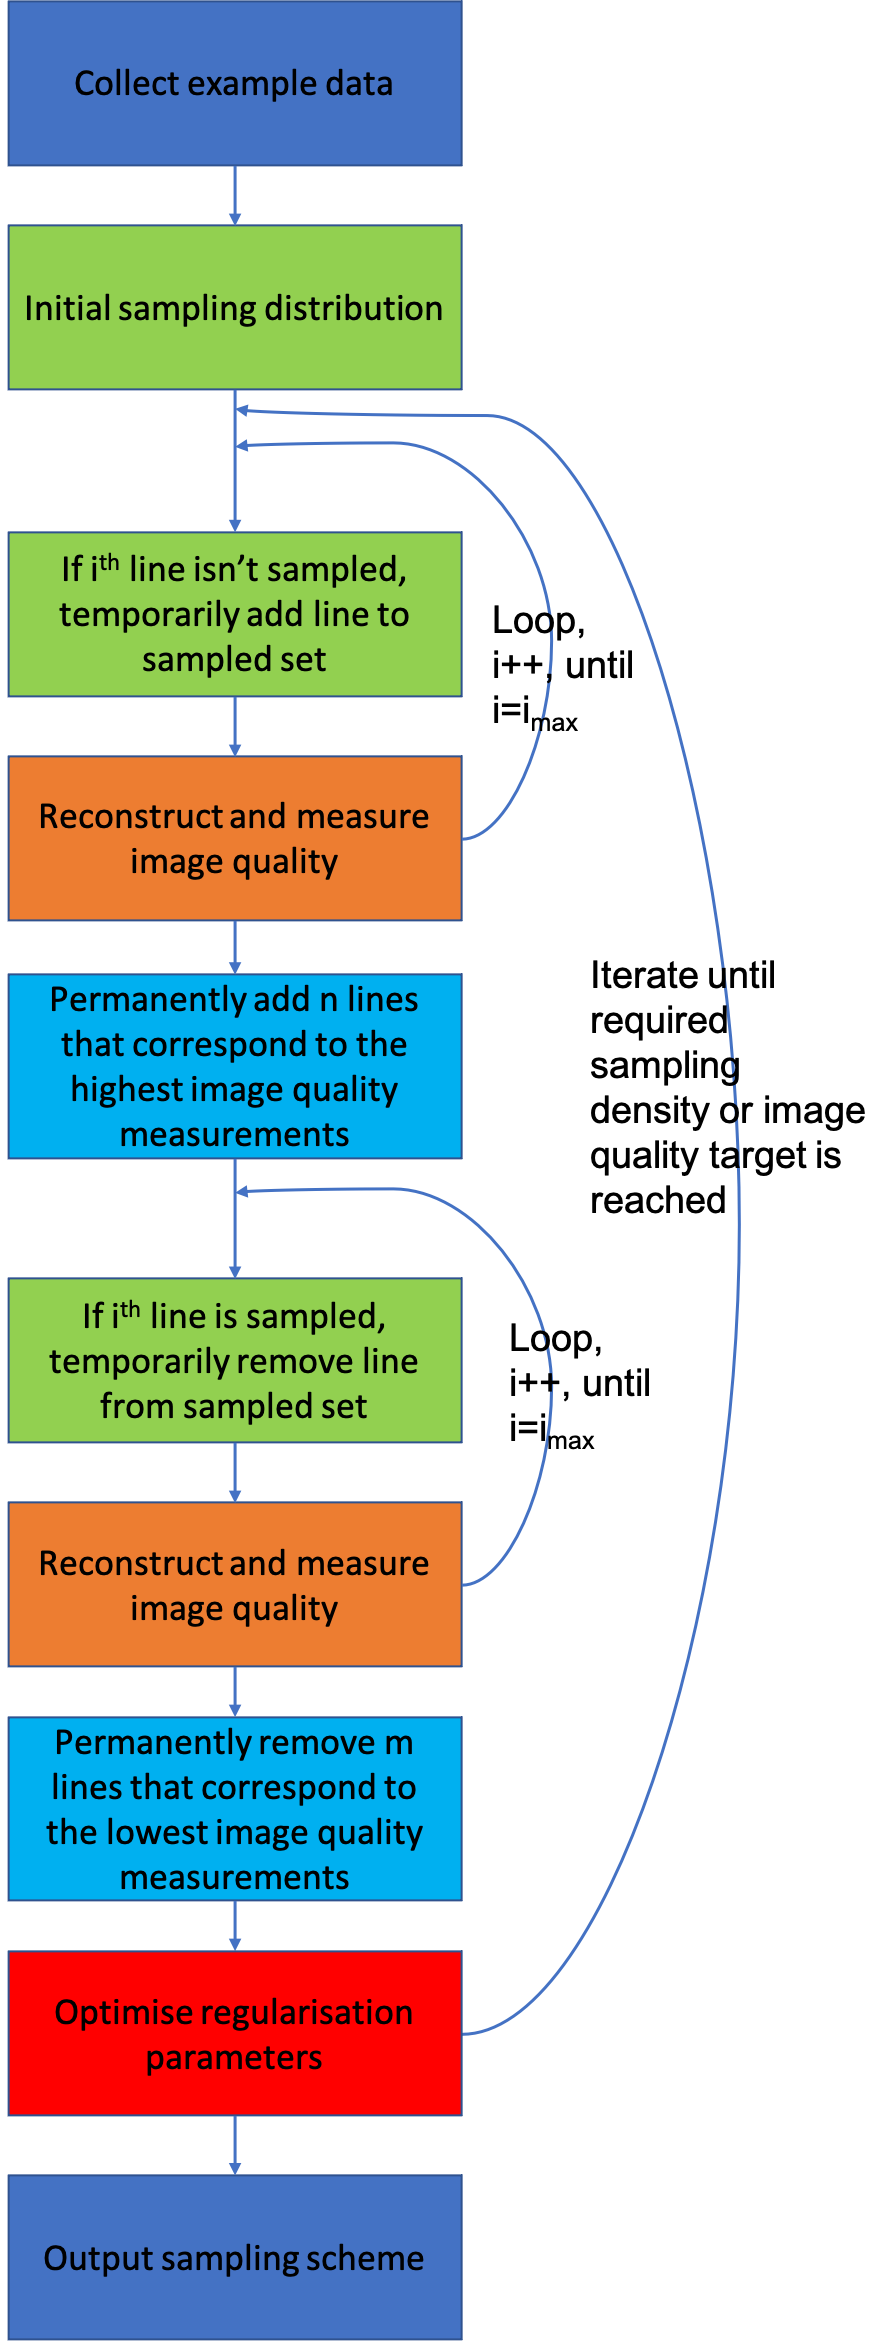
A flowchart showing the outline of the optimisation process is shown in Figure 1. To optimise the sampling process an optimisation scan with similar frequency content to the target scan is required, i.e. and image the same anatomy and pulse sequence but fully sampled – we scanned a phantom; however, a database of scans could be used. A sampling scheme is designed by a simple optimisation algorithm (a global search is not viable) where each k-space line is added to a 'working sampling mask' (the sampling pattern with the permanently added k-space lines) and (after reconstruction in BART2) the resultant image quality is computed, using pixel-wise correlation (in this case). The n k-space lines that result in the best image quality metric scores are added to the working mask. A similar process is then applied, by test-removing k-space lines in turn, and the m least important lines are then removed from the working mask. At each step of this process n-m lines are added to the working mask and sampling is considered the best sampling at this density (although it is likely not global optima). If n = m then an initial sampling distribution can be iteratively optimised by shuffling around the sampled lines. The process is continued until the undersampling factor or local maxima is reached. At each iteration the regularisation parameters for the reconstruction are also optimised – as more regularisation is needed in the earlier stages of the optimisation. Other requirements such as a fixed fully sampled central region can be easily incorporated.Experiment
The acquisition used was a 2D T1-weighted sequence with 256 phase encode lines, 18 slices, and a single receive channel (10mm slice, 0mm slice gap) on a Paramed MROpen 0.5T scanner. An ACR phantom was imaged with full coverage of k-space. A single slice within the phantom was selected as the example image. Sampling patterns in a range of different densities were calculated using the proposed method and variable density Poisson disc (VDP)(implemented in BART). 5 fully sampled images were acquired before the undersampled data was acquired, and 5 afterwards to estimate test-retest variation. Small movements were introduced between each set of data. The data was rigidly aligned, in-plane, to the first set of fully sampled data, but out-of-plane movements were not corrected, leading to a lower than expected test-retest consistency even in the fully sampled data. Three image quality metrics were used, chosen as being sensitive to different aspects of the image, were used to evaluate the image quality: pixel-wise correlation (which is intensity scale invariant), root mean squared error (RMSE), and visual information fidelity (VIF) (which correlates well with Radiologist scoring of image quality3). The image quality metric scores were compared against the test-retest scores.results
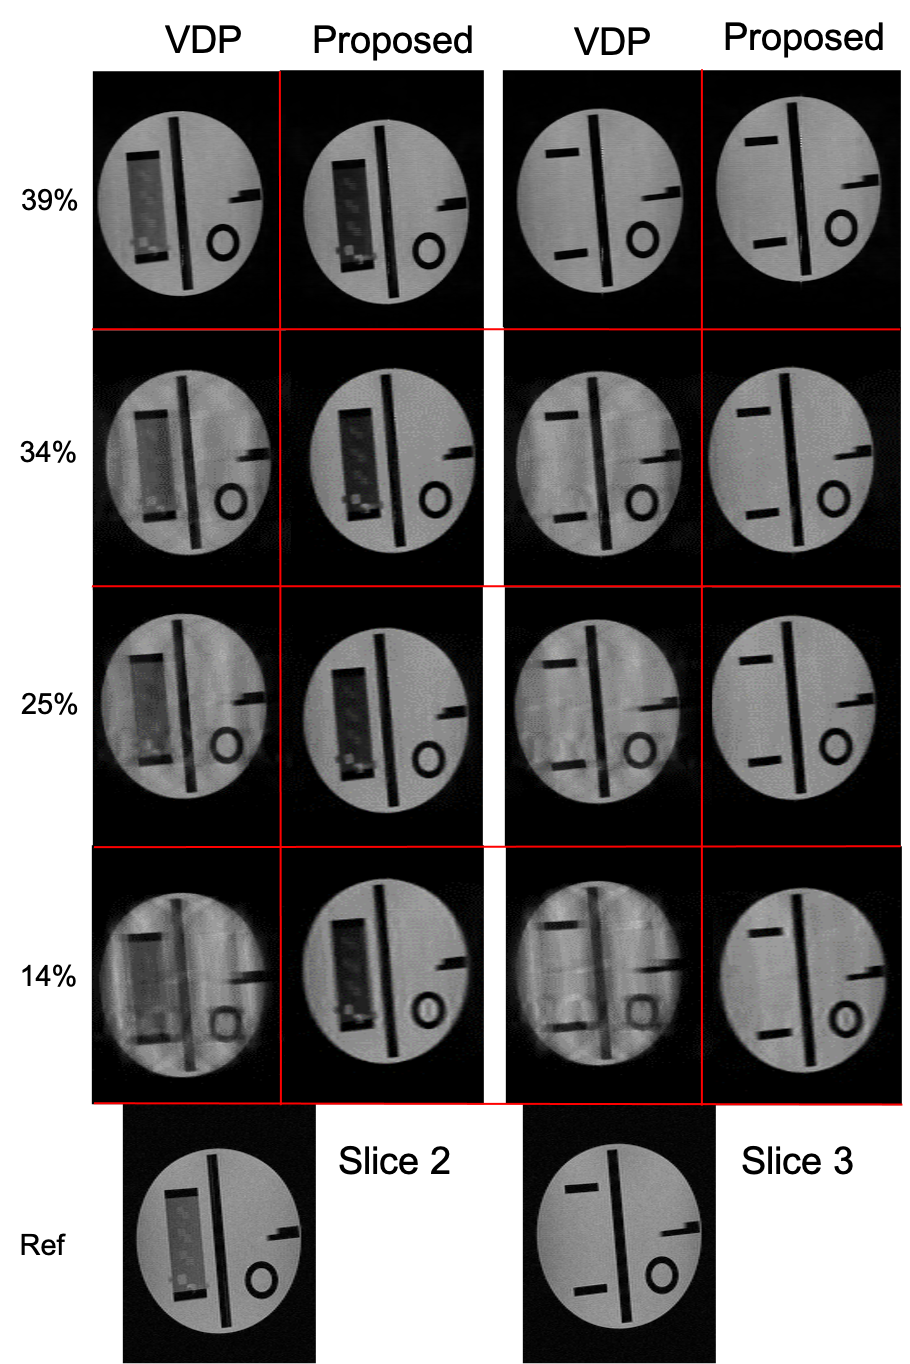
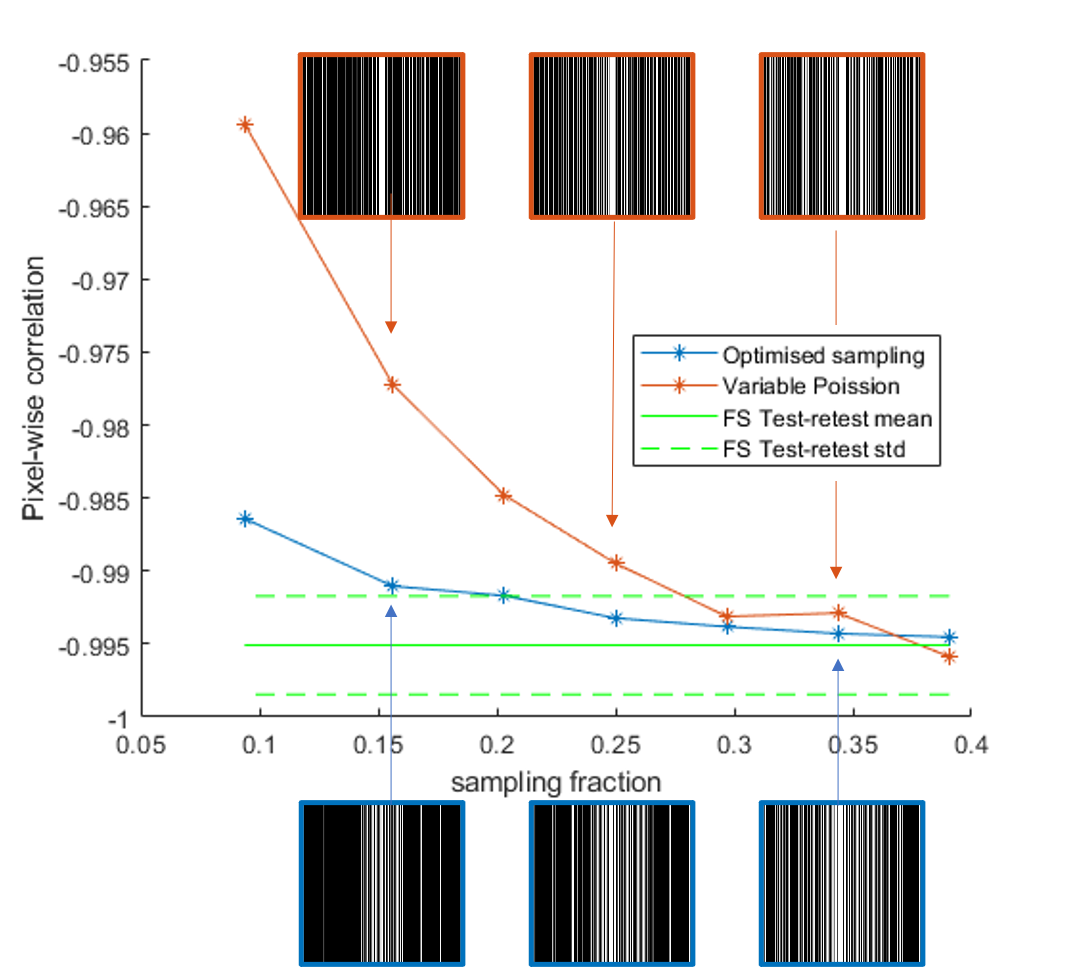
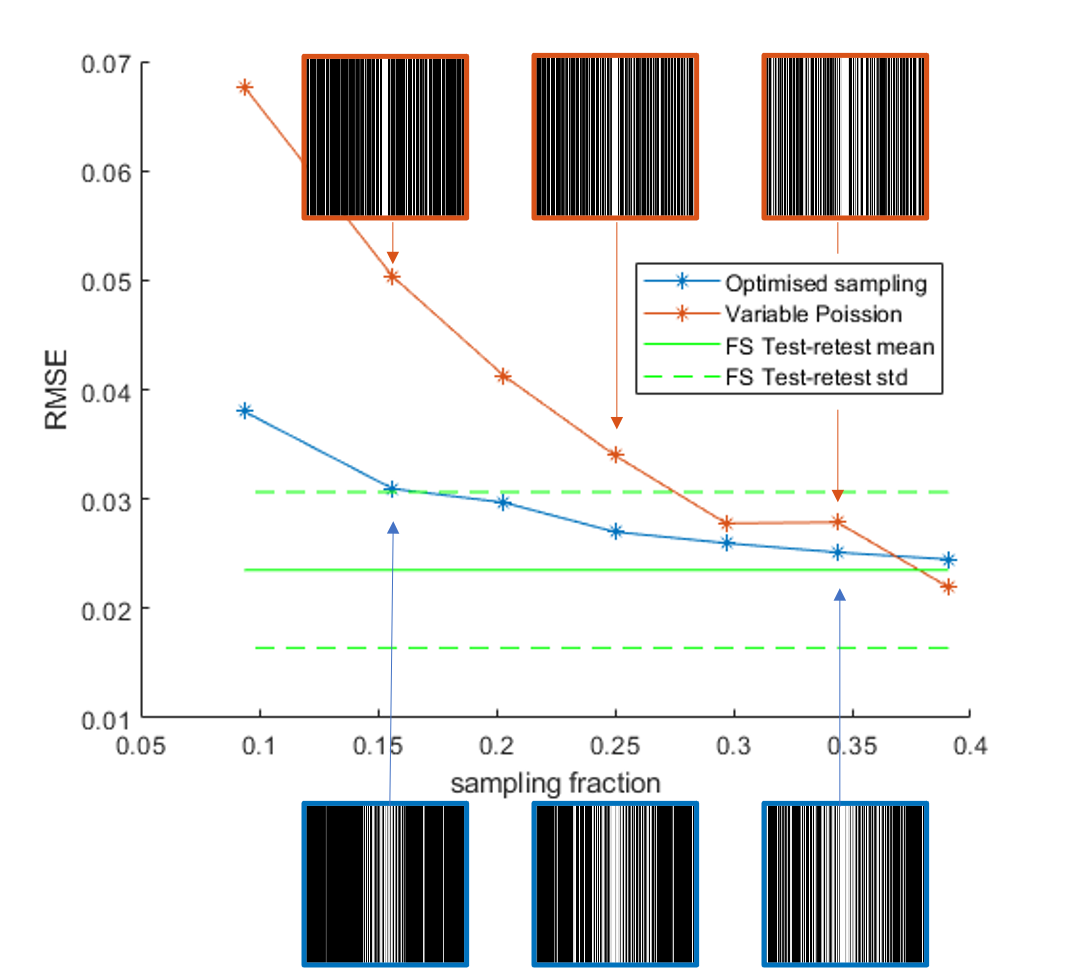
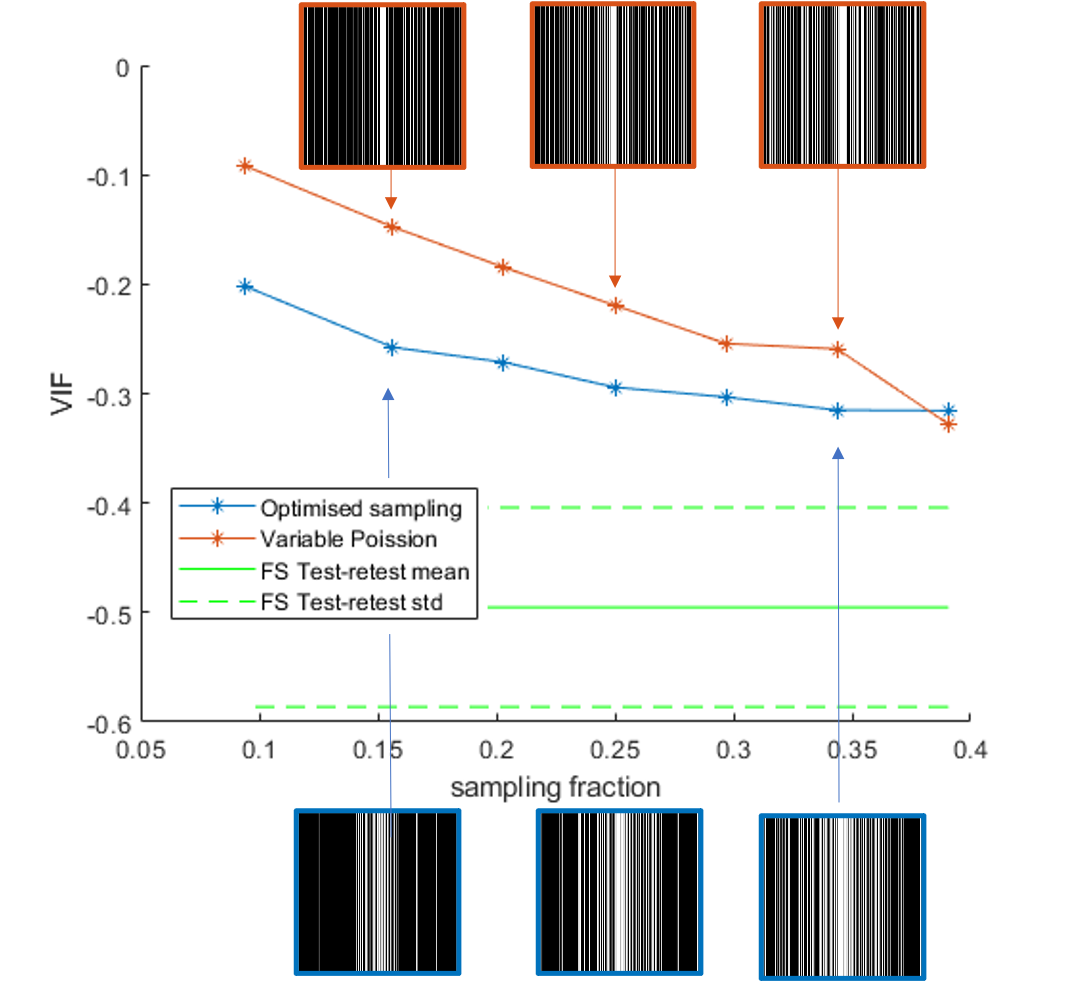
Figure 2 shows consecutive example slices through the phantom each showing the VDP sampling and optimised sampling at sampling densities as well as a fully sampled image. Slight variations in the slice location contribute to low image quality metric scores in some cases. It also show much higher image quality in the optimised sampling than in the VDP. This difference is reduced at higher sampling densities exceeding about 39%. These results are summarised in figures 3-5 and show image quality as a function of sampling density for each image quality metric.Discussion
For each metric, the optimised sampling performs better than the VDP especially at low sampling densities. At high sampling densities (>30%) the metric scores are comparable, or within the test-retest region. This is probably due to imperfect registration of the images. Visually, the optimised sampling looks better in all cases up to and including 34% and at 39% the VDP and optimised sampling are equally good.Conclusion
These results suggest that high acceleration of low dimensional (2D) data can yield significant improvements in image quality if the under sampling scheme is optimised instead of using a heuristic scheme.Acknowledgements
No acknowledgement found.References
1. Lustig, M., Donoho, D. and Pauly, J.M., 2007. Sparse MRI: The application of compressed sensing for rapid MR imaging. Magnetic Resonance in Medicine: An Official Journal of the International Society for Magnetic Resonance in Medicine, 58(6), pp.1182-1195.
2. Uecker M, Ong F, Tamir JI, et al. Berkeley advanced reconstruction toolbox. In: Proceedings of the International Society for Magnetic Resonance in Medicine, Toronto; 2015;23:2486.
3. Mason A, Rioux J, Clarke SE, Costa A, Schmidt M, Keough V, Huynh T, Beyea S. Comparison of Objective Image Quality Metrics to Expert Radiologists' Scoring of Diagnostic Quality of MR Images. IEEE Trans Med Imaging. 2020 Apr;39(4):1064-1072. doi: 10.1109/TMI.2019.2930338. Epub 2019 Sep 16. PMID: 31535985.
Figures